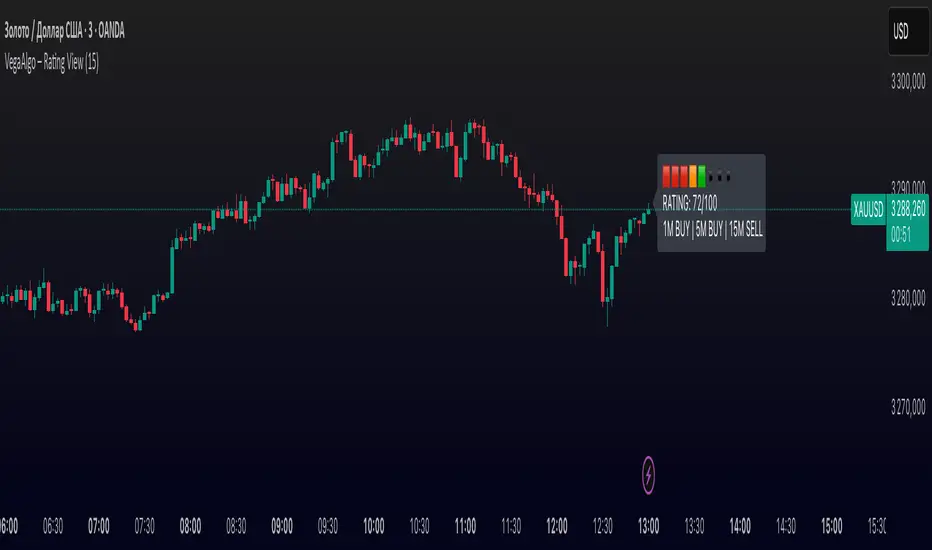
VegaAlgo – Rating ViewVegaAlgo – Rating View is a market condition analysis tool designed to evaluate the current price structure.
The indicator calculates a RATING (from 0 to 100) that reflects how clean, directional, and structured the recent price movement is. The rating is based on the number of price direction changes (from bullish to bearish candles and vice versa) within a selected period. Fewer direction changes indicate a clearer trend and result in a higher rating, while a choppy or highly volatile market leads to a lower score.
Additionally, the indicator provides directional signals on three key timeframes — 1M, 5M, and 15M, using a comparison of fast and slow moving averages. This allows traders to quickly assess the dominant trend both locally and across higher timeframes.
This script is intended for visual market analysis only and should not be considered financial advice.
Rating
VWAP + Candle-Rating SELL (close, robust)This multi‐timeframe setup first scans the 15-minute chart for strong bearish candles (body position in the bottom 40% of their range, i.e. rating 4 or 5) that close below the session VWAP. When it finds the first such “setup” of a trading period, it pins the low of that 15-minute candle as a trigger level and draws a persistent red line there. On the 5-minute chart, the strategy then waits for a similarly strong bearish candle (rating 4 or 5) to close below that marked low—at which point it emits a one‐time SELL signal. The trigger level remains in place (and additional sell signals are locked out) until the market “rescues” the price: a 15-minute bullish candle (rating 1 or 2) closing back above VWAP clears the old setup and allows the next valid bearish 15-minute candle to form a new trigger. This design ensures you only trade the most significant breakdowns after a clear bearish bias and avoids repeated signals until a genuine bullish reversal resets the system.

Buy-Sell-Hold RecommendationsDescription:
The indicator displays "recommendations" for the active symbol (Buy, Strong buy, Sell, Strong sell or Hold), based on the Tradingview's recommendations data. There are 3 presentations you can choose from:
- Bar -> displays a vertical/horizontal bar with sections for each rating
- Pie chart -> displays a pie chart with sections
- Table -> displays a table with score for each recommendation
Inputs:
- Display mode -> data presentation mode
- Position -> position of the bar/pie chart/table
- Highlight the highest rating -> recommendation(s) with highest score will be highlighted
- Buy, Strong buy, Sell, etc. -> colors of the "bar" sections
- Pixel Width, Pixel Height, etc. -> size of each "pixel" (cell) of the pie chart
- Resolution (X), Resolution (Y) -> how many pixels (cells) the pie chart has on each axis
- Inner area size (%) -> size of the empty space at the center of the pie chart
- Invert theme -> invert coloring scheme for "table" presentation mode
Notes:
- Tradingview seems to provide the recommendations only for major stocks
- Data is taken directly from Tradingview and is based on opinions of "analysts"

RSI Heatmap Screener [ChartPrime]The RSI Heatmap Screener is a versatile trading indicator designed to provide traders and investors with a deep understanding of their selected assets' market dynamics. It offers several key features to facilitate informed decision-making:
█ Custom Asset Selection:
The user can choose up to 30 assets that you want to analyze, allowing for a tailored experience.
█ Adjustable RSI Length:
Customize your analysis by adjusting the RSI length to align with your trading strategy.
█ RSI Heatmap:
The heatmap feature uses various colors to represent RSI values:
█ Color coding for labels:
Grey: Signifies a neutral RSI, indicating a balanced market.
Yellow: Suggests overbought conditions, advising caution.
Pale Red: Indicates mild overbought conditions in a strong area.
Bright Red: Represents strong overbought conditions, hinting at a potential downturn.
Pale Green: Signals mild oversold conditions with signs of recovery.
Dark Green: Denotes full oversold conditions, with potential for a bounce.
Purple: Highlights extremely oversold conditions, pointing to an opportunity for a relief bounce.
█ Levels:
Central Plot and Zones: The central plot displays the average RSI of the selected assets, offering an overview of market sentiment. Overbought and oversold zones in red and green provide clear reference points.
█ Hover Labels:
Hover over an asset to access details on various indicators like VWAP, Stochastic, SMA, TradingView ranking, and Volume Rating. Bullish and bearish indicators are marked with ticks and crosses, and a fire emoji denotes heavily overextended assets.
█ TradingView Ranking:
Utilize the TradingView ranking metric to assess an asset's performance and popularity.
Thank you to @tradingview for this ranking metric.
█ Volume Rating:
Gain insights into trading volumes for more informed decision-making.
█ Oscillator at the Bottom:
The RSI average for the entire market, presented in a normalized format, offers a broader market perspective. Green indicates a favorable buying area, while red suggests market overextension and potential short or sell opportunities.
█ Heatmap Visualization:
Historical RSI values for each selected asset are displayed. Red indicates overbought conditions, while green signals oversold conditions, helping you spot trends and potential turning points.
This screener is designed to make entering the market simpler and more comprehensive for all traders and investors.

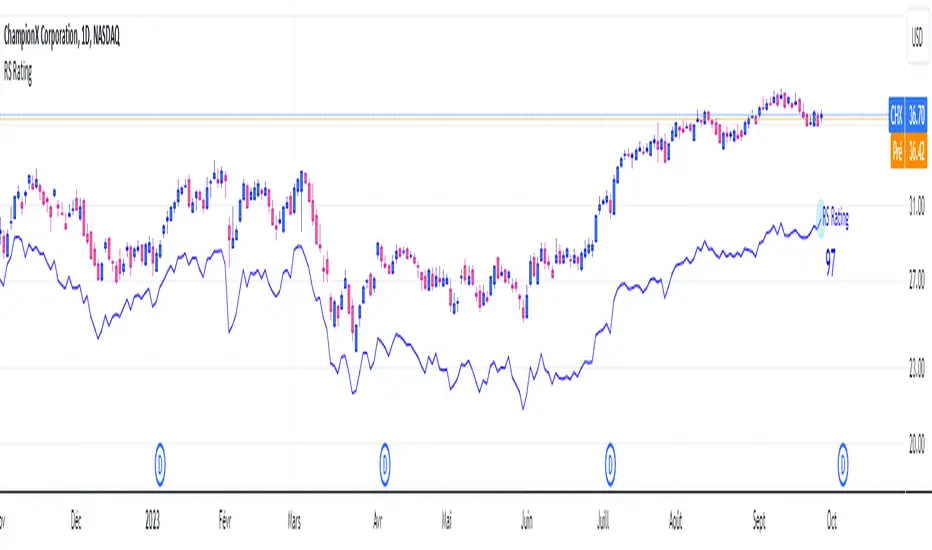
RS RatingHello everyone.
The RS Rating (or Relative Strenght Rating) is a metric that tracks a stock's price performance relative to the rest of the market. Specifically, it looks at a stock's relative strength over the last 52 weeks.
It allows you to identify at a glance stocks that are outperforming the market and may be poised for further gains.
Designed for break-out traders, trend follower, value investors, the RS Rating can help you identify promising opportunities and make informed investment decisions.
The Rating stands as follow:
- From 1 (worst) to 99 (best)
- 99 rating means the stock is outperforming 99% of all stocks in terms of relative share price performance over the last 52 weeks.
The RS Rating is accompanied by the RS line which is a representation of the progress of the asset against the comparative symbol. (Here SP500)
Of course this script is inspired by the IBD rating system.
The results may be equivalent but it is not guaranteed.
This indicator proposes a scoring system in the style of the one proposed by IBD.
Indeed for an optimal result, it would be necessary to compare the relative performance of all actions, which is not yet possible on PineScript.
Here is the formula for calculating the score:
RS Score = 40% * P3 + 20% * P6 + 20% * P9 + 20% * P12
With
P3 = Performance over the last 3 months
P6 = Performance over the last 6 months
P9 = Performance over the last 9 months
P12 = Performance over the last 12 months
There is no equivalent solution for the moment on TradingView.
The rating score will only appear on the daily timeframe.
For now it's my pleasure to share!
Daily Scalping Moving AveragesThis is a technical analysis study based on the most fit leading indicators for short timeframes like EMA and SMA.
At the same time we have daily channel made from the last 2 weeks of ATR values, which will give us the daily top and bottom expected values(with 80%+ confidence)
We have 3 groups of lengths for short length, medium length and a bigger length.
At the same time we combine it with the daily vwap values .
In the end we are going to have a total of 7 indicators telling us the direction.
The way we can use it :
The max ratings that we can have are +7 for long and -7 for short
In general once we have at least 5 indicators(fast and medium ones) giving us a direction, there is a high chance that we can scalp that trend and then we can exit either when we will be at +7 or close to neutral point
At the same time is very important to be aware of the current position inside of the TOP/BOTTOM channel that we have.
For example lets assume we are at 40k on BTC and our top channel is around 41-42k while the bottom is around 38k. In this case the margin that we have for long is much smaller than for short, so we should be prepared to exit once we reach the top values and from there wait and see if there is a huge continuation or a reversal. If the top channel was hit and the market started the rebounce going downwards and the moving averages confirms it, then we have a huge advantage using the top points as a STOP LOSS and continue the short movements, giving us an amazing risk/reward ratio .
If you have any questions let me know !

KINSKI Multi Trend OscillatorThe Multi Trend Oscillator is a tool that combines the ratings of several indicators to facilitate the search for profitable trades. I was inspired by the excellent indicator "Technical Ratings" from Team TradingView to create an alternative with a technically new approach. Therefore, it is not a modified copy of the original, but newly conceived and implemented.
The recommendations of the indicator are based on the calculated ratings from the different indicators included in it. The special thing here is that all settings for the individual indicators can be changed according to your own needs and displayed as a histogram and MA line. This provides an excellent visual control of your own settings. Alarms are also triggered.
Criteria for determining the rating
Relative Strength Index (RSI)
Buy - Crossover oversold level and indicator < oversold level and rising
Sell - Crossunder oversold level and indicator >= oversold level and falling
Neutral - neither Buy nor Sell
Relative Strength Index (RSI) Laguerre
Buy - Crossover Oversold Level and Indicator < Oversold Level and rising
Sell - Crossunder oversold level and indicator >= oversold level and falling
Neutral - neither Buy nor Sell
Noise free Relative Strength Index (RSX)
Buy - Crossover Oversold Level and Indicator < Oversold Level and rising
Sell - Crossunder oversold level and indicator >= oversold level and falling
Neutral - neither Buy nor Sell
Money Flow Index (MFI)
Buy - Crossover Oversold Level and Indicator < Oversold Level and rising
Sell - Crossunder oversold level and indicator >= oversold level and falling
Neutral - neither Buy nor Sell
Commodity Channel Index (CCI)
Buy - Crossover Oversold Level and Indicator < Oversold Level and rising
Sell - Crossunder oversold level and indicator >= oversold level and falling
Neutral - neither Buy nor Sell
Moving Average Convergence/Divergence (MACD)
Buy - values of the main line > values of the signal line and rising
Sell - values of the main line < values of the signal line and falling
Neutral - neither Buy nor Sell
Klinger
Buy - indicator >= 0 and rising
Sell - indicator < 0 and falling
Neutral - neither Buy nor Sell
Average Directional Index (ADX)
Buy - indicator > 20 and +DI line crosses over the -DI line and rising
Sell - indicator > 20 and +DI line crosses below the -DI line and falling
Neutral - neither Buy nor Sell
Awesome Oscillator
Buy - Crossover 0 and values are greater than 0, or exceed the zero line
Sell - Crossunder 0 and values are lower than 0, or fall below the zero line
Neutral - neither Buy nor Sell
Ultimate Oscillator
Buy - Crossover oversold level and indicator < oversold level and rising
Sell - Crossunder oversold level and indicator >= oversold level and falling
Neutral - neither Buy nor Sell
Williams Percent Range
Buy - Crossover Oversold Level and Indicator < Oversold Level and rising
Sell - Crossunder Oversold Level and Indicator >= Oversold Level and falling
Neutral - neither Buy nor Sell
Momentum
Buy - Crossover 0 and indicator levels rising
Sell - Crossunder 0 and indicator values falling
Neutral - neither Buy nor Sell
Total Ratings
The numerical value of the rating "Sell" is 0, "Neutral" is 0 and "Buy" is 1. The total rating is calculated as the average of the ratings of the individual indicators and are determined according to the following criteria:
MaxCount = 12 (depending on whether other oscillators are added).
CompareSellStrong = MaxCount * 0.3
CompareMid = MaxCount * 0.5
CompareBuyStrong = MaxCount * 0.7
value <= CompareSellStrong - Strong Sell
value < CompareMid and value > CompareSellStrong - Sell
value == 6 - Neutral
value > CompareMid and value < CompareBuyStrong - Buy
value >= CompareBuyStrong - Strong Buy
Understanding the results
The Multi Trend Oscillator is designed so that its values fluctuate between 0 and currently 12 (maximum number of integrated indicators). Its values are displayed as a histogram with green, red and gray bars. The bars are gray when the value of the indicator is at half of the number of indicators used, currently 12. Increasingly saturated green bars indicate increasing values above 6, and increasingly saturated red bars indicate increasingly decreasing values below 6.
The table at the end of the histogram shows details (can be activated in the settings) about the overall rating and the individual indicators. Its color is determined by the rating value: gray for neutral, green for buy or strong buy, red for sell or strong sell.
The following alarms are triggered:
Multi Trend Oscillator: Sell
Multi Trend Oscillator: Strong Sell
Multi Trend Oscillator: Buy
Multi Trend Oscillator: Strong Buy

Trend System Multiple Moving Averages RatingThis is a trend system made with multiple moving averages designed especially for trending markets such as stocks or crypto.
It can be used with any timeframe.
Its made of multiple moving averages such as
Simple
Weighted
Volume Weighted
Exponential
Double EMA
Arnaud Legoux
Hull MA
Smoothed
Least Squares
Kaufman Adaptive
Triple EMA
Zero Lag
Fractal Adaptive
Variable Index Dynamic Average
Jurik Moving Average
Tillson
Triangular
Avg of all moving averages
It has also a rating, making an avg from all of the moving averages , going from -100 (all ma's are telling to go short ) to 100 ( all ma are telling to go long).
If you have any questions let me know !

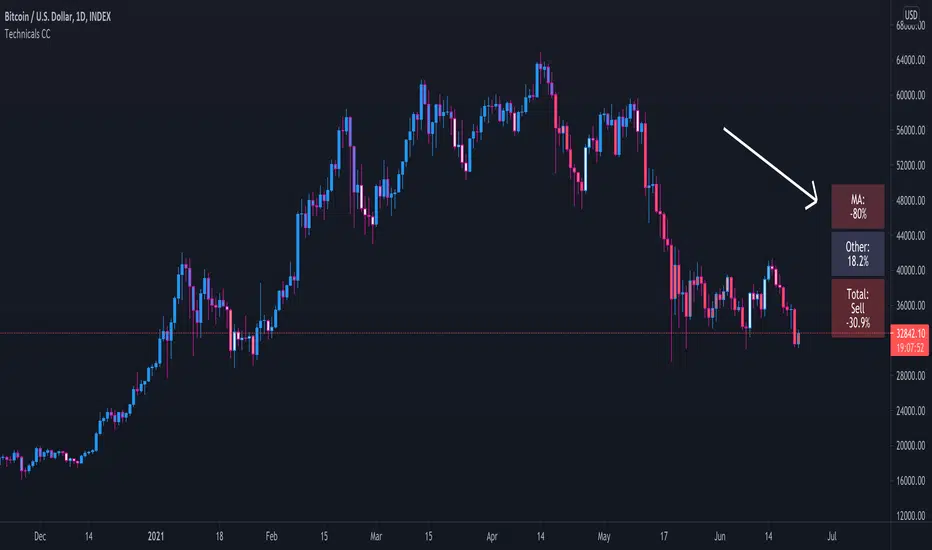
Technical Ratings Colored CandlesFor those that want technical ratings but don't want waste valuable screen real estate. Candles are colored to the rating strength. It also plots the results for "total", "MA" and "other" in a table on right of screen. Table and candle coloring can be turned off in style settings. This script uses the built in Technical Ratings indicator. For more informations on Technical Ratings please refer to official documentation.