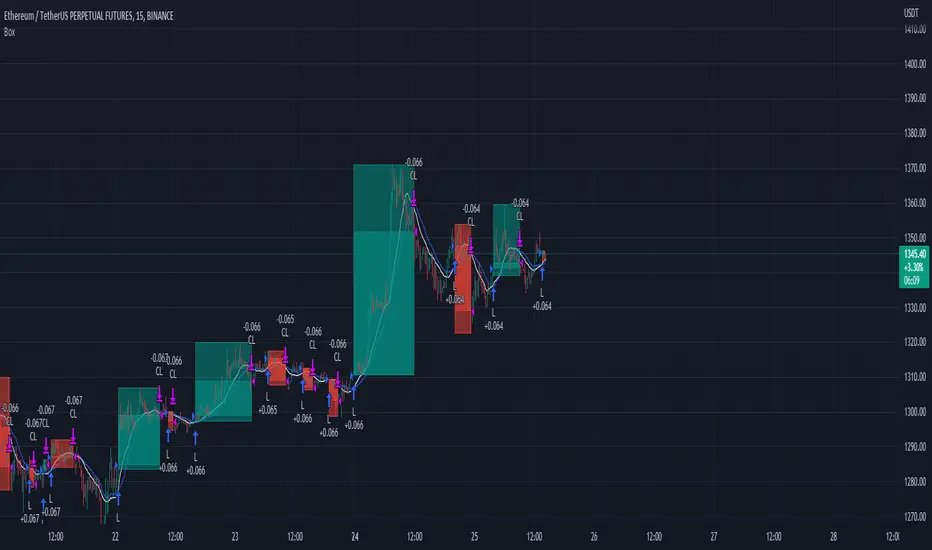
Trading range display with BoxThis script is just for reference to see the trading range.
Do not use this strategy logic, it is just Test strategy.
The trading range is colored depending on whether it is profitable or not.
You can change the color if you want.
When you declare the strategy, put (process_orders_on_close=true,calc_on_every_tick=true, max_boxes_count=500) in your script.
Then it can show you current open trading as well.
If you use switching strategy (e.g longposition to shortposition right away), it may not show you the range properly.
In that case, reduse the test period.
IT IS Repainting Reference.
If you want to see your strategy result visually,
Just copy and paste from line 22 in my script.
Good Luck everyone.
전략 거래 기간 동안을 보여주는 지표입니다.
이 지표에 쓰인 전략은 단순 테스트용 입니다. 절대 사용하지 마세요.
각 거래기간은 수익이냐 아니냐에 따라 색깔이 정해 집니다.
색깔은 여러분이 변경하실 수 있습니다.
전략을 선언부에 process_orders_on_close=true,calc_on_every_tick=true, max_boxes_count=500 을 넣으시면 현재 오픈 거래도 보실 수 있습니다.
스위칭 전략(롱에서 숏으로 바로 전환하는 전략)을 쓰시는 분들은 아마 테스트 기간을 줄이라는 경고를 받으실 수 있습니다.
이 지표는 리페이팅이 될 수 있습니다.
전략 결과를 눈으로 보고 싶으신 분들은 22번째 줄 부터 카피하시면 됩니다.
행운이 있길..
---strategy set---
default_qty_value=10
commission_value=0.04
slippage=2
Range
ATR - Average True Range + Dynamic Trend w/ Signals | by Octopu$↕ ATR - Average True Range + Dynamic Trend w/ Signals | by Octopu$
What is ATR?
ATR stands for Average True Range
A Technical Analysis Indicator that measures market volatility by decomposing the range of a Security Price in a specific period.
The ATR can be used as a High Low Spectrum,
As well as a variation of a Moving Average, considering the ranges on a timeframe, generally this being 14 days.
Shorter periods can be used (will generate more signals) or longer periods for steadier trends (for fewer signals)
A ticker on a high volatility has a high ATR.
A ticker on a low volatility has a low ATR.
It is an useful resource for a trading system:
Can be used to enter or exit trades and/or also measure the daily spectrum of a stock.
Does not necessarily points price direction, but takes into account gaps and strong legs.
Can also be used as trading positions confirmation,
Rather be it for stop losses or take profits,
As well as setting trailing stops or limit orders.
This tool offers a great Risk to Reward Ratio, considering the fact you will be aware of the possible moves that an asset can perform.
This indicator should not be used as a standalone tool.
(The combination of factors relies on your own knowledge about Confluence Factors along with your Due Diligence)
This indicator is not an advice to buy or sell securities.
www.tradingview.com
SPY
ANY Ticker. ANY Timeframe.
(Used SPY 5m as Example only)
Features:
• ATR ( Average True Range )
• Range UP and DOWN
• Movement from Price Line
• Dynamic ATR
• Cross/Test Signals
• Live and Last Close
Options:
• Specific Factors Setup
• Length Customization
• Toggle On/Off
• Color PIcker
• Styling Options
Notes:
v1.0
Indicator release.
Changes and updates can come in the future for additional functionalities or per requests. Follow and Stay Tuned!
Did you like it? Please Support and Shoot me a message! I'd appreciate if you dropped by to say thanks! Thank you.
- Octopu$
🐙

Keltner Channel Volatility FilterOVERVIEW
The Keltner Channel Volatility Filter indicator is a technical indicator that gauges the amount of volatility currently present in the market. The purpose of this indicator is to filter out with-trend signals during ranging/non-trending/consolidating conditions.
CONCEPTS
This indicator assists traders in capitalizing on the assumption that trends are more likely to start during periods of high volatility compared to periods of low volatility . This is because high volatility indicates that there are bigger players currently in the market, which is necessary to begin a sustained trending move.
So, to determine whether the current volatility in the market is low, the KCVF will grey out all bars whose average price is within the Keltner Channels.
If the average price breaks out of the Keltner Channels , it is reasonable to assume we are in a high-volatility period. Thus, this is the ideal time to enter a trending trade due to the assumption that trends are more likely to start during these high-volatility periods.
HOW DO I READ THIS INDICATOR
When the candles are greyed out, don't take any trend trades since the current volatility is less than the usual volatility experienced in the market.
When the candles aren't greyed out, take all valid with-trend trades since the current volatility is greater than the usual volatility experienced in the market.

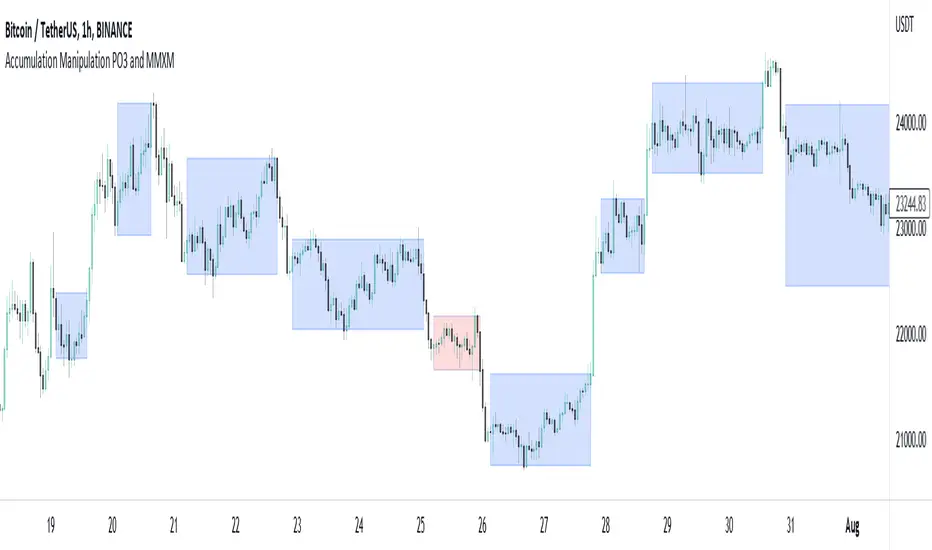
Accumulation Manipulation PO3 and MMXMMuch is said about the market maker or manipulation of price, but there aren't many indicators that try to show this, until now.
Using an easily customisable, but intelligent algorithm, this indicator tries to find and highlight when price is 'ranging', or 'accumulating'. It does this by looking at changes in price and quantifying the strength of the change, based on current and historical changes, and can therfore decide if price is staying in range or breaking out. By showing this on the chart several approaches can be taken.
Simply, you can trade within the range, and also trade breakouts of the range, knowing that price will react at these range 'levels'.
Alternatively, you can use the accumulation boxes to try and identify MMXM models, that is Market Maker Buy and Market Maker Sell Models, where price moves in phases of consolidation, smart money reversal and re-accumulation.
Finally, using the manipulation detection option, you can try to identify when a sudden change in price is actually manipulation by institutions, and plan to trade the distribution phase accordingly. This accumulation, manipulation, distribution is also known as Power of 3, PO3.
This indicator does not try to teach any of these ideas, only help to visualise them on the chart, and as such should not be considered financial advice.
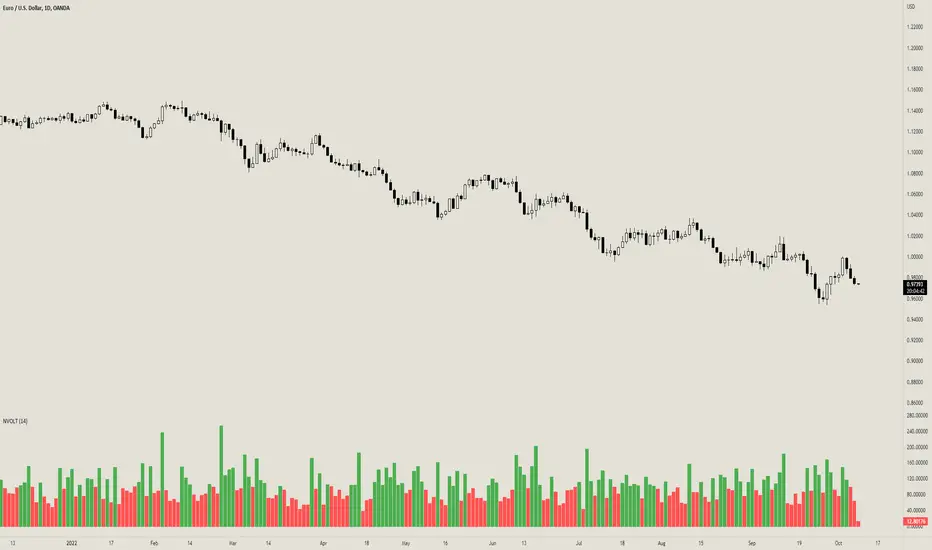
Normalized VolatilityOVERVIEW
The Normalized Volatility indicator is a technical indicator that gauges the amount of volatility currently present in the market, relative to the average volatility in the market. The purpose of this indicator is to filter out with-trend signals during ranging/non-trending/consolidating conditions.
CONCEPTS
This indicator assists traders in capitalizing on the assumption that trends are more likely to start during periods of high volatility compared to periods of low volatility. This is because high volatility indicates that there are bigger players currently in the market, which is necessary to begin a sustained trending move.
So, to determine whether the current volatility is "high", it is compared to an average volatility for however number of candles back the user specifies.
If the current volatility is greater than the average volatility, it is reasonable to assume we are in a high-volatility period. Thus, this is the ideal time to enter a trending trade due to the assumption that trends are more likely to start during these high-volatility periods.
HOW DO I READ THIS INDICATOR
When the column's color is red, don't take any trend trades since the current volatility is less than the average volatility experienced in the market.
When the column's color is green, take all valid with-trend trades since the current volatility is greater than the average volatility experienced in the market.
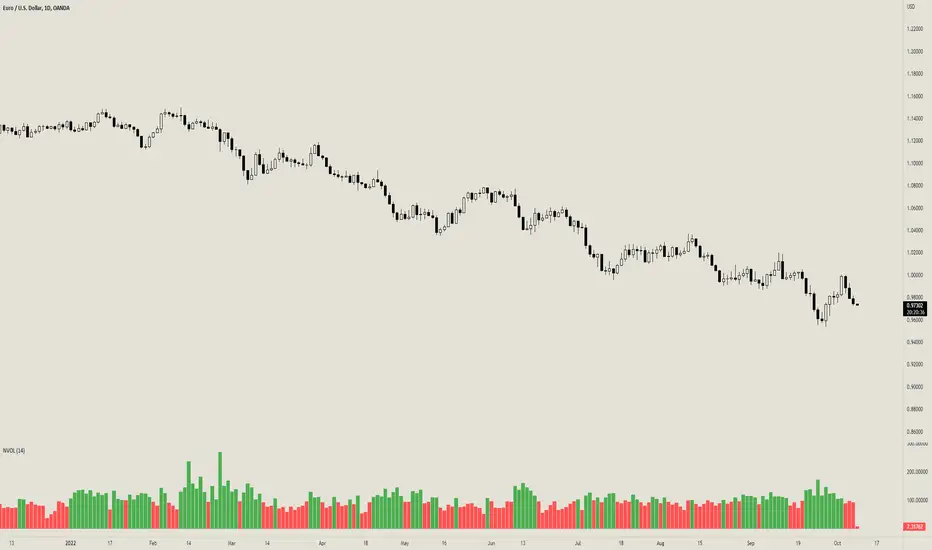
Normalized VolumeOVERVIEW
The Normalized Volume indicator is a technical indicator that gauges the amount of volume currently present in the market, relative to the average volume in the market. The purpose of this indicator is to filter out with-trend signals during ranging/non-trending/consolidating conditions.
CONCEPTS
This indicator assists traders in capitalizing on the assumption that trends are more likely to start during periods of high volume compared to periods of low volume. This is because high volume indicates that there are bigger players currently in the market, which is necessary to begin a sustained trending move.
So, to determine whether the current volume is "high", it is compared to an average volume for however number of candles back the user specifies.
If the current volume is greater than the average volume, it is reasonable to assume we are in a high-volume period. Thus, this is the ideal time to enter a trending trade due to the assumption that trends are more likely to start during these high-volume periods.
More information on this indicator can be found on NNFX's video on it in his Indicator Profile series and on Stonehill Forex's blog post on it .
HOW DO I READ THIS INDICATOR
When the column's color is red, don't take any trend trades since the current volume is less than the average volume experienced in the market.
When the column's color is green, take all valid with-trend trades since the current volume is greater than the average volume experienced in the market.
Michigandolf's 30min Opening Range (w/Extensions)See previous version for explanation of the 30min Opening Range:
This new version is for users that prefer to see the Opening Range Extensions.
The extensions are based on the distance from the Opening Range High to the Mid Point (or Low to the Mid Point).

Quick and Simple - WPR+RSI+CCITake a look.
Couple of confluencial reversal signals from popular indicators (W%R, RSI & CCI). I can only say this shows how random the "stanard tools" are and how the market makers "play" these kind of tools to their advantage.
That said. It's better tha average, but not top-class, so expect to have to take signals with other confluence. DON'T take the plots or signals as buy / sell signals, they are just confluencial movements from these indicators based on how they should be "traditionally" used. Instead, use it as a guide as to what other traders may be thinking, or as a pull-back identifier.
Included 100 period ema as basic trend filter.
Not my normal type of script + been away for some time so be kind, lol :)
You might find it useful however so sharing.
More stuff to follow :)

Buying & Selling PressureBuying and selling pressure is a volatility indicator which denotes the balance between buyers and sellers inside candlestick.
You set the length to average it just like ATR. But This offers further break down of participants of the market.
Pretty much at any condition of the market the indicator can filter out interesting details to make trading decisions faster or confirm them.
So keep it simple we have two lines
🟢 Green → buying pressure
🔴 Red → selling pressure
If green is rising → Price most likely will grow
If green is rising and red is falling → Price will grow at higher probability
If red is rising → Price most likely will fall
If red is rising and green is falling → Price will fall at higher probability
When they both grow or fall → wait till one of them goes opposite way.
╳ Crossings can indicate turning points for bigger price swings.
Technically by very act of intersecting means that Buying and Selling Pressure are equal.
Can be used for Demand/Supply analysis and evaluate the support/resistance levels.

RF+ Divergence Scalping SystemRF+ Divergence Scalping System + Custom Signals + Alerts.
This chart overlay indicator has been developed for the low timeframe divergence scalper.
Built upon the realtime divergence drawing code from the Divergence for Many indicator originally authored by Lonsometheblue, this chart overlay indicator bundles several additional unique features and modifications to serve as an all-in-one divergence scalping system. The current key features at the time of publishing are listed below (features are optional and can be enabled or disabled):
- Fully configurable realtime divergence drawing and alerting feature that can draw divergences directly on the chart using data sourced from up to 11 oscillators selected by the user, which have been included specifically for their ability to detect divergences, including oscillators not presently included in the original Divergence for Many indicator, such as the Ultimate Oscillator and TSI.
- Optional on chart table showing a summary of key statuses of various indicators, and nearby divergences.
- 2 x Range Filters with custom settings used for low timeframe trend detection.
- 3 x configurable multi-timeframe Stochastic RSI overbought and oversold signals with presentation options.
- On-chart pivot points drawn automatically.
- Automatically adjusted pivot period for up to 4 configurable time frames to fine tune divergences drawn for optimal divergence detection.
- Real-price line for use with Heikin Ashi candles, with styling options.
- Real-price close dots for use with Heikin Ashi candles, with styling options.
- A selection of custom signals that can be printed on-chart and alerted.
- Sessions indicator for the London, New York, Tokyo and Sydney trading sessions, including daylight savings toggle, and unique ‘invert background color’ option, which colours the entire chart - except the trading session you have selected, leaving your chart clear of distracting background color.
- Up to 4 fully configurable moving averages.
- Additional configurable settings for numerous built in indicators, allowing you to alter the lengths and source types, including the UO, TSI, MFI, TSV, 2 x Range Filters.
- Configurable RSI Trend detection signal filter used in a number of the signals, which filters buy signals where the RSI is over the RSI moving average, and only prints sell signals where RSI is under the moving average.
- Customisable on-chart watermark, with inputs for a custom title, subtitle, and also an optional symbol | timeframe | date feature.
The Oscillators able to be selected for use in drawing divergences at the time of publishing are as follows:
- Ultimate Oscillator (UO)
- True Strength Indicator (TSI)
- Money Flow Index (MFI)
- Cumulative Delta Volume (CDV)
- Time Segmented Volume (TSV)
- Commodity Channel Index (CCI)
- Awesome Oscillator
- Relative Strength Index (RSI)
- Stochastic
- On Balance Volume (OBV)
- MACD Histogram
What are divergences?
Divergence is when the price of an asset is moving in the opposite direction of a technical indicator, such as an oscillator, or is moving contrary to other data. Divergence warns that the current price trend may be weakening, and in some cases may lead to the price changing direction.
There are 4 main types of divergence, which are split into 2 categories;
regular divergences and hidden divergences. Regular divergences indicate possible trend reversals, and hidden divergences indicate possible trend continuation.
Regular bullish divergence: An indication of a potential trend reversal, from the current downtrend, to an uptrend.
Regular bearish divergence: An indication of a potential trend reversal, from the current uptrend, to a downtrend.
Hidden bullish divergence: An indication of a potential uptrend continuation.
Hidden bearish divergence: An indication of a potential downtrend continuation.
Setting alerts.
With this indicator you can set alerts to notify you when any/all of the above types of divergences occur, on any chart timeframe you choose, also when the triple timeframe Stochastic RSI overbought and oversold confluences occur, as well as when custom signals are printed.
Configurable pivot period values.
You can adjust the default pivot period values to suit your prefered trading style and timeframe. If you like to trade a shorter time frame, lowering the default lookback values will make the divergences drawn more sensitive to short term price action. By default, this indicator has enabled the automatic adjustment of the pivot periods for 4 configurable time frames, in a bid to optimize the divergences drawn when the indicator is loaded onto any of the 4 time frames selected. These time frames and their associated pivot periods can be fully reconfigured within the settings menu. By default, these have been further optimized for the low timeframe scalper trading on the 1-15 minute time frames.
How do traders use divergences in their trading?
A divergence is considered a leading indicator in technical analysis , meaning it has the ability to indicate a potential price move in the short term future.
Hidden bullish and hidden bearish divergences, which indicate a potential continuation of the current trend are sometimes considered a good place for traders to begin, since trend continuation occurs more frequently than reversals, or trend changes.
When trading regular bullish divergences and regular bearish divergences, which are indications of a trend reversal, the probability of it doing so may increase when these occur at a strong support or resistance level . A common mistake new traders make is to get into a regular divergence trade too early, assuming it will immediately reverse, but these can continue to form for some time before the trend eventually changes, by using forms of support or resistance as an added confluence, such as when price reaches a moving average, the success rate when trading these patterns may increase.
Typically, traders will manually draw lines across the swing highs and swing lows of both the price chart and the oscillator to see whether they appear to present a divergence, this indicator will draw them for you, quickly and clearly, and can notify you when they occur.
How do traders use overbought and oversold levels in their trading?
The oversold level is when the Stochastic RSI is above the 80 level is typically interpreted as being 'overbought', and below the 20 level is typically considered 'oversold'. Traders will often use the Stochastic RSI at, or crossing down from an overbought level as a confluence for entry into a short position, and the Stochastic RSI at, or crossing up from an oversold level as a confluence for an entry into a long position. These levels do not mean that price will necessarily reverse at those levels in a reliable way, however. This is why this version of the Stoch RSI employs the triple timeframe overbought and oversold confluence, in an attempt to add a more confluence and reliability to this usage of the Stoch RSI.
This indicator is intended for use in conjunction with related panel indicators including the TSI+ (True Strength Indicator + Realtime Divergences), UO+ (Ultimate Oscillator + Realtime Divergences), and optionally the STRSI+ (MTF Stochastic RSI + Realtime Divergences) and MFI+ (Money Flow Index + Realtime Divergences) available via this authors’ Tradingview profile, under the scripts section. The realtime divergence drawing code will not identify all divergences, so it is suggested that you also have panel indicators to observe. Each panel indicator also offers additional means of entry confirmation into divergence trades, for example, the Stochastic can indicate when it is crossing down from overbought or up from oversold, the TSi can indicate when the 2 TSI bands cross over one another upward or downward, and the UO and MFI can indicate an entry confluence when they are nearing, or crossing their centerlines, for more confidence in your divergence trade entries.
Additional information on the settings for this indicator can be found via the tooltips within the settings menu itself. Further information on feature updates, and usage tips & tricks will be added to the comments section below in due course.
Disclaimer: This indicator uses code adapted from the Divergence for Many v4 indicator authored by Lonesometheblue, and several stock indicators authored by Tradingview. With many thanks.

Range Detector Indicator [Misu]█ This indicator shows an upper and lower band based on Highs and Lows.
Depending on this, the indicator interprets a ranging market, an uptrend or a downtrend.
█ Usages:
The purpose of this indicator is to identify when the price is ranging.
It's also used to identify changes in trends, breaking points, and trend reversals.
But it can also be used to show resistance or support levels.
█ Features:
> Price Action Change Alerts
> Price Action Change Labels
> Color Bars
> Show Bands
█ Parameters:
Deviation: A parameter used to calculate pivots.
Depth: A parameter used to calculate pivots.
Activate Range Detection: Check the box to activate range detection.
Band% Offset: A factor that is used to vary the bands offset.

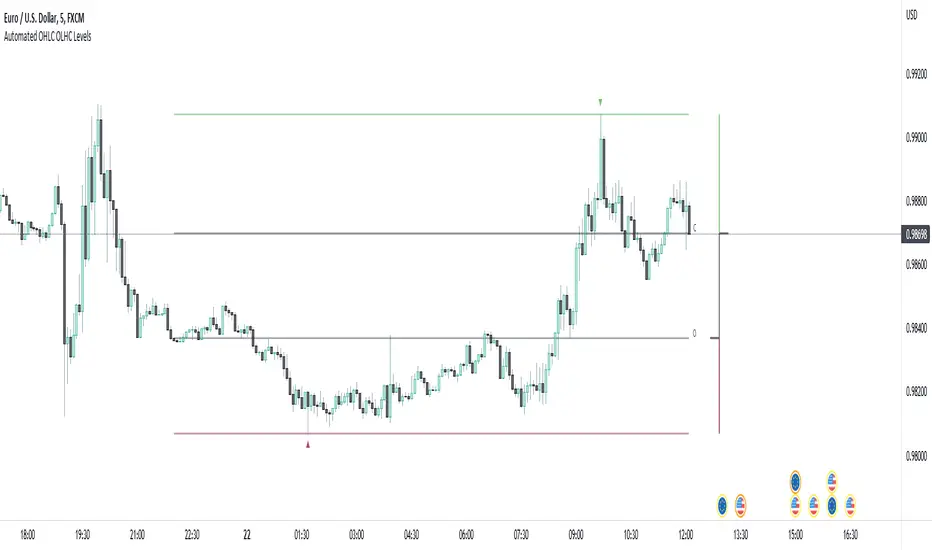
Automated OHLC OLHC LevelsA simple, clean, effective visualization tool, for the OHLC or OLHC of a chosen candle/timeframe.
Apply this indicator using a higher timeframe, in conjunction with other levels and the directional bias, to easily recognize trading opportunities at lower timeframes.
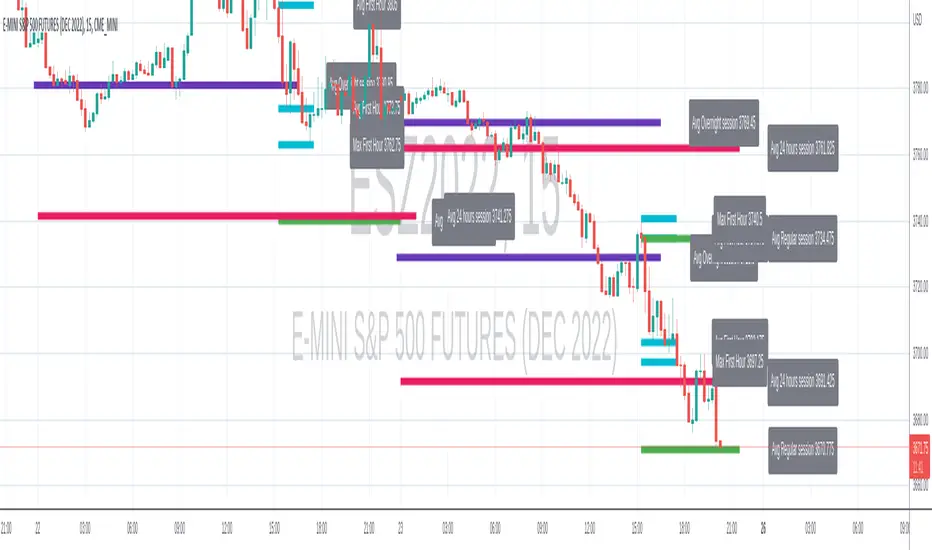
Range-AnalysisMarkets usually tend to stay within a range during a specific time frame (for example first hour of the regular trading session, the whole regular trading session). For traders before initiating a trade it can be helpful to determine the range potential left for the targeted time frame. So they can decide to either try to ride the current trend further or fade the current trend in the case there is no range potential left for the specific time frame. This could be especially helpful for example in the E-Mini S&P future during the first hour.
The script calculates the average range for the last x days of the session defined and plots a line at the expected range extremes based on that average (for example: RangeExtremeHigh would be currentSessionLow+average Range of the last x days.
Any feedback is appreciated.
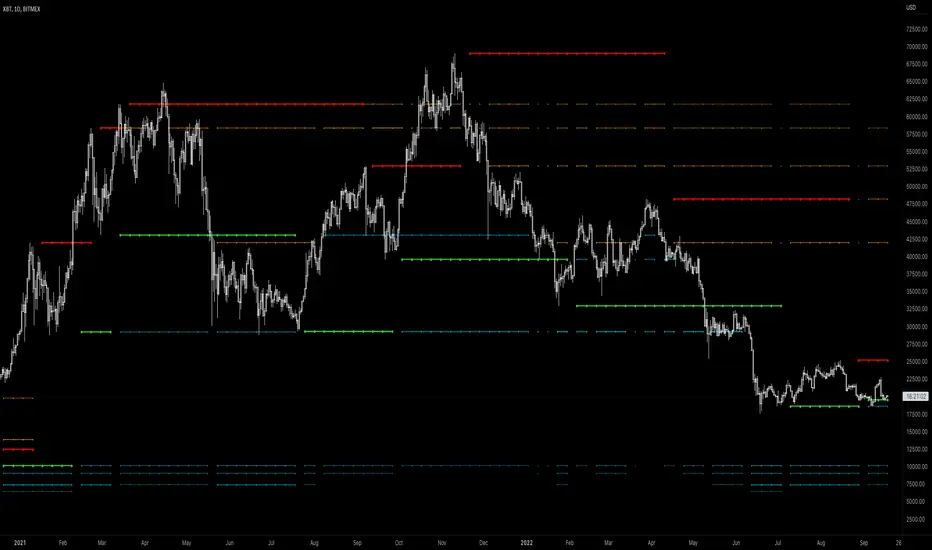
Ywaves S/RYwaves identifies areas of extreme volatility that are out of the ordinary and highlights them for the trader. These areas are de facto areas of great interest for the market and therefore areas to monitor and work on. Thanks to a smoothing formula, it eliminates false positives that are sometimes too frequent and inconsistent.
This script uniquness reside in the formula used to determine the supports and resistances, by using multiple volatility tools, it is able to eliminate false positives and only keep interesting S/R.
The blue and orange S/Rs (secondary S/Rs) are echoes of the green/red S/Rs (main S/Rs) that are close (to the current price) to the past. There are a maximum of 5 levels of secondary S/R on either side of the price. The intensity of the color and the strength of the line also gives information about the proximity and importance of the S/R. When the blue/orange dots are connected, it means that it is the same S/R from the past that continues to be at the same level.
It is possible to use Ywaves in several ways: by using the main S/R, secondary S/R or clusters formed by the different S/R. Of course, the trader is free to work on other ways of using them. Thanks to the different settings, the trader can quickly display the supports and resistances close (in terms of price) to the past. The objective is once again to simplify the trader's life on a daily basis.
Intraday Range CalculatorThis indicator shows an easy way to determine if the stock, index or ETF ended within a configurable intraday range.
This solution is ideal for those who study and like Iron Condors or Iron Butterflies strategies.
Results:
If the square is red, it means that the selected deviation limits have been exceeded within the chosen times.
If the square is green, the price stayed within the pre-set limits.
A yellow circle marks the moment when the price leaves the range, either by the upper band or by the lower band.
In the last bar a label with the test results will be displayed.
Settings:
In the configuration there are three fields:
1. Deviation : is the range in percentage that the price can move up or down from the start time to the end time.
2. Begin Time: is the time (in 24h or military format) where the process begins.
3. End Time: is the time (in 24h or military format) where the process ends.
Example:
* for the time 11:00 am, you must enter "1100"
* for the time 2:45pm, you must enter "1445"
Important:
The selected timeframe must be less than 1 hour and Extended Trading Hours in the lower left corner), otherwise the indicator may not show results.
Later I will make an improvement to solve these inconveniences.

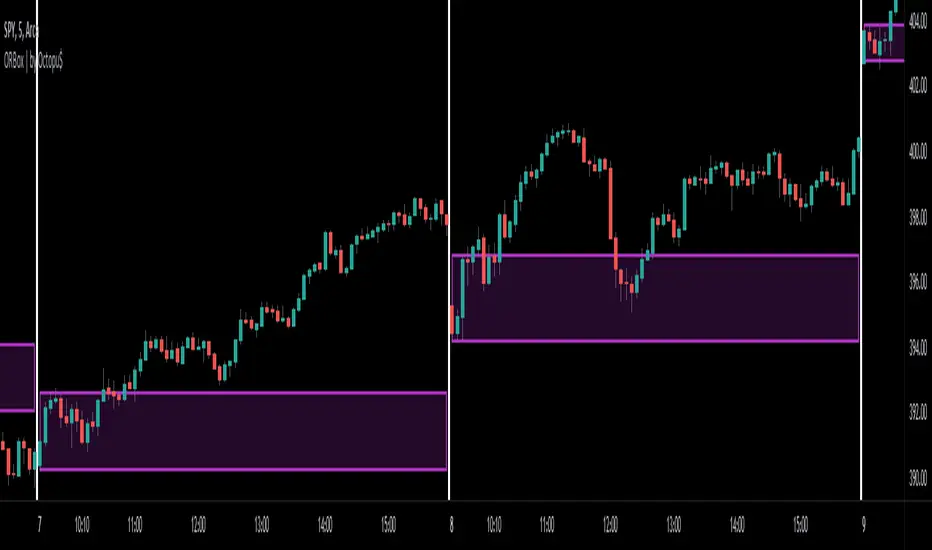
ORBox | by Octopu$📈 ORBox | by Octopu$
ORBox is a Box for the Opening Range Breakout
The Box is added automatically according to the User preferences through GUI
This Indicator includes a Dropdown selection for which Range for the Breakout you want to use
ORBox has built-in Alerts for when the Breakout happens according to your preferences
Works in any Timeframe with any Ticker
(Using SPY 5m just as an example:)
www.tradingview.com
SPY
Features:
• Opening Breakout Range (ORB)
• Dropdown menu selection to choose which TF to watch
• Built-in Alerts for Momentum Awareness
Options:
• Customization for Box Colors and Sizes
• Display ORB for Current Day or Previous
Notes:
v1.0
ORBox Indicator release
Changes and updates can come in the future for additional functionalities or per requests.
Did you like it? Shoot me a message! I'd appreciate if you dropped by to say thanks.
- Octopu$
🐙
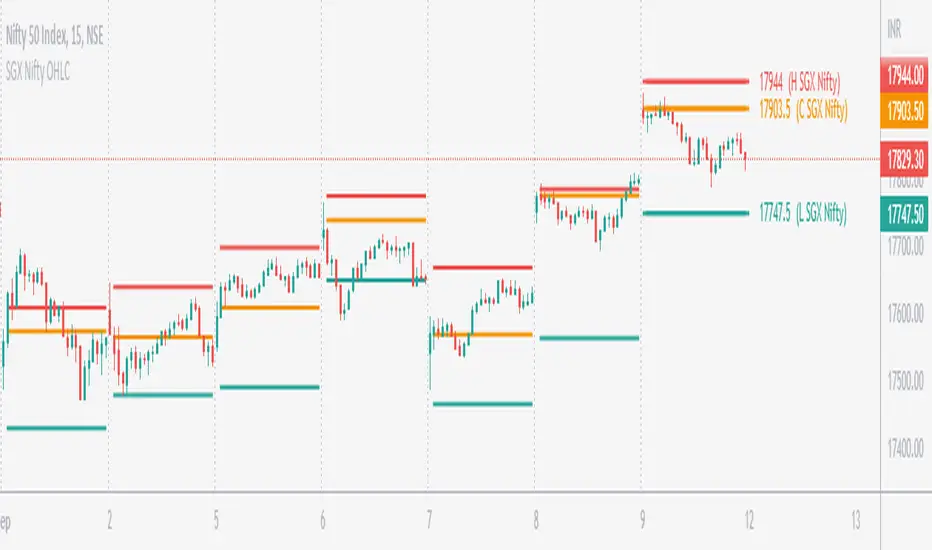
SGX Nifty OHLC for Nifty 50 IndexSGX Nifty OHLC for Nifty 50 Index
What is this Indicator?
• This indicator calculates the OHLC levels of SGX Nifty.
How does SGX Nifty impact NIFTY and the Indian Market?
• Helps in predicting NIFTY50 Index behavior.
• The closing price of today's 9.14 am (IST) SGX Nifty will be the Open of today's Nifty50 Open. This helps to determine the opening Gap of Nifty50.
• SGX Nifty OHLC levels can act as support and resistance in Nifty50.
Who to use?
• Beneficial for Day Traders, who trade in NIFTY Index.
What timeframe to use?
• Use 1 minute for better accuracy.
• Other timeframes will also work.
Important Note
• Use 1 min timeframe for accurate OHLC.
• In other timeframes OHLC will have negligible difference, it won't be huge.
• This indicator will appear only on NIFTY Index and Futures chart.
• To hide the warning label go to the indicator Menu.
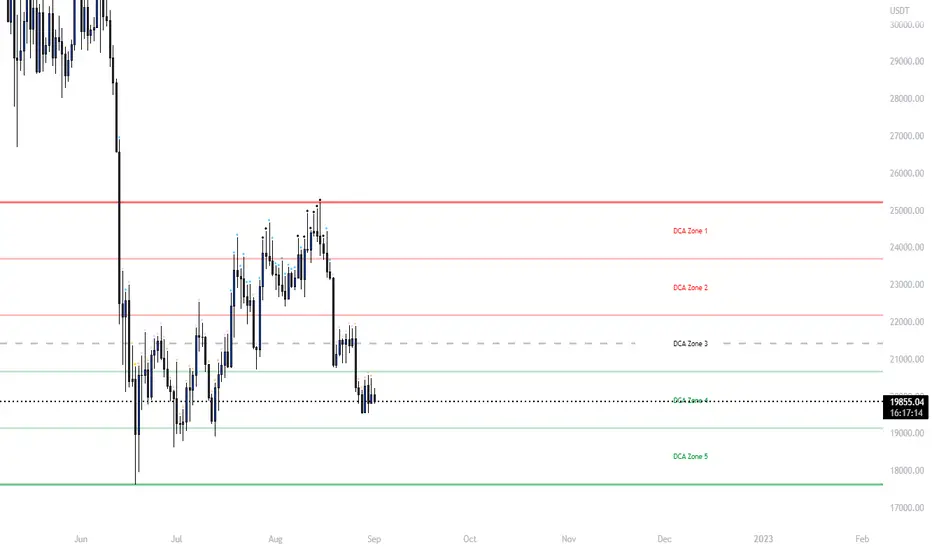
Ultimate Grid Tool + Alerts (DCA & Limit Orders) [enzedengineer]Overview
The "Ultimate Grid Tool + Alerts" script works much like a grid bot from automated trading services such as 3Commas making it a good free alternative with some extra utility.
How it works
The user is prompted to set up a grid by manually defining a lower and upper range and then by selecting how many grid segments they want (max 20). The script will automatically create equally spaced grids within this defined range. The script has built in alerts which are intended to be used in conjunction with a third-party application to execute buy and sell orders on an exchange.
The script has two alert functionalities to choose between:
Limit orders (like traditional grid bots) or;
DCA zones (time-based)
DCA zones:
This is the default selection. Each zone has its own alert condition which is triggered if the price closes within that zone. The frequency of the alert is determined by the user's chart resolution, therefore you can have the alert trigger every day, or 4 hours, or 30 minutes and so on. This allows for flexibility, for example, you could go from DCA'ing at $20 per day at higher prices to $100 per day as the price drops into the lower end of your grid range.
Limit orders:
This mode is selected by checking the "Limit Order" box. As mentioned earlier, this mode works like traditional grid bots with each grid line representing a limit order. The alert condition is met when ta.cross(close, gridline) = true.
Buy and Sell:
This mode is selected by checking the "Buy and Sell" box. This is a visual modification only which changes the colour of the grids to help plan the user's trading. Please note, there is no buying or selling logic within the script itself - this should be built into the alert message to be used with a third-party application for exchange order execution.
Use case: The author of this script has been using it with the default settings to DCA into Bitcoin in the current bear market. Using a chart resolution of 15 minutes the script purchases x-amount of Bitcoin every 15 minutes (Alertatron executes the exchange orders). This method provides a well blended average price and takes away the internal conundrum of "should I buy some today". No matter what, the bot will make a purchase within at least 15 minutes of the ultimate Bitcoin bottom and arguably this gives a psychological edge and reduces FOMO (fear of missing out).
Previous Days RangesPrevious Days Ranges
Simply plots out market ranges of previous days price action, of which are the following:
Previous Day High
Previous Day Low
Previous Day Extended High
Previous Day Extended Low
Supports adjustments of timeframes, for different time zones, and style.

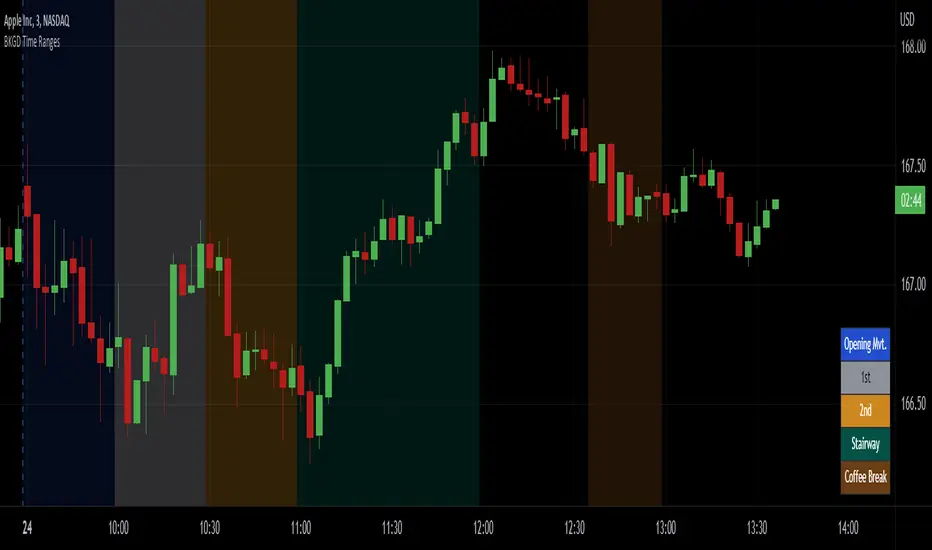
Intraday Background Time RangesThis simple script was written for studying recurring intraday behaviours of financial instruments. With it, you can highlight up to 13 customizable time ranges on your chart, filling the corresponding background space with colors you prefer. You can then write a note for each range and it will be shown in the optional related table.
The experience shows that every financial instrument has its own personality. With this in mind, the script can be useful to study intraday charts with the purpose of discovering recurring behaviours of specific instruments over a certain time range and under specific circumstances (normal days, earnings days, days with catalysts, etc.) This can help the trader to deeply understand the instrument personality, and therefore also to decide whether to enter or exit the market if its behaviour meets or not his expectations.
Please note that this script only works on minute/hourly charts.
Mondays Range by B1rdPlots mondays range (high, low and optionally average)
Features:
Added the option to extend the range for the entire week or just monday
Added the option to display if the high or low of the range has been taken and removes the level aftwards
Added the option to only display the current week
Added the option to visualize new weekly sessions
Added the option to mark mondays with a seperate background
Will update the script based on suggestions

EMA scalping - PapamallisEma of highs and low and macd.
Can be used as
*macd filter
*breakout
*range market filter

Daily/Weekly ExtremesBACKGROUND
This indicator calculates the daily and weekly +-1 standard deviation of the S&P 500 based on 2 methodologies:
1. VIX - Using the market's expectation of forward volatility, one can calculate the daily expectation by dividing the VIX by the square root of 252 (the number of trading days in a year) - also know as the "rule of 16." Similarly, dividing by the square root of 50 will give you the weekly expected range based on the VIX.
2. ATR - We also provide expected weekly and daily ranges based on 5 day/week ATR.
HOW TO USE
- This indicator only has 1 option in the settings: choosing the ATR (default) or the VIX to plot the +-1 standard deviation range.
- This indicator WILL ONLY display these ranges if you are looking at the SPX or ES futures. The ranges will not be displayed if you are looking at any other symbols
- The boundaries displayed on the chart should not be used on their own as bounce/reject levels. They are simply to provide a frame of reference as to where price is trading with respect to the market's implied expectations. It can be used as an indicator to look for signs of reversals on the tape.
- Daily and Weekly extremes are plotted on all time frames (even on lower time frames).
