Ethereum Rainbow Chart (9 Levels with Legend)The Ethereum Rainbow Chart is a long-term, color-coded chart that displays Ethereum’s price on a logarithmic scale to show historical trends and growth patterns. It uses colored bands to highlight different price zones, helping to visualize how ETH’s price has moved over time without focusing on short-term fluctuations.
Rainbow

the rainbow unicornScript Name: The Rainbow Unicorn
Description:
The Rainbow Unicorn is a unique visual indicator designed to add a touch of color and fun to your trading charts. This indicator colors the bars, wicks, and borders using rainbow colors, making technical analysis more enjoyable and visually appealing.
Features:
Rainbow Colors: Bars, wicks, and borders are colored in red, orange, yellow, green, blue, and purple, creating a dynamic rainbow effect.
Customization: Colors are applied cyclically, offering a continuous and smooth visualization of market data.
Ease of Use: No complex configuration is required. Simply add the indicator to your chart to see the rainbow colors in action.
How It Works:
The indicator uses a function to generate rainbow colors and applies them to the bars on the chart based on their index. The colors are defined in an array and are applied cyclically, meaning each bar receives a different rainbow color.
Usage:
Add the "The Rainbow Unicorn" indicator to your chart.
Observe the rainbow-colored bars for a more visual and fun trading experience.
Use this indicator in conjunction with your other technical analysis tools for better visualization of trends and price movements.
Underlying Concepts:
This indicator is primarily designed to enhance the visual experience of traders by adding vibrant and dynamic colors to the charts. It does not rely on complex calculations or trend detection methods but aims to make technical analysis more enjoyable and engaging.

Rainbow EMA Areas with Volatility HighlightThe indicator provides traders with an enhanced visual tool to observe price movements, trend strength, and market volatility on their charts. It combines multiple EMAs (Exponential Moving Averages) with color-coded areas to indicate the market’s directional bias and a high-volatility highlight for detecting times of increased market activity.
Explanation of Key Components
Multiple EMAs (Exponential Moving Averages):
Six different EMAs are calculated for various periods (15, 45, 100, 150, 200, 300).
Each EMA period represents a different timeframe, from short-term to long-term trends, providing a well-rounded view of price behavior across different market cycles.
The EMAs are color-coded for easy differentiation:
Green shades indicate bullish trends when prices are above the EMAs.
Red shades indicate bearish trends when prices are below the EMAs.
The space between each EMA is filled with a gradient color, creating a "wave" effect that helps identify the market’s overall direction.
ATR-Based Volatility Detection:
The ATR (Average True Range), a measure of market volatility, is used to assess how much the price is fluctuating. When volatility is high, price movements are typically more significant, indicating potential trading opportunities or times to exercise caution.
The indicator calculates ATR and uses a customizable multiplier to set a high-volatility threshold.
When the ATR exceeds this threshold, it signals that the market is experiencing high volatility.
Visual High Volatility Highlight:
A yellow background appears on the chart during periods of high volatility, giving a subtle but clear visual indication that the market is active.
This highlight helps traders spot potential breakout areas or increased activity zones without obstructing the EMA areas.
Volatility Signal Markers:
Small, red triangular markers are plotted above price bars when high volatility is detected, marking these areas for additional emphasis.
These signals serve as alerts to help traders quickly recognize high volatility moments where price moves may be stronger.
How to Use This Indicator
Identify Trends Using EMA Areas:
Bullish Trend: When the price is above most or all EMAs, and the EMA areas are colored in shades of green, it indicates a strong bullish trend. Traders might look for buy opportunities in this scenario.
Bearish Trend: When the price is below most or all EMAs, and the EMA areas are colored in shades of red, it signals a bearish trend. This condition can suggest potential sell opportunities.
Consolidation or Neutral Trend: If the price is moving within the EMA bands without a clear green or red dominance, the market may be in a consolidation phase. This period often precedes a breakout in either direction.
Volatility-Based Entries and Exits:
High Volatility Areas: The yellow background and red triangular markers signal high-volatility areas. This information can be valuable for identifying potential breakout points or strong moves.
Trading in High Volatility: During high-volatility phases, the market may experience rapid price changes, which can be ideal for breakout trades. However, high volatility also involves higher risk, so traders may adjust their strategies accordingly (e.g., setting wider stops or adjusting position sizes).
Trading in Low Volatility: When the yellow background and markers are absent, volatility is lower, indicating a calmer market. In these times, traders may choose to look for range-bound trading opportunities or wait for the next trend to develop.
Combining with Other Indicators:
This indicator works well in combination with momentum or oscillating indicators like RSI or MACD, providing a well-rounded view of the market.
For example, if the indicator shows a bullish EMA area with high volatility, and an RSI is trending up, it could be a stronger buy signal. Conversely, if the indicator shows a bearish EMA area with high volatility and RSI is trending down, this could be a stronger sell signal.
Practical Trading Examples
Bullish Trend in High Volatility:
Price is above the EMAs, showing green EMA areas, and the high volatility background is active.
This indicates a strong bullish trend with significant price movement potential.
A trader could look for breakout or continuation entries in the direction of the trend.
Bearish Reversal Signal:
Price crosses below the EMAs, showing red EMA areas, while high volatility is also detected.
This suggests that the market may be reversing to a bearish trend with increased price movement.
Traders could consider taking short positions or setting stops on existing long trades.
This indicator is designed to provide a rich visual experience, making it easy to spot trends, consolidations, and volatility zones at a glance. It is best used by traders who benefit from visual cues and who seek a quick understanding of both trend direction and market activity. Let me know if you'd like further customization or additional functionalities!

Gradient Candles
The Gradient Candles indicator is crafted to be a comprehensive replacement for default candlesticks, offering users an enhanced and visually stunning alternative. To experience the intended results and fully immerse in the distinctive features of Gradient Candles, it's recommended to hide the default candlesticks. This ensures that traders can fully appreciate the unique color gradient and dynamic visual representation that this indicator brings to chart analysis.
Designed to elevate chart analysis, Gradient Candles not only offer a fresh perspective on price movements but also captivate users with their visually appealing representation of market dynamics. Departing from traditional candlestick coloration, the dynamic adaptation of colors, the 'color.from_gradient()' function plays a pivotal role in translating the current source value into a color that reflects its proximity to the highest and lowest values and corresponding colors. Beyond its analytical capabilities, Gradient Candles transform market analysis into an aesthetically enriching experience, providing traders with a unique and comprehensive tool for their technical analysis toolkit.
Traders can tailor the indicator's appearance to suit their preferences and seamlessly integrate it into their personal trading environment. From color inversion to transparency adjustments and the option to fill candles instead of outlining them, the customization features empower users to create a visual representation that aligns precisely with their unique preferences.

Rainbow Fibonacci Momentum - SuperTrend🌈 "Rainbow Fibonacci Momentum - SuperTrend" Indicator 🌈
IMPORTANT: as this is a complex and elaborate TREND ANALYSIS on the graph, ALL INDICATORS REPAINT.
Experience the brilliance of "Rainbow Fibonacci Momentum - SuperTrend" for your technical analysis on TradingView! This versatile indicator allows you to visualize various types of Moving Averages, including Simple Moving Averages (SMA), Exponential Moving Averages (EMA), Weighted Moving Averages (WMA), Hull Moving Averages (HMA), and Volume Weighted Moving Averages (VWMA).
Each MA displayed in a unique color to create a stunning rainbow effect. This makes it easier for you to identify trends and potential trading opportunities.
Key Features:
📊 Multiple Moving Average Types - Choose from a range of moving average types to suit your analysis.
🎨 Stunning Color Gradient - Each moving average type is displayed in a unique color, creating a beautiful rainbow effect.
📉 Overlay Compatible - Use it as an overlay on your price chart for clear trend insights.
With the "Rainbow Fibonacci Momentum - SuperTrend" indicator, you'll add a burst of color to your trading routine and gain a deeper understanding of market trends.
HOW IT WORKS
MA Lines:
MA - 5: purple lines
MA - 8: blue lines
MA - 13: green lines
MA - 21: yellow lines
MA - 34: orange lines
MA - 55: red line
Header Color Indicators:
Purple: MA-5 is in uptrend on the chart
Blue: MA-5 and MA-8 are in the uptrend on the chart
Green: MA-5, MA-8 and MA-13 are in the uptrend on the chart
Yellow: MA-5, MA-8, MA-13 and MA-21 are in the uptrend on the chart
Orange: MA-5, MA-8, MA-13, MA-21 and MA-34 are in the uptrend on the chart
Red: MA-5, MA-8, MA-13, MA-21, MA-34 and MA-55 are in the uptrend on the chart
Red + White Arrow: All MAs are correctly aligned in the uptrend on the chart
Footer Color Indicators:
Purple: MA-5 is in downtrend on the chart
Blue: MA-5 and MA-8 are in the downtrend on the chart
Green: MA-5, MA-8 and MA-13 are in the downtrend on the chart
Yellow: MA-5, MA-8, MA-13 and MA-21 are in the downtrend on the chart
Orange: MA-5, MA-8, MA-13, MA-21 and MA-34 are in the downtrend on the chart
Red: MA-5, MA-8, MA-13, MA-21, MA-34 and MA-55 are in the downtrend on the chart
Red + White Arrow: All MAs are correctly aligned in the downtrend on the chart
Background Colors:
Light Red: All MAs are on the rise!
Red: All MAs are align correctly on the rise!
Light Green: All MAs are in freefall!
Green: All MAs are align correctly in freefall!
Tiny Arrows Indicators/Alerts:
Down Arrow: All MAs are in freefall!
Up Arrow: All MAs are on the rise!
Big Arrows Indicators/Alerts:
Down Arrow: All MAs are align correctly in freefall!
Up Arrow: All MAs are align correctly on the rise!

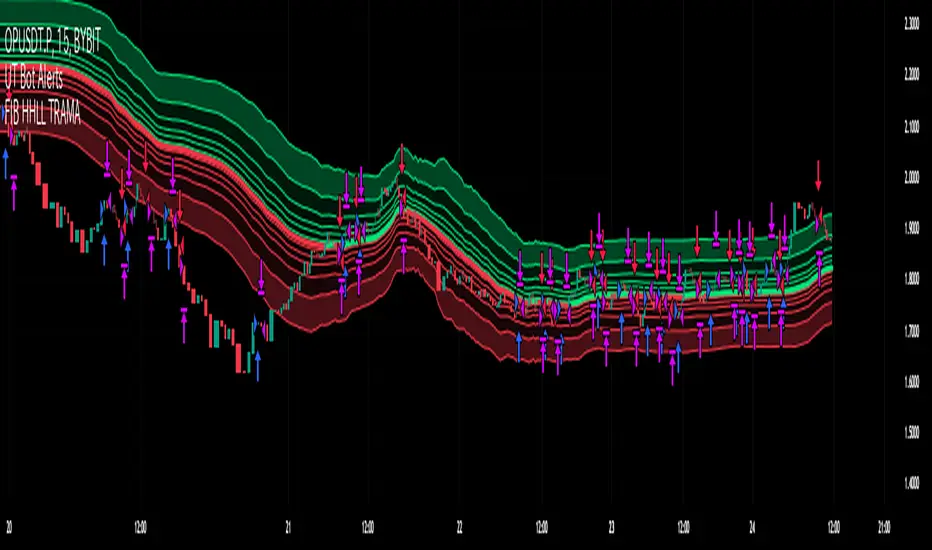
Fibonacci HH LL TRAMA BandLuxAlgo's Trend Moving Adaptive Moving Average was used as a reference to create bands by reading the highest and lowest prices of past bars based on Fibonacci numbers and then multiplying them by the Fibonacci ratio.
LuxAlgo/ LuxAlgo/
In particular, the so-called TRAMA is characterized by its adaptation to the average of the highest and lowest prices over a specific period of time and is used to identify support/resistance.
In order to apply this feature to the maximum extent possible, I used the high or low prices as the source of input, rather than the closing price.
For example,
src = high
not original like
src = close
In addition, I created 6 levels by multiplying the Fibonacci ratio
//Midline
mah = ama1
mal = ama2
m = (mah + mal)/2
//Half Mean Range
dist = (mah - mal)/2
//Levels
h6 = m + dist * 11.089
h5 = m + dist * 6.857
h4 = m + dist * 4.235
h3 = m + dist * 2.618
h2 = m + dist * 1.618
h1 = m + dist * 0.618
l1 = m - dist * 0.618
l2 = m - dist * 1.618
l3 = m - dist * 2.618
l4 = m - dist * 4.235
l5 = m - dist * 6.857
l6 = m - dist * 11.089
If you want to use it for scalping, such as 15 minutes, you can include Fibonacci numbers such as 21,34,55 for a quick reaction type to detect the trend. Also, by including Fibonacci numbers such as 89,144,233, you can see where you stand in the larger trend. Some examples are included below.
For Investors
BTCUSDT 1day Chart Fibonacci number "55"
For Daytraders
BTCUSDT 4hour Chart Fibonacci number "34"
For Scalpers
BTCUSDT 15min Chart Fibonacci number "55"
BTCUSDT 15min Chart Fibonacci number "89"
BTCUSDT 15min Chart Fibonacci number "233"
Fibonacci numbers are 1, 1, 2, 3, 5, 8, 13, 21, 34, 55, 89, 144, 233, 377, 610, etc.,
Fibonacci ratios are 0.618, 1.618, 2.618, 4.236, 6.854, 11.089, etc.,
RAINBOW AVERAGES - INDICATOR - (AS) - 1/3
-INTRODUCTION:
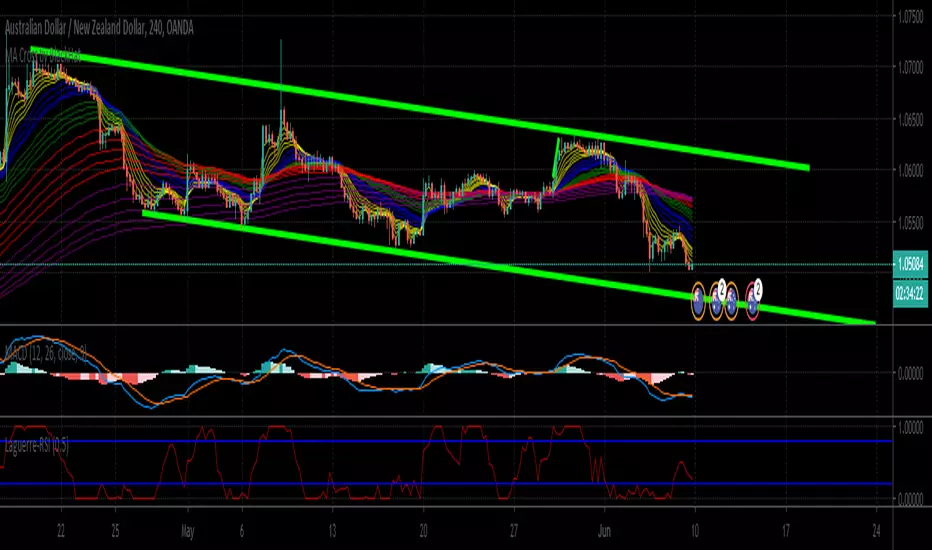
This is the first of three scripts I intend to publish using rainbow indicators. This script serves as a groundwork for the other two. It is a RAINBOW MOVING AVERAGES indicator primarily designed for trend detection. The upcoming script will also be an indicator but with overlay=false (below the chart, not on it) and will utilize RAINBOW BANDS and RAINBOW OSCILLATOR. The third script will be a strategy combining all of them.
RAINBOW moving averages can be used in various ways, but this script is mainly intended for trend analysis. It is meant to be used with overlay=true, but if the user wishes, it can be viewed below the chart. To achieve this, you need to change the code from overlay=true to false and turn off the first switch that plots the rainbow on the chart (or simply move the indicator to a new pane below). By doing this, you will be able to see how all four conditions used to detect trends work on the chart. But let's not get ahead of ourselves.
-WHAT IS IT:
In its simplest form, this indicator uses 10 moving averages colored like a rainbow. The calculation is as follows:
MA0: This is the main moving average and can be defined with the type (SMA, EMA, RMA, WMA, SINE), length, and price source. However, the second moving average (MA1) is calculated using MA0 as its source, MA2 uses MA1 as the data source, and so on, until the last one, MA9. Hence, there are 10 moving averages. The first moving average is special as all the others derive from it. This indicator has many potential uses, such as entry/exit signals, volatility indication, and stop-loss placement, but for now, we will focus on trend detection.
-TREND DETECTION:
The indicator offers four different background color options based on the user's preference:
0-NONE: No background color is applied as no trend detection tools is being used (boring)
1-CHANGE: The background color is determined by summing the changes of all 10 moving averages (from two bars). If the sum is positive and not falling, the background color is GREEN. If the sum is negative and not rising, the background color is RED. From early testing, it works well for the beginning of a movement but not so much for a lasting trend.
2-RAINBW: The background color is green when all the moving averages are in ascending order, indicating a bullish trend. It is red when all the moving averages are in descending order, indicating a bearish trend. For example, if MA1>MA2>MA3>MA4..., the background color is green. If MA1 threshold, and red indicates width < -threshold.
4-DIRECT: The background color is determined by counting the number of moving averages that are either above or below the input source. If the specified number of moving averages is above the source, the background color is green. If the specified number of moving averages is below the source, the background color is red. If all ten MAs are below the price source, the indicator will show 10, and if all ten MAs are above, it will show -10. The specific value will be set later in the settings (same for 3-TSHOLD variant). This method works well for lasting trends.
Note: If the indicator is turned into a below-chart version, all four color options can be seen as separate indicators.
-PARAMETERS - SETTINGS:
The first line is an on/off switch to plot the skittles indicator (and some info in the tooltip). The second line has already been discussed, which is the background color and the selection of the source (only used for MA0!).
The line "MA1: TYP/LEN" is where we define the parameters of MA0 (important). We choose from the types of moving averages (SMA, EMA, RMA, WMA, SINE) and set the length.
Important Note: It says MA1, but it should be MA0!.
The next line defines whether we want to smooth MA1 (which is actually MA0) and the period for smoothing. When smoothing is turned on, MA0 will be smoothed using a 3-pole super smoother. It's worth noting that although this only applies to MA0, as the other MAs are derived from it, they will also be smoothed.
In the line below, we define the type and length of MAs for MA2 (and other MAs except MA0). The same type and length are used for MA1 to MA9. It's important to remember that these values should be smaller. For example, if we set 55, it means that MA1 is the average of 55 periods of MA0, MA2 will be 55 periods of MA1, and so on. I encourage trying different combinations of MA types as it can be easily adjusted for ur type of trading. RMA looks quirky.
Moving on to the last line, we define some inputs for the background color:
TSH: The threshold value when using 3-TSHOLD-BGC. It's a good idea to change the chart to a pane below for easier adjustment. The default values are based on EURUSD-5M.
BG_DIR: The value that must be crossed or equal to the MA score if using 4-DIRECT-BGC. There are 10 MAs, so the maximum value is also 10. For example, if you set it to 9, it means that at least 9 MAs must be below/above the price for the script to detect a trend. Higher values are recommended as most of the time, this indicator oscillates either around the maximum or minimum value.
-SUMMARY OF SETTINGS:
L1 - PLOT MAs and general info tooltip
L2 - Select the source for MA0 and type of trend detection.
L3 - Set the type and length of MA0 (important).
L4 - Turn smoothing on/off for MA0 and set the period for super smoothing.
L5 - Set the type and length for the rest of the MAs.
L6 - Set values if using 4-DIRECT or 3-TSHOLD for the trend detection.
-OTHERS:
To see trend indicators, you need to turn off the plotting of MAs (first line), and then choose the variant you want for the background color. This will plot it on the chart below.
Keep in mind that M1 int settings stands for MA0 and MA2 for all of the 9 MAs left.
Yes, it may seem more complicated than it actually is. In a nutshell, these are 10 MAs, and each one after MA0 uses the previous one as its source. Plus few conditions for range detection. rest is mainly plots and colors.
There are tooltips to help you with the parameters.
I hope this will be useful to someone. If you have any ideas, feedback, or spot errors in the code, LET ME KNOW.
Stay tuned for the remaining two scripts using skittles indicators and check out my other scripts.
-ALSO:
I'm always looking for ideas for interesting indicators and strategies that I could code, so if you don't know Pinescript, just message me, and I would be glad to write your own indicator/strategy for free, obviously.
-----May the force of the market be with you, and until we meet again,

Rainbow Moving AverageA Rainbow Moving Average script. There are many like it, but this one is mine. It is designed to be easy to read without too much noise in the number of lines and shading, with the moving average to be some of the commonly used ones. Using commonly referenced moving average values help us to understand "the crowd" and what moving average or trend lines they might be looking at. The default values are derived from hourly charts, but work well on any time frame.
The moving average function is simple to change so you can use it for any moving average type that you like, including volume-weighted.
Inspired by my daughter's love of rainbows, she has approved the colors.

RAINBOW_13thHi Dears!
hereby, I present you one of my indicators which is a kind of artistic indicator.
It calculates different ranks of functions and based on them suggests a buy or sell order which is depicted on right-side separately.
Inputs:
(For calculating)
+Source:
+Length: Number of previous bars in calculation
+Topology:
++EMA
++RMA
++SMA
++RSI
+OVER BOUGHT RSI: Define your boundary for overbought in RSI-TOPOLOGY.
+OVER SOLD RSI: Define your boundary for oversold in RSI-TOPOLOGY.
(Visual)
+Transparency: affect colors of rainbow!
Wish you good deals!
BY USING PLZ DO NOT FORGET TO BOOST IT!
Shakib.

Moving Averages RefurbishedIntroduction
This is a collection of multiple moving averages, where you can have a rainbow of moving averages with different types that can be defined by the user.
There are already other indicators in this rainbow style, however certain averages are absent in certain indicators and present in others,
needing the merge to have a more complete solution.
Resources
Here there is the possibility to individually define each moving average.
In addition, it is possible to adjust some details, such as themes, coloring and periods.
Regarding the calculation of averages, credit goes to the following authors.
What I've done here is to group these averages together and allow them to combine.
Credits
TradingView
PineCoders
CrackingCryptocurrency
MightyZinger
Alex Orekhov (everget)
alexgrover
paragjyoti2012
Moving averages available
1. Exponential Moving Average
2. Simple Moving Average
3. Relative Moving Average
4. Weighted Moving Average
5. Ehlers Dynamic Smoothed Moving Average
6. Double Exponential Moving Average
7. Triple Exponential Moving Average
8. Smoothed Moving Average
9. Hull Moving Average
10. Fractal Adaptive Moving Average
11. Kaufman's Adaptive Moving Average
12. Volatility Adjusted Moving Average
13. Jurik Moving Average
14. Optimized Exponential Moving Average
15. Exponential Hull Moving Average
16. Arnaud Legoux Moving Average
17. Coefficient of Variation Weighted Exponential Moving Average
18. Coefficient of Variation Weighted Moving Average
19. * Ehlrs Modified Fractal Adaptive Moving Average
20. Exponential Triangular Moving Average
21. Least Squares Moving Average
22. RSI Moving average
23. Simple Triangular Moving Average
24. Triple Hull Moving Average
25. Variable Index Dynamic Average
26. Volume-weighted Moving Average
27. Zero-Lag Exponential Moving Average
28. Zero-Lag Simple Moving Average
29. Elastic Volume Weighted Moving Average
30. Tillson T3
31. Geometric Moving Average
32. Welles Wilder Moving Average
33. Adjusted Moving Average
34. Corrective Moving average
35. Exponentially Deviating Moving Average
36. EMA Range
37. Sine-Weighted Moving Average
38. Adaptive Moving Average TABLE
39. Following Adaptive Moving Average
40. Hilbert based Kaufman's Adaptive Moving Average
41. Median
42. * VWAP
43. * Rolling VWAP
44. Triangular Simple Moving Average
45. Triangular Exponential Moving Average
46. Moving Average Price Correlation
47. Regularized Exponential Moving Average
48. Repulsion Moving Average
49. * Symmetrically Weighted Moving Average
* fixed period averages

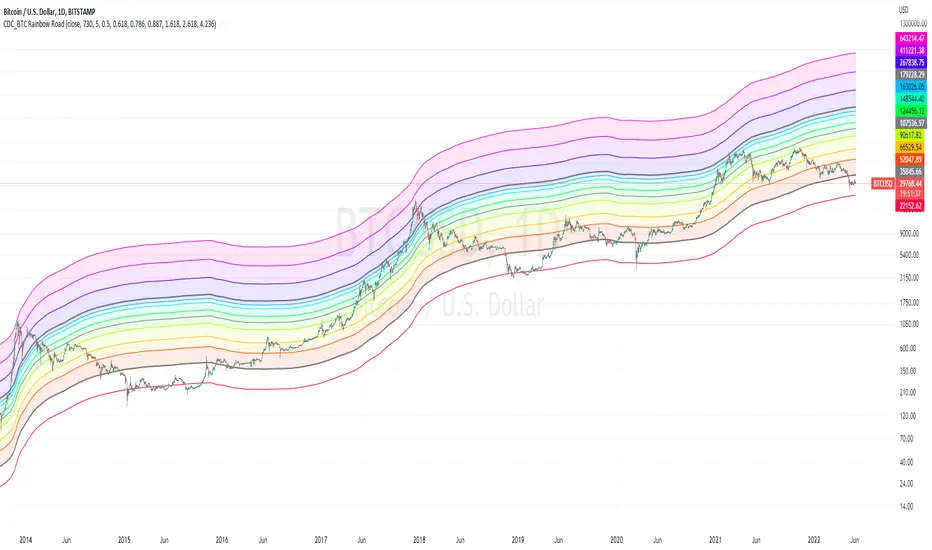
CDC_BTC Rainbow RoadThis is a simple script intended for use with Bitcoin only.
Inspired by Lyn Alden's 2 years SMA channels
I decided to make one for myself just for fun but ended up adding a few more lines of code
the bands show Fibonacci levels in and outside of the channels.
The base line uses a 730 day simple moving average.
Each zones can be considered as a general guidelines for accumulation / distribution of wealth in Bitcoin.
[blackcat] L1 Mel Widner Rainbow ChartNOTE: Because the originally released script failed to comply with the House Rule in the description, it was banned. After revising and reviewing the description, it is republished again. Please forgive the inconvenience caused.
Level: 1
Background
The Rainbow Charts indicator is a technical analysis tool that follows trend. It helps traders to visualize a full spectrum of trends in the market. Mel Widner developed the indicator and elaborated it in the 1997 issue of Technical Analysis of Stocks and Commodities magazine. It uses 10 simple moving averages and hence, it is a very interesting take on a simple moving average.
Function
The basis of the Rainbow Charts indicator are 10 moving averages. The first Rainbow Moving Average is a 2-period simple moving average. It applies recursive smoothing to this first SMA. The first moving average is the base of nine other simple Rainbow Moving Averages of different lengths. Each SMA bases on the previous SMA. The application of the recursive smoothing enables the indicator to create a full spectrum of the current trends in the market. As we know that the financial markets are full of wonders and surprises and we have an indicator that also surprises us. Yes, it is none other than the Rainbow Charts indicator that presents information on the charts in the form of a rainbow. That is the reason that it is known as the Rainbow Charts indicator.
The interpretation of the Rainbow Charts indicator is quite straightforward. The Rainbow Moving Average with the least recursive smoothing stays at the very top of the Rainbow during a bullish trend in the market. Conversely, the moving average with the most recursive smoothing stays at the bottom of the Rainbow.
On the other hand, the positions of the least and the most smoothed moving averages reverses during a bearish trend in the market. Now the least smoothed moving average stays at the bottom while the most smoothed moving average stays at the top of the Rainbow.
The Rainbow Charts indicator’s moving averages track the uptrend or downtrend in the market. The moving averages track the trend as it progresses and cross each other in a sequential order. The distancing of the price from the Rainbow indicates the continuation of the current market trend. Conversely, if the price moves closer to the Rainbow, it suggests that a potential trend reversal is imminent.
The use of the indicator is also quite simple. Traders should look for initiating a buy position as soon as a strong positive move starts. Similarly, they should look for opening a sell position at the very beginning of a strong negative trend. It is important to note that the angle of the moving averages helps to identify the strength of a trend. The steeper curve suggests a stronger trend and vice versa.
Traders can also use the tool in combination with other technical analysis tools as a trend-following indicator. Traders can enter a buy position when indicators suggest a strong bullish trend. They can initiate a sell position when indicators indicate a bearish trend. Technical analysts and experts always suggest to use the Rainbow Charts indicator in combination with other technical analysis tools for successful trading.
Key Signal
Plot a1~c4 --> 10 Rainbow Moving Averages.
Remarks
This is a Level 1 free and open source indicator.
Feedbacks are appreciated.

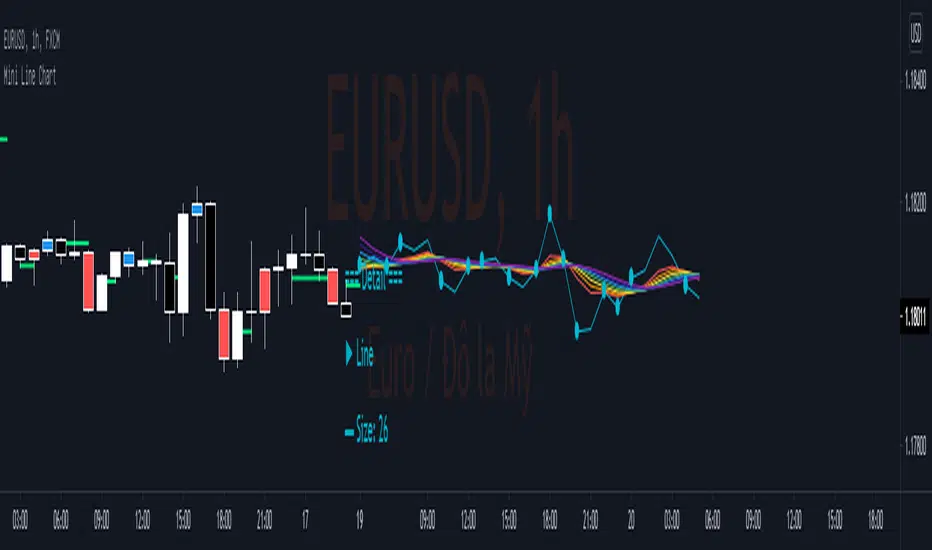
Mini Line ChartMini Line Chart show a small line chart beside the main chart. Detail of Mini Line chart as below:
1.Line chart adjustable:
- Size: number of bar to show as line chart
- Source: Open/ High/ Low/ Close/ HL2/ HLC3/ OHLC4
- Color
2.Rainbow Moving average adjustable:
- Type: SMA/EMA
- Period: Period of 1st MA
- Source: Open/ High/ Low/ Close/ HL2/ HLC3/ OHLC4
- Displacement: Period of moving avarage for 2nd MA to 7th MA
- 7 Color
3.Key Level
- Key Level is Line value when Line crossed Rainbow Moving Average
- Direction Up when Line cross over Rainbow Moving Average
- Direction Down when Line cross under Rainbow Moving Average
- Direction Not Defined when Line cross inside Rainbow Moving Average
4.Key Line
- Key Line ploted by Key Level at the main chart
- Width and color of Key Line adjutable.
5.Key Bar
- Key Bar is the Time when Line crossed Rainbow Moving Average
- Key Bar Up when Line cross over Rainbow Moving Average
- Key Bar Down when Line cross under Rainbow Moving Average
- Color of Key Bar Up and Down adjutable
6.Detail Panel
- Background color & Style of Label adjutable
- Size & color of Text adjutable
- Location of Label adjutable by X offset & Y offset
7.Alert
- Alert will send "Key Level" to email or app when Line and Rainbow make a new cross.
8.Trading
- Consider to open position when Price pullback near to "Key Line" then breakout "Key Bar"
- Consider to stay out when Price pullback to "Key Line" then breakout "Key Line".
- Consider to close position or trailing stoploss when Line and Rainbow make a new cross.
- Stoploss, Stop Order may be place at High or Low of Key Bar.
- Take profit may be place at nearest Key Line in the past
- Trailing Stop may be move with Key Line.

EMA RainbowBased on Ripsters EMA clouds, this :
adds an 6 section EMA rainbow to act as DYNAMIC support and resistance levels, that you never have to set manually
splits the 5-12 cloud into 2 parts, as opposed to using a 8-9 centerline. More visually pleasing and intuitive to use
When 300 cloud and 25 cloud are both bullish or bearish - look to take positions in that direction
Use 5 cloud to find pullbacks for entry points
When cloud is moving away (diverging) from other clouds - momentum is increasing
When cloud is increasing in diameter (expanding) - momentum is increasing
When cloud is moving towards other clouds (converging) - momentum is increasing
When cloud is decreasing in diameter (contracting) - momentum is increasing

RAINBARSJust take a hit of LSD and ride the trend. I was messing around with generating colors. I used a simple python script which helps with generating tradingview code blocks and loops.

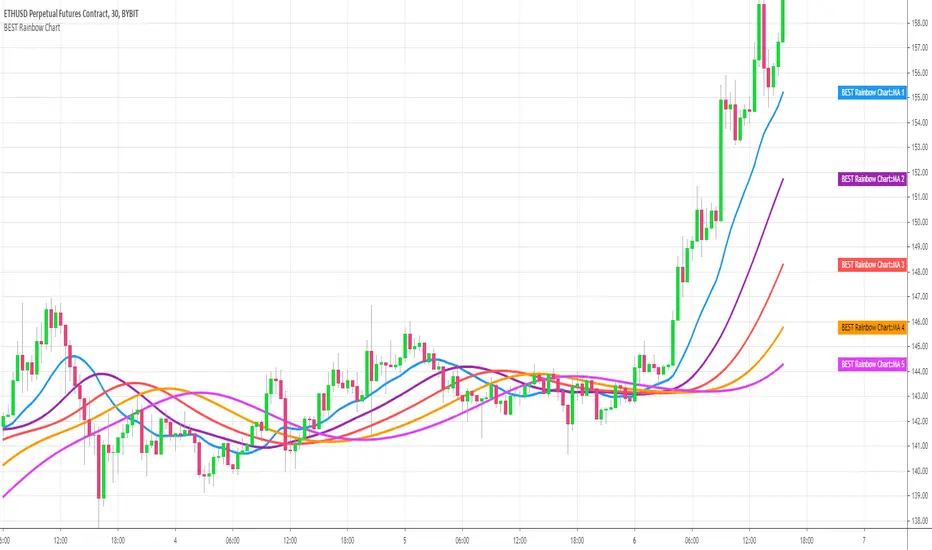
BEST Rainbow ChartHello traders
This script is a Pinescript adaptation of this FXCM/LUA script
Draws a flexible number of moving averages between 1 and 5 - with a end result looking like a rainbow
Formula
Each Moving Average is defined as a Moving Average of the previous MA
The first MA is based on candle close
MA = MA of Price
MA = MA of MA
....
MA = MA of MA
Bonus
You can select the MA type (EMA, SMA, SMMA, TEMA, DEMA, TMA, ALMA, VWMA, ...) and the MA period shared across all the moving averages
Scaling
If you have any issue with your scaling, you may follow this quick tutorial
Hope you'll like it because it looks nice on your chart :)
Dave

Rainbow MA V1 by BlackHatNo other Rainbow indicator available in TradingView could plot over 20 different MA's at the same time, so i designed this. No my idea. File is opensource. Made by BlackHat
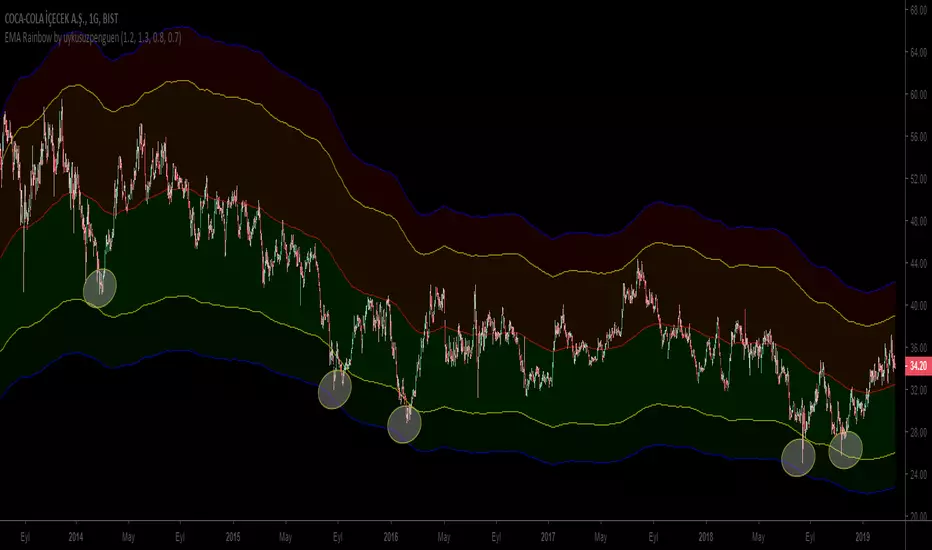
EMA Rainbow by uykusuzpenguenTo Survive in Bear Markets or in Horizontal Markets;
EMA Rainbow ;
EMA Rainbow is a rainbow which is formed by multiplying the moving average by certain proportions and reflecting up and down on the ema200. According to the observations, dark green areas are strong buying areas, dark red areas are strong sales regions. Trading decisions can be made according to the line breaks or the regions in which the price movements. Rates can be edited in the settings section.
The graph shows reactions in dark green areas.
Ayı Piyasasında yada Yatay Piyasalarda hayatta kalmak için ;
EMA Rainbow ;
EMA200 hareketli ortalamanın belirli oranlarla çarpılarak ema200ün üstüne aşşağı ve yukarı yansıtılmasıyla oluşan gökkuşağıdır. Yapılan gözlemlere göre koyu yeşil bölgeler güçlü alım yerleri , koyu kırmızı bölgeler güçlü satış bölgeleridir. Çizgi kırılımlarına yada fiyatın gezindiği bölgelere göre alım satım kararı verilebilir. Oranlar ayarlar kısmından düzenlenebilir.
Grafikte koyu yeşil bölgelerdeki tepkiler gözlemlenebilir.
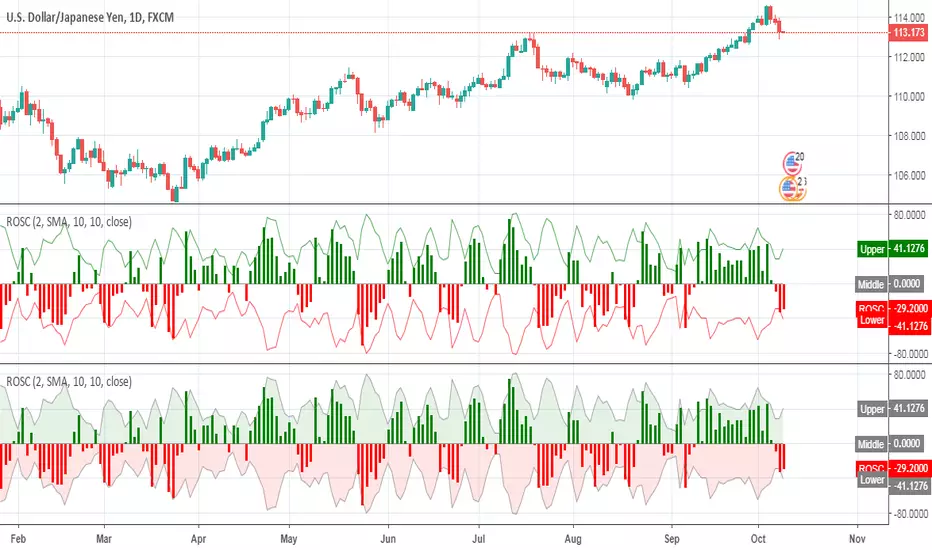
Rainbow OscillatorRainbow Oscillator script.
This indicator was developed and described by Dr. Mel Widner (Stocks & Commodities V.15:7: Rainbow Charts).
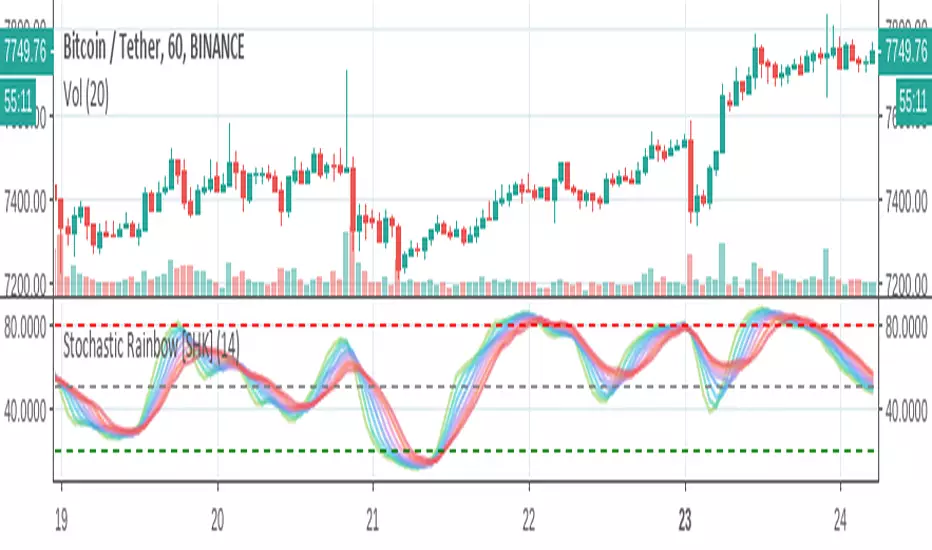
Stochastic Rainbow [SHK]Stochastic Rainbow consists of 8 stochastic oscillators with different speeds. So It has lower noises and better visualization comparing to simple stochastic.
I welcome comments, suggestions.