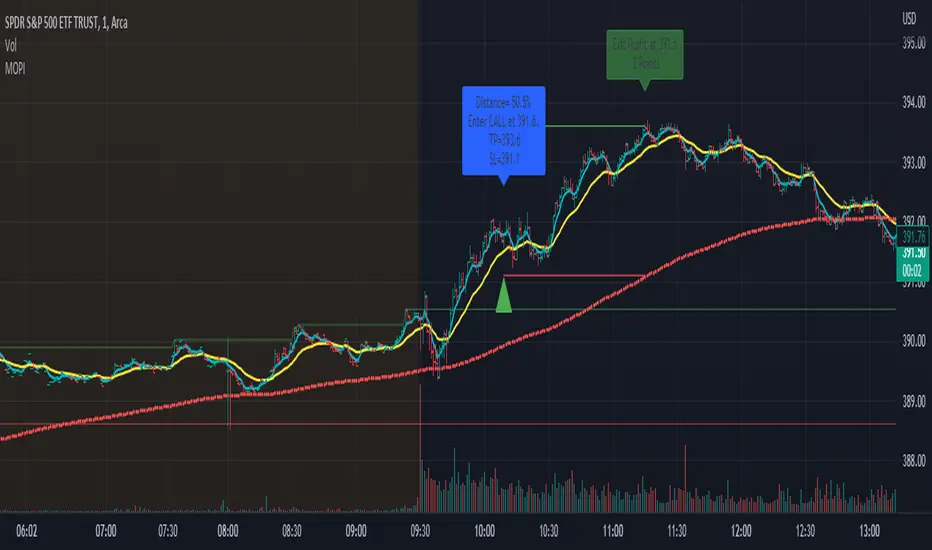
Morning Option Pullback IndicatorI designed this indicator to help me identify Option CALL and PUT signals for the QQQ and SPY on the 1 min chart.
Summary of how it works
1. It identifies the Pre-Market channel High and Low and draws green and red lines for the day at these levels.
2. Waits for a morning or afternoon sessions breakout/breakdown of price out of that channel.
3. The buy a CALL or PUT signal is when price pulls back to the EMA Medium line after breaking out of the channel.
4. Settings allow adjusting of when the signal happens
5. EMA Short (5) and EMA Medium (20) must stay apart for a selectable number of bars
6. For a CALL signal, the Price and EMA Medium (20) must be above the Pre Market High line when price pulls back to EMA Medium (20) line
7. There is a selectable adjustment to allow the signal to trigger when the price comes within a close enough range of the EMA Medium and PM High lines
8. There is a TICK.US filter that you can use to only signal a CALL when the TICK.US 10 min chart shows the average of the EMA5 and EMA20 is over 100
9. It has Buy and Sell signal Alerts and user adjustable Stop Loss and Profit Taker settings.
10. EMA Settings are adjustable and can show up to 3 EMA's on the chart. I personally like the EMA5 and 20. Others may use something similar like 9 and 21. It's user selectable.
Pullback
Ma PullbackThis indicator is based on ema band....
condition for buy =>
1) price should crossover ema band
2) price pullback on ema band but price should not close below lower band
3)after pullback green candle should close above ema band
4)check candle size when its crossing ema band
5)check previous canlde 7 should not touching cloud so (we can reduce range signal)
condition for sell =>
1) price should crossunder ema band
2) price pullback on ema band but price should not close above upper band
3)after pullback red candle should crossunder ema band
4)check candle size when its crossing ema band
5)check previous canlde 7 should not touching cloud so (we can reduce range signal)
this indicator also for education purpuse how we can make pullback condition....

RSI Pull-BackA pull-back occurs whenever the price or the value of an indicator breaks a line and comes back to test it before continuing in the prevailing trend.
The RSI has oversold and overbought levels such as 20 and 80 and whenever the market breaks them returns to normality, we can await a pull-back to them before the reversal continues.
This indicator shows the following signals:
* A bullish signal is generated whenever the RSI surpasses the chosen oversold level then directly shapes a pull-back to it without breaking it again.
* A bearish signal is generated whenever the RSI breaks the chosen overbought level then directly shapes a pull-back to it without surpassing it again.

Market Crashes/Chart Timeframes HighlightThis extremely helpful indicator allows you to highlight 7 custom date-based timeframes on your charts.
The default dates selected are what I consider to be the most significant 7 most recent market declines, including and since the 87 flash crash.
Note: The default dates are approximate but good enough to highlight the key timeframes of these pullbacks/crashes/corrections.
It's simple to use and does exactly what it should.
I created this indicator to make it easier when looking at the overall story of a chart. I found it helpful to highlight these areas to see how a market or equity has responded during these significant market pullbacks.
The highlight alone I’ve found helpful, and it becomes more powerful if you combine it with your own trusted trade system.
Also, to get the most out of using the default dates it’s important to understand the narrative behind each pullback/crash. Here’s the list of what I consider significant pullbacks:
Black Monday - Oct 87
1990s Recession - Jul 90 to Mar 91
Dot Com Bubble - 2000 to 2002 or so
Real Estate 2008 Crisis - I choose 2007-2009 to cover full insider knowledge and aftermath
2016 - 2018 - This isn't seen as a pullback, but I have it as significant because in many markets and equities, this was an almost equal percentage pullback as 2008. See Notes below
2020 Crash - Covid-19 and related shenanigans pullback
April 2021 to August 2022 - I believe we are in a current SHORT cycle so I've highlighted April 2021 as the start of what might be the start of a major decline testing Dot Com or lower levels.
A few notes on the above.
You'll find on most of the pullbacks listed above most equities and related markets behave similarly or have similar patterns.
The 2016-18 pullback is the most difficult to track. For instance, GE in this timeframe had a -80% decline, whereas BA depending on how you want to measure it had a 50-110% gain.

Channel SurfingThis is my Channel Surfing indicator. It fires Buy and Sell signals based on multiple conditions. You can use EMAs or LSMAs. You will have to check the box of which moving averages to use once you add it to the chart. It plots EMAs or LSMAs using the different sources Close, Low, and High as the channel to surf. It fires a Buy signal if price crosses the channel up and if there is a pullback into the channel followed by a breakout to the upside. It fires a Sell signal if price crosses the channel down and if there is a pullback into the channel followed buy a breakdown to the down side. I find it works great on the 5 minute SPY chart and the 1 minute chart of ES with the default settings when scalping. You are able to switch between 2 different channels using LSMAs or EMAs. The EMAs has an optional LSMA slope filter for getting rid of some false signals. Let me know if you guys find any other settings or ways to use this and as always I hope it helps.

VIX - SKEW DivergenceThe CBOE VIX is a well-known index representing market expectations for volatility over the next 30 days.
The CBOE SKEW is an index reflecting the perceived tail risk over the next 30 days.
When the SKEW rises over a certain level (~140/150), that means investors are hedging their exposure with options, because they are worried about an incoming market crash or a "black swan". If that happens when the VIX is very low and apparently there is no uncertainty, this can warn of a sudden change in direction of the market. You will see for yourself that an increasing divergence often anticipates a sharp fall of leading stock indexes, usually within two to four months.
This is probably not very relevant for the short-term trader but mid/long-term traders and market analysts may find it useful to clearly visualize the extent of the distance between the VIX and the SKEW. For that reason, I wrote this highly customizable script with which you can plot the two indexes and fill the space within them with a color gradient to highlight the maximum and minimum divergence. Additionally, you can fill the beneath VIX area with four different colors. It is also possible to plot the divergence value itself, so if you want you can draw trendlines and support/resistance levels on it.
Please note that the divergence per se doesn't predict anything and it's meant to be used synergistically with other technical analysis tools.
More informations here:
www.cboe.com
www.cboe.com

2 Ema Pullback StrategyHi everyone!
CAUTION... This is only an indicator. Do not rely 100% on it.
I made this indicator hoping to help everyone with this specific Pull Back Scalping Strategy.
RULES:
Time Chart of 5minuts
LONG Condition - "EMA Red Line" below the "EMA Blue Line" and wait for a green long signal.
SHORT Condition - "EMA Red Line" below the "EMA Blue Line" and wait for a red short signal
Feel free to add any adjustments or give feedback so we can improve.
The strategy idea and guidelines came from "The Master" Juan Luis.
Autor: © Germangroa

2 EMA PullbackHi everyone!
CAUTION... This is only an indicator. Do not rely 100% on it.
I made this indicator hoping to help everyone with this specific Pull Back Scalping Strategy.
RULES:
Time Chart of 5minuts
Long Condition - "EMA Red Line" below the "EMA Blue Line" and wait for a green long signal.
Short Condition - "EMA Red Line" below the "EMA Blue Line" and wait for a red short signal
Feel free to add any adjustments or give feedback so we can improve.
The strategy idea and guidelines came from the "Master Juan Luis"
Autor: © Germangroa
LNL Pullback ArrowsBuying the dip has never been easier! LNL Pullback Arrows are here to pinpoint the best possible entries for the trend following setups. With the Pullback Arrows, trader can pick his own approach and risk level thanks to four different types of arrows. The goal of these arrows is to force the traders to scale in & out of trades which is in my opinion crucial when it comes to trend following strategies. These arrows were designed primarily for the daily & weekly time frame (swing trading).
Four Types of Pullback Arrows:
1. Aggro Arrows - Ideal for aggresive approach during parabolic trends. Sometimes trends are so strong that the price barely revisits the daily 8 EMA. This is where the aggro arrows can perfectly pinpoint the aggresive high risk entries. Ideal for halfsize or 1/4 size of the full position. Aiming for quick 1-2 day moves targeting the recent high/low. These arrows could be also named as scalping arrows for the swing traders. A quick In & Out.
2. HalfSize Arrows - Medium risk approach. First arrows to scale in. HalfSize arrows are the first sign that the pullback might be ending, yet there is still some space left for an even deeper pullback. That is the reason why they are called half-size. Ideally taken with half-sized position. When trading the HalfSize Arrows, It is better to have some "spare ammo in the gun" ready to use.
3. FullSize Arrows - Regular risk approach. These arrows represent a zone where the core of the posititon should be taken. The point of validity for the trend is not that far away, meaning the risk can be kept tight. Ideal for scailing the other halfs or quarters of the full position. Also great for more conservative traders or environments with higher volatility.
4. Rare Arrows - Offer the best risk to reward entries during the trend. Rare Arrows should be the "last kick" of the retracement, therefore stops can be positioned really tight. They either trigger the stop immidiately or they provide another juicy leg up or down in the direction of the trend. However, they really do appear rarely.
Simple EMA Cloud:
A simple cloud based on 21 and 55 exponential moving averages. This default length creates a pullback zone that is wide enough for the conservative traders but also give the opportunities to more aggresive traders. Alternatives such as 8 & 21, or 21 & 34 are forming the zone that is too aggresive and usually too thin. Of course, cloud can be fully adjusted or turned off completely. The only role of the cloud is to gauge the trend.
Tips & Tricks:
1.Importance of the Scailing
- As already stated, scailing is crucial to this since there is no way of knowing the exact level at which the price magically bounce every time. It is hard to tell where and which EMA will be respected. How can we know it will be 21 EMA every time? or 34 EMA or 10 EMA or 100 SMA or 50 DMA ... Single MA does not make a trend. This is the reason why scailing is so important. Scailing can make a difference.
2. Nothing is Perfect
- Same as any other study, nothing works 100% perfectly. Sometimes the setup will go right against you and sometimes the price will fade away sideways and breaks off the structure of the trend. This is not a magic certainty tool. This is just another probability tool.
3. Point of Validity & Other Studies
- Even though the pullback arrows can be a stand-alone strategy. It is important to use other indicators that visualize the actual trend. Whether its EMA Cloud or EMAs or DMI Bars or Keltner Channels, there should be something that validates the trend, something that tells the trend is over. (Pullback Arrows are not showing the actual stops!).
Hope it helps.

CANDLE FILTER Todays scripts is based on my Pullback And Rally Candles with other meaningful candles such as Hammers and Dojis.
You can choose which Candles to show on the cart and if you want to candles to appear above or below a moving average.
If you follow my work, you may recognise some of these candles which I'm about to show you however these candles are 1) more refined and 2) has moving average filters.
Ive included a D,6H,1H Candle in this script as on different timeframes - each swing low on average has a different amount of bars within the swing low / swing high so the DPB and RD will only work on the Daily
//Pullback candle
This candle is very powerful when used with simple Price Action such as Market Structure//Demand zones and support zones. (((((WORKS BEST IN UPTRENDS AND BOTTOM OF RANGES)))))
Ive included a D,6H,1H Pullback Candle in this script as on different timeframes - each swing low on average has a different amount of bars within the swing low so the DPB will only work on the Daily
//DAILY PULLBACK (Swing Traders)
snapshot
//4H PULLBACK (Swing Traders)
snapshot
- this signal will produce more signals due to the swing low filter on the 4H
//1H PULLBACK
snapshot
- this signal has been refined due to too many candle displaying in weak areas
!!!IF YOU DONT WANT TO USE PULLBACKS DURING DOWNTRENDS THEN USE THE EMA FILTER TO TURN OFF THE PULLBACKS WHEN PRICE IS BELOW THE MOVING AVERAGE!!!
//Rally candle (My personal Favourite) (((((WORKS BEST IN DOWNTRENDS AND TOP OF RANGES)))))
This candle is very powerful when used with simple Price Action such as Market Structure//Supply zones and Resistance zones.
//DAILY RALLY(Swing Traders)
snapshot
//4H RALLY(Swing Traders)
snapshot
- this signal will produce more signals due to the swing high filter on the 4H
!!!IF YOU DONT WANT TO USE RALLIES DURING UPTRENDSTHEN USE THE EMA FILTER TO TURN OFF THE RALLIES WHEN PRICE IS ABOVE THE MOVING AVERAGE!!!
//POWERFUL DOJIS (INDECISION)
snapshot
We look for indecision in key areas to see if momentum is shifting. When combined with Pullbacks or Rallys - this will enhance the odds of a probably area.
//HAMMERS
snapshot
//MOVING AVERAGES
snapshot
Short EMA = 50
Long EMA = 200
This filter can be used when the market is trending - look out for rejections off the moving averages
Also you can chance the Short And Long EMA to choose which MA cross you want to use
snapshot
ALSO ALL THE CANDLES HAVE A ALERT CONDITIONS WHICH YOU CAN ACCESS - THIS WILL ALERT ANY CANDLE YOU CHOOSE
Please leave a like/comment on this post as this is much appreciated....

IsPullbackPivotRetested experimentThe indicator counts how often a pullback that starts outside the Keltner Channel resolves or fails.
Resolves: the pullback high or low is retested.
Fails: price goes outside the oppositie side of the Keltner Channel.

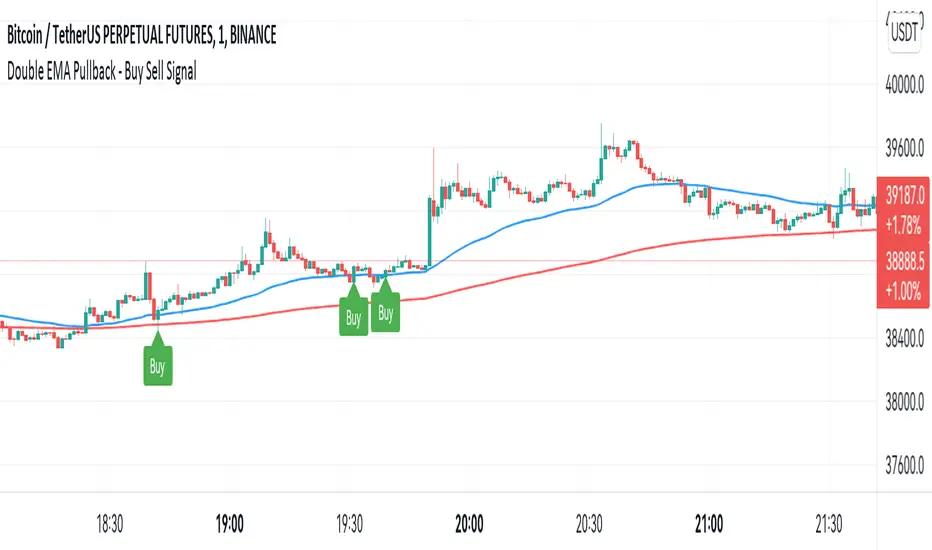
Double EMA WIth Pullback Buy Sell Signal - Smarter AlgoBuilt with love "Double EMA With Pullback Buy Sell Signal "
This indiator will help you to find a Double EMA Pullback Signal
You can combine with your own strategy, or use this purely
DISCLAIMER :
Measure the risk first before use it in real market
Backtest The Strategy was very important, so you know the probability
Fundamentally Logical :
Pullback (Some Previous candle is Red for Bull Pullback vice versa)
the Entry candle must be a Candlestick Pattern
Features :
1. Double EMA
2. Pullback Signal
How to use it :
1. Adjust the Pullback Backstep
2. Adjust the EMA Period
3. Adjust the Style to your preferences
Regards,
Hanabil
Smarter Pullback + Candlestick Pattern (Steven Hart)Built with love "Smarter Pullback + Candlestick Pattern"
This indiator will help you to find a Pullback + Candlestick Pattern, inspirated by Steven Hart
You can combine with your own strategy, or use this purely
DISCLAIMER :
Measure the risk first before use it in real market
Backtest The Strategy was very important, so you know the probability
Fundamentally Logical :
Pullback (Some Previous candle is Red for Bull Pullback vice versa)
the Entry candle must be a Candlestick Pattern
Features :
1. Engulfing
2. Hammer & Shooting Star
3. Doji
How to use it :
1. Adjust the Pullback Period
2. Check and Uncheck the Pattern you want to see
3. Adjust the style to your favourite
Regards,
Hanabil

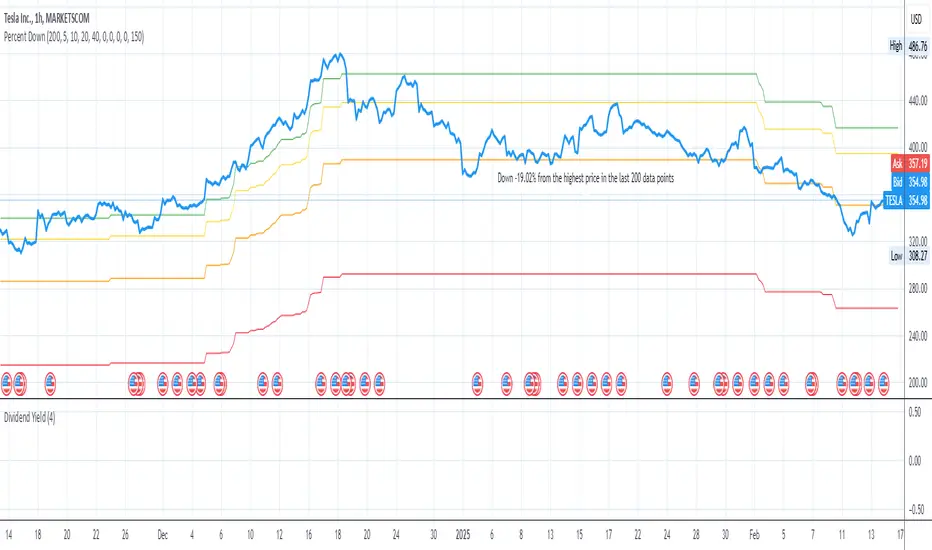
Price Target Pullback Correction or BearPrice Target percent drop is an indicator that allows you to set default percentage down from the 52 week high.
A pullback, correction, bear and a bear market is marked as a 5%, 10%, 20% or 40% drop from the 52 week highest price, so this will show the target price to buy at if these thresholds are hit.
You can change the default values of 5%, 10%, 20% and 40% to any percentage and the price will reflect the change of the default value. Furthermore, the default to use 52 weeks can be changed to find the highest price from the last 26 weeks or 104 weeks.
EMA deviation & Range with barcolor changeThis indicator includes an EMA, a range and outer lines similar to the Bollinger Bands, but with a different calculation (which also becomes apparent once you compare the two). This indicator fits very well with the EMA pullback strategy.
The color of the candles changes depending on where it is located.
Above the EMA - green
Below it - red
Inside the range - black
All colors as well as lines are customizable under the Style tab.
The "Deviation" can be set to 0, here there are only slight deviations.
The EMA range can be adjusted in 0.1 steps to achieve the highest possible accuracy of the pullbacks.
If you have any questions, please don't hesitate to contact me.

Retracer Barcolor With LuckyNickVaFibonacci Input Preset Retracer. This for highlighting your favorite Fibonacci retracement levels. Before using this indicator you should already have knowledge of what Fibonacci is & how to use it. These are levels where it said to be that the market may or may not reverse at. This is more used for anticipation, confluence & should be used in combination with other tools to confirm price action & your own analysis of your expectations. But quickly explained Fibonacci levels are Price Reversal levels that are self fulfilled due to mass trading at these price reversal levels. So the correct way to find opportunity with this script is to use these levels to analyze price action for Pullbacks in the market.

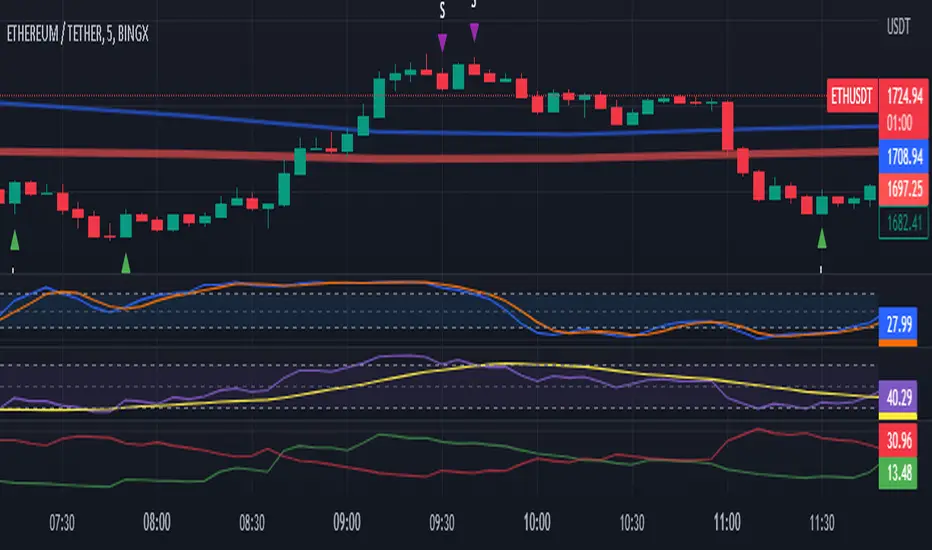
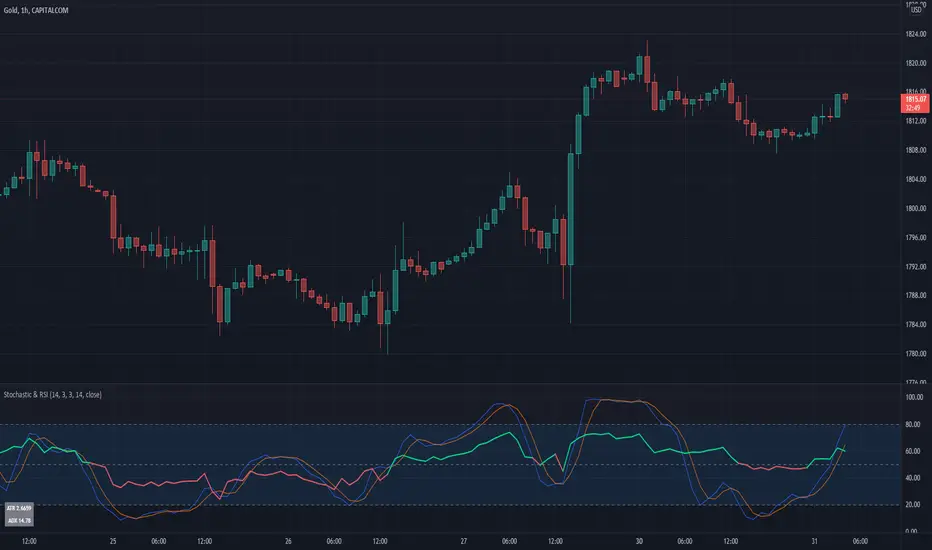
Stochastic & RSIThis script is a simple extension of the Built-In Stochastic RSI that also plots the RSI and prints the values of ATR and ADX of the last bar of the current timeframe to a small table in the corner.
The script can be used to define the entry for a trade when the stochastics crossed and RSI is below or above 0.50 (for going long or short).
OANDA:BTCUSD
I like to use the Stochastics and RSI indicators for pullback strategies, and with this inidcator you dont have to add both indicators to your setup. The ATR can be used to define the value of your stop-loss and the ADX (e.g. > 25) give you a hint for the strength of the current trend.
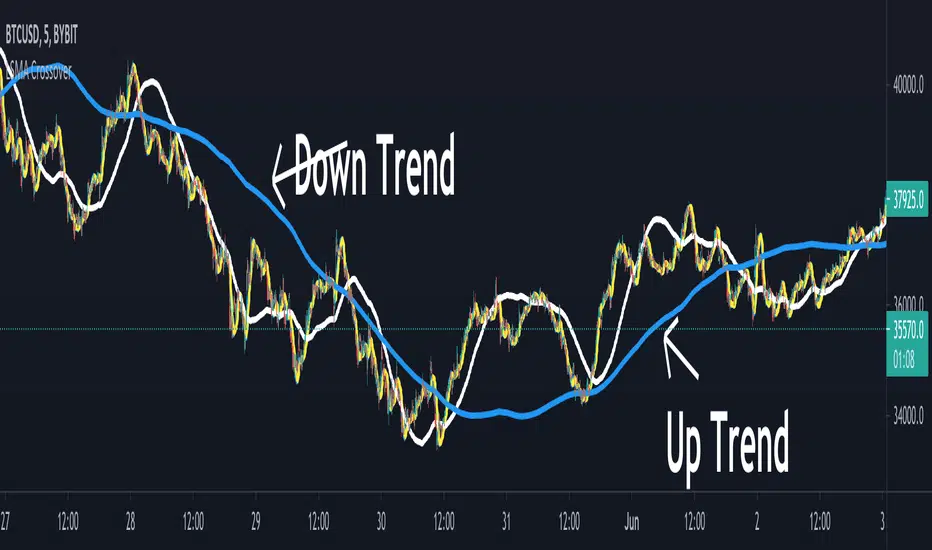
LSMA CrossoverThis is a simple script designed to help filter out bad trades. LSMA is a trend king and by using the 21,200 and 1000 length lines traders can get a clear view of where price action is travelling. This indicator is the perfect companion to the LSMA Wave Rider indicator. Once a pullback is discovered (price action crosses under blue or white line) Traders can use LSMA Wave Rider to locate perfect entry point.
Least Squares Moving Average follows these rules:
When price crosses over it signals a bull trend.
When price crosses under it signals bear trend.
When price stays close or on the line sideways action is to be expected.
The direction of the line shows the direction of the trend.
Here is an example of finding good trades. Price action pulls below white or blue line.
Another example of what a pullback looks like.
This example shows how to find trend using crossovers.
Another example how trend can be found but by using line direction.
LSMA Wave Rider can be found here:
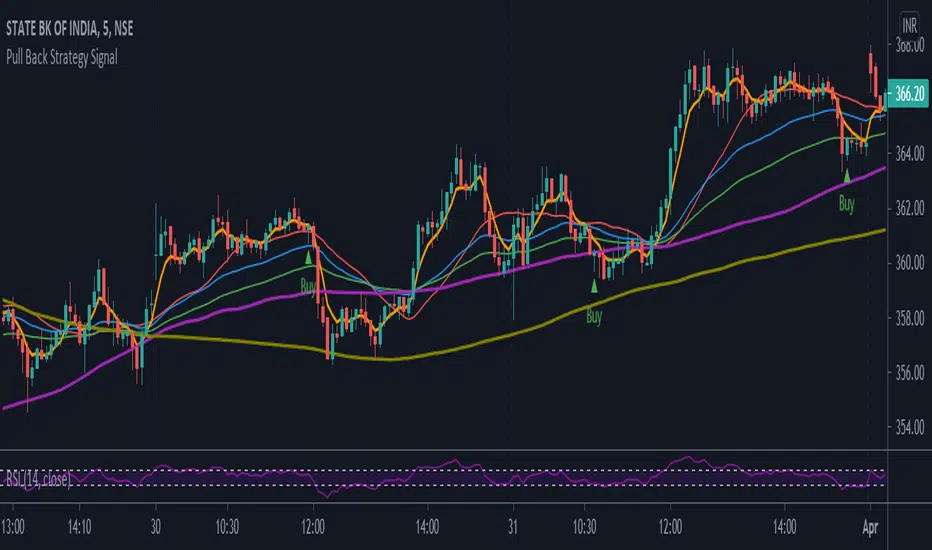
Pull Back Strategy SignalPull back strategy based on moving averages. The scripts will show buy or sell signal based on moving averages - exponential.
Trend ResumptionWe again keep it really simple.
This indicator just plots the combination of RGRR and GRGG candlesticks. (R = Red / Bearish, G = Green / Bullish)
When either pattern occurs, trade the combined high and combined low of recent 2 RR or recent 2 GG candles. I.e.,
Buy above GG's high with SL at GG's low.
Sell below RR's low with SL at RR's high.
Refer the shared chart for example. The signals were plotted on both the sides, and wherever triggered - gave rewards.
Only 1 at 05-Apr, 10:50 a.m. did not trigger, but that must then be ignored. Do not hurry to enter the trade, wait for breakout / breakdown above combined high / low.

Entry master RSI pullbackSimply using a single RSI and placing a signal after it crosses the 50 level after being overbought or oversold in the same direction.

Excellent ADXThe Average Directional movement indeX (ADX) is an indicator that helps you determine the trend direction, pivot points, and much more else! But it looks not so easy as other famous indicators. It seems strange or even terrible, but don't be afraid. Let's understand how it works and get its power into your analysis tactics.
In the beginning, imagine a drunk man goes through a ladder: step by step. Up, up, down, up, down, down, up...
How can we understand which direction he goes? Exactly! We can count the number of steps in each direction. In the above example, in the upward – 4, in the downward – 3. So, it looks like he goes in an upward direction.
The ADX indicator counts the same steps, but for price. The size of each step equals 1 ATR for "DI Length" candles. On the indicator chart, we have the green and red lines. The green line represents a number of steps upward. The red line shows one downward. When the red line upper green, then the price goes below, then the trend is directed down. Later the green line comes above the red one, and then the trend changes the direction to upward. Wow? After that, you can easy detect the trend direction on the market!
But it is still not the end. On the chart, we also have the fat blue line. This is the ADX line, and it represents the power of the trend. It is calculated from a distance between the green and red curves. The ADX line value grows if the distance is increased. If the movement is really powerful, then a number of steps into a direction much more prominent than one in an opposed direction. Then the blue line grows faster. But if the growth has stopped and the blue line turns back or already had changed self-direction, then it is a signal that the trend has ended too. It's an excellent sign to close the position (but not always). Easy? Not quite. Thresholds help you there. The indicator has two additional parameters: upper and lower thresholds to evaluate the trend-over signal strength. An u-turn of the ADX line above the upper threshold sends a strong signal. If one occurs between both thresholds, it is a bit weak signal. But if the blue line goes below the lower threshold, it looks like there is no trend, and the price goes side. We can also say that the price goes side when the ADX value gradually falls down.
The Excellent ADX indicator helps you catch pivot/pullback signals based on green, red, and blue lines. Each such signal is highlighted as a green (buy) or red (sell) dot on the plot. The size of the dot represents the strength of the signal. You can also check the position of green and red lines from each other to determine the trend direction and the place where it has been changed. The Excellent ADX indicator helps you there too. It highlights the trend direction by the background-color, so you'll never miss it! The Excellent ADX good compliance with the Price Channel indicator built for the same length. You can use them together to be on a trend wave always!

EMA Pullback StudyA colored EMA (period can be chosen via inputs).
A signal is generated on the first price touch of the EMA following the price floating above or below it for several bars.
- If EMA is green and a green up arrow appears (price touch), look for buys.
- If EMA is red and a red down arrow appears look for sells.
Can be used with a longer period MA to confirm overall direction, MTF, chop zone, etc.
May wish to enter on the signal, or wait for price to turn back in direction of the trend.
Still in development!
