Range Breakout Statistics [Honestcowboy]
⯁ Overview
The Range Breakout Statistics uses a very simple system to detect ranges/consolidating markets. The principle is simple, it looks for areas where the slope of a moving average is flat compared to past values. If the moving average is flat for X amount of bars that's a range and it will draw a box.
The statistics part of the script is a bit more complicated. The aim of this script is to expand analysis of trading signals in a different way than a regular backtest. It also highlights the polyline tool, one of my favorite drawing tools on the tradingview platform.
⯁ Statistics Methods
The script has 2 different modes of analyzing a trading signals strength/robustness. It will do that for 2 signals native to the script.
Upper breakout: first price breakout at top of box, before max bars (100 bars by default)
Lower breakout: first price breakout at bottom of box, before max bars
The analysis methods themselves are straightforward and it should be possible for tradingview community to expand this type of analysis to other trading signals. This script is a demo for this analysis, yet some might still find the native signals helpful in their trading, that's why the script includes alerts for the 2 native signals. I've also added a setting to disable any data gathering, which makes script run faster if you want to automate it.
For both of the analysis methods it uses the same data, just with different calculations and drawing methods. The data set is all past price action reactions to the signals saved in a matrix. Below a chart for explaining this visually.
⯁ Method 1: Averages Projection
The idea behind this is that just showing all price action that happened after signal does not give actionable insights. It's more a spaghetti jumble mess of price action lines. So instead the script averages the data out using 3 different approaches, all selectable in the settings menu.
Geometric Average: useful as it accurately reflects compound returns over time, smoothing out the impact of large gains or losses. Accounts for volatility drift.
Arithmetic Average: a standard average calculation, can be misleading in trading due to volatility drift. It is the most basic form of averaging so I included it.
Median: useful as any big volatility huge moves after a signal does not really impact the mean as it's just the middle value of all values.
These averages are the 2 lines you will find in the middle of the projection. Having a clear difference between a lower break average and upper break average price reaction can signal significance of the trading signal instead of pure chaos.
Outside of this I also included calculations for the maximum and minimum values in the dataset. This is useful for seeing price reactions range to the signal, showing extreme losses or wins are possible. For this range I also included 2 matrices of highs and lows data. This makes it possible to draw a band between the range based on closing price and the one using high/low data.
Below is a visualisation of how the averages data is shown on chart.
⯁ Method 2: Equity Simulation
This method will feel closer to home for traders as it more closely resembles a backtest. It does not include any commissions however and also is just a visualisation of price reaction to a signal. This method will simulate what would happen if you would buy at the breakout point and hold the trade for X amount of bars. With 0 being sell at same bar close. To test robustness I've given the option to visualise Equity simulation not just for 1 simulation but a bunch of simulations.
On default settings it will draw the simulations for 0 bars holding all the way to 10 bars holding. The idea behind it is to check how stable the effect is, to have further confirmation of the significance of the signal. If price simulation line moves up on average for 0 bars all the way to 10 bars holding time that means the signal is steady.
Below is a visualisation of the Equity Simulation.
⯁ Signal filtering
For the boxes themselves where breakouts come from I've included a simple filter based on the size of the box in ATR or %. This will filter out all the boxes that are larger top to bottom than the ATR or % value you setup.
⯁ Coloring of Script
The script includes 5 color themes, each carefully created using color themes from the pantone color institute. There are no color settings or other visual settings in the script, the script themes are simple and always have colors that work well together. Equity simulation uses a gradient based on lightness to color the different lines so it's easier to differentiate them while still upper breaks having a different color than lower breaks.
This script is not created to be used in conjunction with other scripts, it will force you into a background color that matches the theme. It's purpose is a research tool for systematic trading, to analyse signals in more depth.
Metaverse color theme:
⯁ Conclusion
I hope this script will help traders get a deeper understanding of how different assets react to their assets. It should be possible to convert this script into other signals if you know how to code on the platform. It is my intention to make more publications that include this type of analysis. It is especially useful when dealing with signals that do not happen often enough, so a regular backtest is not enough to test their significance.
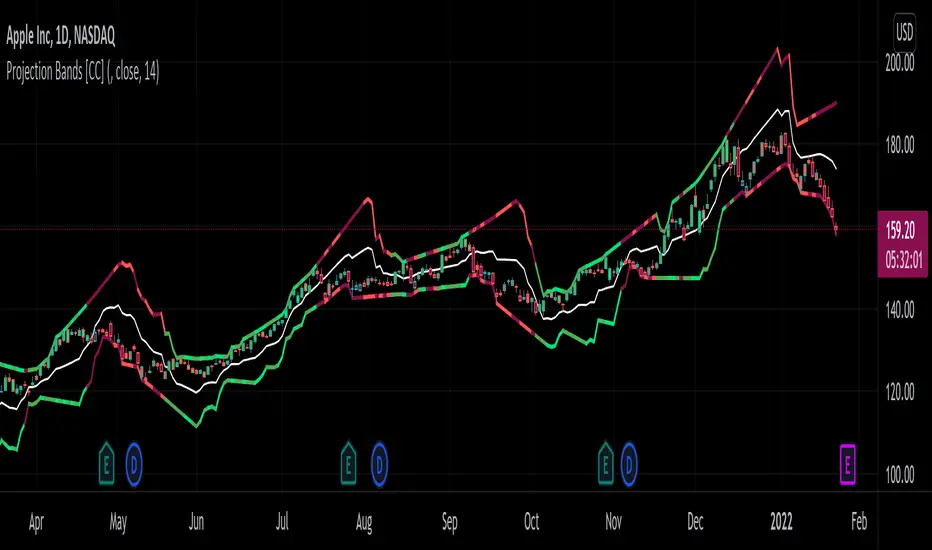
Projections

Average Daily Range ProjectionsCreates a trailing high and low projection based on the Average Daily Range.
Track the Session High and Low to determine the Daily Range.
Average the Daily Range by a fixed Period to create an Average Daily Range .
Track the Prior Daily Range .
Track the Current Daily Range .
Track the % of Range completion relative to the CDR & ADR(P).
From the Session Low, project an Average Daily Range High by adding the ADR.
From the Session High, project an Average Daily Range Low by subtracting the ADR.
When %R reaches 100% or greater, the ADR HI & LO will lock, showing the range break out or break down. As the Session High and Low create the Daily Range, observe the reaction of price as it reaches the limit of the expected daily range.
On strongly trending days, CDR is likely greater than PDR and ADR(P). Price can break away.
On ranging days, %R may fail to reach 100% and CDR may be lesser than PDR and ADR(P). Price can bounce around within the bounds of ADR HI & LO.

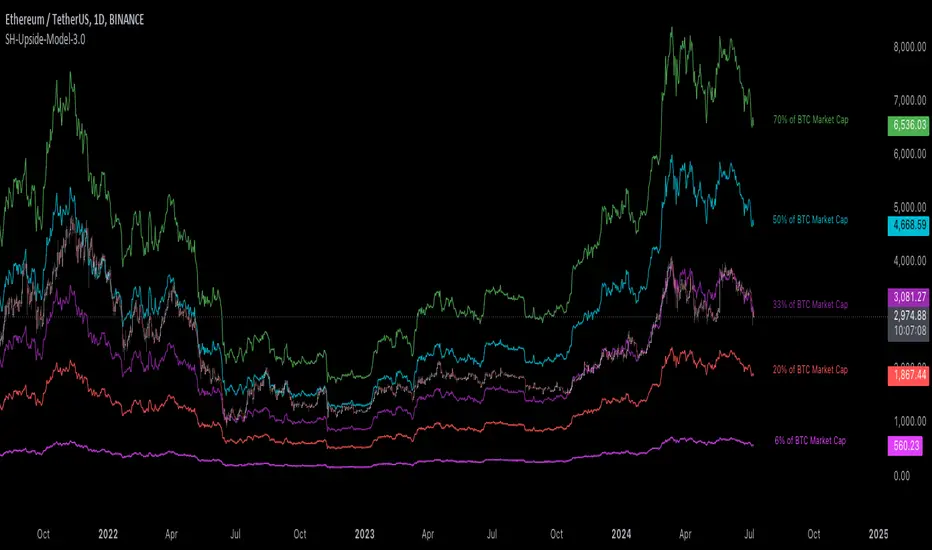
[Suitable Hope] Crypto Upside Model 3.0The "Crypto Upside Model 3.0" indicator dynamically calculates the potential price of any cryptocurrency based on various percentages of Ethereum or Bitcoin's market capitalization.
By fetching and analyzing marketcap data from TradingView sources, it allows traders to visualize potential price targets if their chosen cryptocurrency reaches specific market dominance levels. This tool is designed for daily timeframe analysis and can be used to set informed price expectations and strategic investment goals, providing valuable insights for long-term investment planning.
Why using the Crypto Upside Model 3.0?
Strategic Planning: Helps traders and investors set realistic price targets and investment goals by visualizing potential market cap scenarios.
Informed Decision-Making: Provides a data-driven approach to understanding how a cryptocurrency might perform relative to major assets like Bitcoin and Ethereum.
Customizable Analysis: Allows users to choose different comparison assets (ETH or BTC) and visualize various market cap dominance percentages, offering tailored insights.
Daily Timeframe Focus: Ideal for swing traders and long-term investors who operate on a daily analysis timeframe, providing relevant and actionable data.
Bull Markets: Identify potential price targets if your cryptocurrency's market cap increases significantly.
Bear Markets: Assess how much value could be retained relative to major cryptocurrencies.
Strategic Entry/Exit Points: Use the visualized targets to plan entry or exit points in your trading strategy.
Comparative Advantage
Dynamic Adaptation: Unlike fixed indicators, this tool adapts to any active chart, making it versatile for multiple cryptocurrencies.
Market Cap Insights: Provides a unique perspective by linking price targets to market cap dominance, a critical factor in the crypto market.
User Instructions
Setup: Add the " Upside Model 3.0" indicator to your TradingView chart.
Configuration: Use the input settings to select the comparison cryptocurrency (ETH or BTC) and enable the desired market cap percentage plots.
Analysis: The indicator will display potential price targets based on the selected market cap percentages, providing a visual guide for setting price expectations.
Limitations
Marketcap Data Availability: The indicator relies on marketcap data from TradingView, which may not be available for all cryptocurrencies. If the data is unavailable, the indicator will not function for that asset. This tool is more likely to work with older, established cryptocurrencies, as marketcap data for newer cryptocurrencies may not yet be available.
Daily Timeframe Restriction: The indicator is designed to work exclusively on the daily timeframe, limiting its applicability for intraday trading.
Assumptions of Market Dynamics: The calculations assume a direct correlation between market dominance and price, which may not account for other market dynamics and external factors influencing prices.
Data Accuracy: The accuracy of the indicator depends on the reliability of the data provided by TradingView, which may sometimes experience delays or inaccuracies.
Currently available cryptocurrencies: Bitcoin, Ethereum, Solana, Binance Coin, Cardano, Ripple, Polkadot, Avalanche, Chainlink, Litecoin, Dogecoin, Terra, Uniswap, VeChain, Stellar, Internet Computer, Hedera, Filecoin, Monero, Aave, TRON, NEAR Protocol, Compound, Maker,... For all compatible cryptocurrencies, please consult CRYPTOCAP's documentation.
Final notes
Although various sources ask a payment or user data for similar kind of private indicators, this one is entirely free and open source. "Uncanny" isn't it? I hope this indicator will provide you value. Feel free to leave a message if you have any questions or constructive feedback.
Examples of how I use this indicator
When using ETH's historical price as a reference compared to Bitcoin's marketcap, we can notice that price generally has been held between the +-30% and 50% lines of BTC's marketcap. If history is repeating again, we can expect major resistances around the 50% looking ahead into the future. This for me would be a great area to potentially reduce my ETH spot position.
When using SOL's historical price action, we can notice that the 15% line of ETH's marketcap has been a top in the previous cycle. Today SOL (July 2024), is back at this level. Could this be a top again or could price break this 15% level and head perhaps towards 30% which currently sits around $260? Time will tell.
These are 2 simple example of how I interpret the data. I'm keen to hear what other findings with other pairs you can find.
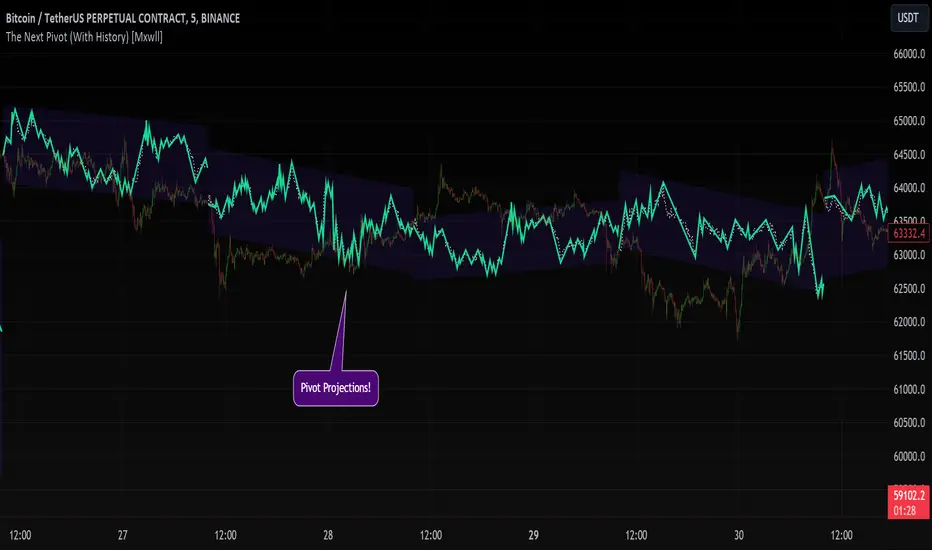
The Next Pivot (With History) [Mxwll]Introducing "The Next Pivot (With History)"!
With permission from the author @KioseffTrading
The script "The Next Pivot" has been restructured to show historical projections!
Features
Find the most similar price sequence per time frame change.
Forecast almost any public indicator! Not just price!
Forecast any session i.e. 4Hr, 1Hr, 15m, 1D, 1W
Forecast ZigZag for any session
Spearmen
Pearson
Absolute Difference
Cosine Similarity
Mean Squared Error
Kendall
Forecasted linear regression channel
The image above shows/explains some of the indicator's capabilities!
Additionally, you can project almost any indicator!
Should load times permit it, the script can search all bar history for a correlating sequence. This won't always be possible, contingent on the forecast length, correlation length, and the number of bars on the chart.
If a load time error occurs, simple reduce the "Bars Back To Search" parameter!
The script can only draw 500 bars into the future. For whatever time frame you are on and the session you wish to project, ensure it will not exceeded a 500-bar forecast!
Reasonable Assessment
The script uses various similarity measures to find the "most similar" price sequence to what's currently happening. Once found, the subsequent price move (to the most similar sequence) is recorded and projected forward.
So,
1: Script finds most similar price sequence
2: Script takes what happened after and projects forward
While this may be useful, the projection is simply the reaction to a possible one-off "similarity" to what's currently happening. Random fluctuations are likely and, if occurring, similarities between the current price sequence and the "most similar" sequence are plausibly coincidental.
Thanks!
London Killzone + Deviations[MK]For traders that use the London Killzone session high/low to project possible take profit targets.
The indicator will determine the current day London killzone high and low range and draw a range box to the right of the last candle on the chart. Drawing to the right of the chart keeps the workspace cleaner.
The high/low range is then used to project Standard Deviation levels above and below the London range.
Levels projected are +/- 1, 2, 2.5, 3, 4.
Users of the script should conduct proper backtesting using a large data range before applying to live accounts.

Cycles: 4x dual inputs: Swing / Time Cycles projected forward//Purpose/Premise:
To project forward vertical 'cycle' lines based on user-input anchor points, and to search for confluence.
The idea being that if several well-anchored cycles agree (i.e. we see multiple bunched vertical line confluence in the future), then this may add support to an already existing trade idea, or may indicate an increased likelihood of a shift in direction.
//Usage & notes:
~In the above chart I've anchored to obvious swing lows and swing highs in Btc/Usd from 2020-2022. You could also use fixed time-based cycles from a favored start anchor point. Bars per cycle are printed at the top of each cycle box if your're interested in time cycles. I.e. for 1, 2, 3 month cycles: for BTC you could use 30, 60, 90 bars on daily; for S&P you could use 20, 40, 60 bars on daily.
~On first loading the indicator you will be asked select 'start date', and 'end date' for each of 4 sessions (8x clicks on chart). After this you can easily reset points by clicking the indicator display line three dots>> reset points. Or you can simply drag the vertical box edges (purple lines) to change your cycle anchor points.
~Be sure the start anchor point is before the end anchor point or box/lines won't appear.
~When you drop down to low timeframes you might get bar_index error due to history available: you need then to click the three dots on indicator display line >> reset points >> 8x clicks on the chart.
~Vertical projected lines will match the color of the cycle box they origninate from.
~Lines will project into the future as far as is allowed by tradingview (500 bars max)
//Inputs:
~Time start and end dates for each cycle (change these as described above, or input manually)
~Show/hide each cycle (default is show all 4)
~Formatting options: color of forward projected lines, line width, line style, line / box / text color.
~Box transparancy: Set to 100 to make boxes invisible & declutter the chart. Set to 0 for maximum opacity. Default is 80.
thanks to @Sathyamurthie for his ideas on cycle confluence which caused me to write this.

Feigenbaum ProjectionsThe theory of price delivery per Feigenbaum projections is credited to TRSTNGLRD, this indicator aims to aid traders from all backgrounds to utilize projections for determination of potential future price moves.
What follows is the simplest description of where to anchor the projection:
As price delivers and clears higher high (buy side liquidity) then reverses to clear most recent low (sell side liquidity), this becomes the anchorage point for the Feigenbaum projection and is referred to as perturbation. The start and end points for the projection should be only those candle bodies that wholly exist within the range within the high and low that were cleared by the perturbation, this range of candle bodies is to be considered the "initial condition". Structure that appears as a broadening formation is one such price delivery occurrence that can be utilized with these projections.
The projected zones are all pre-configured by TRSTNs specifications per Feigenbaum but can be adjusted if the need arises.
Price is expected to expand beyond the initial condition and into the negative and positive target zones, accuracy diminishes with further expansion and reevaluation should occur when a new perturbation is discovered.
It's recommended to explore various timeframes to find a perturbation by which to anchor the next Feigenbaum projection.
I'll do my best to update this description with time as more discoveries are made and TRSTNGLRD provides more guidance and feedback on this indicator.

Range Projections [TFO]The purpose of this indicator is to see how often price reached certain standard deviations from a selected time range. The inspiration for this was to study ICT (Inner Circle Trader) concepts regarding the Central Bank Dealer’s Range (CBDR), which is 2:00 pm - 8:00 pm New York local time according to ICT Core Content. However, the idea and data collection could certainly be applied to any range of time.
The main settings of this indicator are session time, range type, and the standard deviation filter. The session time is the window of price that will be utilized for range projections. The range type can be either body or wick (on the current timeframe). The standard deviation filter is used to eliminate sessions whose ranges (from high to low) are greater than the desired/input number of standard deviations from all available session ranges.
In this example, the time range is set to 16:00 - 20:00, or the time between the New York session close and the Asia session open. Our standard deviations are set to 1, 2, 2.5, and 4. Now, by taking this session’s price range and extrapolating these extensions from the initial range, we can use these levels to see if and how price interacts with them before the next 16:00 - 20:00 session.
Furthermore, we can enable the Data Table to analyze how often price trades to these levels for the sessions that are deemed valid (determined by the standard deviation filter). This time our standard deviations are set to 1, 2, 3, and 4.
This concept can theoretically be applied to any window of time. ICT has mentioned that, in instances where the CBDR is too large, the Asia range may be used instead. We can observe that the indicator behaves the same way when we change the session to the Asia range, 20:00 - 00:00.

Leavitt Projection [CC]The Leavitt Projection indicator was created by Jay Leavitt (Stocks and Commodities Oct 2019, page 11), who is most well known for creating the Volume-Weighted Average Price indicator. This indicator is very simple but is also the building block of many other indicators, so I'm starting with the publication of this one. Since this is the first in a series I will be publishing, keep in mind that the concepts introduced in this script will be the same across the entire series. The recommended strategy for how to trade with these indicators is to plot a fast version and a slow version and go long when the fast version crosses over the slow version or to go short when the fast version crosses under the slow version. I have color coded the lines to turn light green for a normal buy signal or dark green for a strong buy signal and light red for a normal sell signal, and dark red for a strong sell signal.
I know many of you have wondered where I have been, and my personal life has become super hectic. I was recently hired full-time by TradingView, and my wife is pregnant with twins, and she is due in a few months. I will do my absolute best to get back to posting scripts regularly, but I will post a bunch today in the meantime to fulfill a special request from one of my loyal followers (@ashok1961).

Projection Oscillator [CC]The Projection Oscillator was created by Mel Widner (Stocks and Commodities Jul 1995) and this is another hidden gem that is of course a great complementary indicator to my previous Projection Bands . I would recommend to use both on the same chart so you get the full array of information. This indicator tells you where the current price falls between the bands and the higher the oscillator is, the closer the price is to the upper band and vice versa. Now since the price never falls outside of the bands, the indicator is limited from 0 to 100. You will notice that with this indicator it gives even earlier signals than the Projection Bands so a very useful indicator indeed. I have included strong buy and sell signals in addition to normal ones so strong signals are darker in color and normal signals are lighter in color. Buy when the line turns green and sell when it turns red.
Let me know if there are any other indicators or scripts you would like to see me publish!
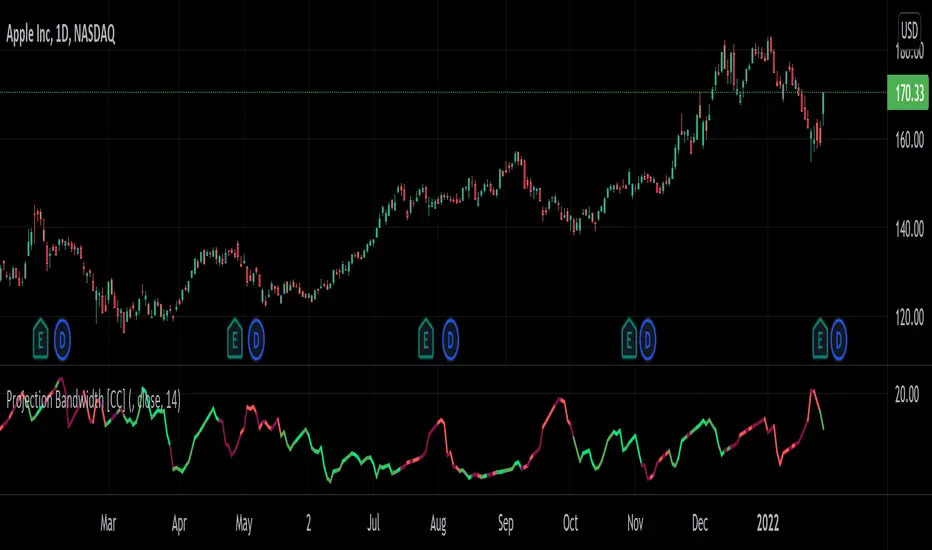
Projection Bandwidth [CC]The Projection Bandwidth was created by Mel Widner (Stocks and Commodities Jul 1995) and this is another of my series of indicators that I consider undiscovered gems. For those of you who are unaware, the Bandwidth indicator measures the distance between the high and low bands and if you remember from my Projection Bands script, the Projection Bands give pretty accurate early signals of trend reversals and followed fairly closely by a large bulge in the bands. The large bulges in the bands essentially act as the confirmation that the trend reversal is happening and so that brings me to this indicator. This indicator gives signals based on if it has reached a peak or a valley. Both extremes mean that the current trend is ending and I have color coded it based on the buy and sell signals from my Projection Bands indicator. I have included strong buy and sell signals in addition to normal ones so strong signals are darker in color and normal signals are lighter in color. Buy when the line turns green and sell when it turns red.
Let me know if there are any other scripts or indicators you would like to see me publish!
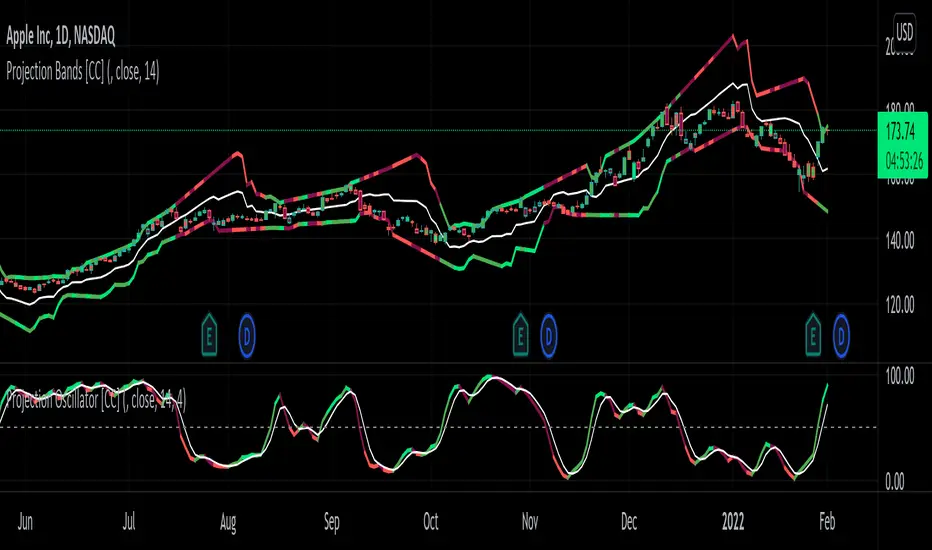
Projection Bands [CC]The Projection Bands were created by Mel Widner (Stocks and Commodities Jul 1995) and this indicator and the other two that rely on this one (I will publish them later) are very underappreciated in my humble opinion. The biggest strength of this indicator is the fact that it is a leading indicator for dramatic price movements. As you can see in my example chart it consistently gives great exit points before a downturn. I have included strong buy and sell signals in addition to normal ones so strong signals are darker in color and normal signals are lighter in color. Buy when the line turns green and sell when it turns red.
Let me know if there are any other indicators or scripts you would like to see me publish!
Daily Play Ace SpectrumSo the idea of the Daily Play Ace Spectrum is to extend the Ace Spectrum .
By exposing more parameters, making a variation of the Ace Spectrum which is more configurable.
The idea is this makes the Daily Play Ace Spectrum more suitable for use on shorter (hourly and minute) time scales.
These specific parameters exposed still maintain the original form of the original Ace Spectrum, but loosen up the hard coded assumptions of the original indicator.
By exposing more parameters this now makes the Daily Ace Spectrum more sensitive to input.
Meaning the parameters you choose are important and will set the characteristic reaction of the indicator to the series you give it.
This presents a trade-off, the simplicity of the original indicator is sacrificed.
But what's gained is a more comprehensive indicator that now needs more careful parameter adjustment .
Related to the Ace Spectrum:

ProjectionGreetings Traders! I have decided to release a few scripts as open-source as I'm sure others can benefit from them and perhaps make them better.(Be sure to check my Profile for the other scripts as well: www.tradingview.com).
This one is called Projection.
Projection is based off the same Principle as some of my other scripts, such as Trade Manager() and Price Predictor(). I use a simple concept using line.new() to define some potential Price Projections. From the Settings of the Indicator, you can access a couple different Pre-Set options.
Wide Parabola:
Skinny Parabola:
Straight Triangle:
ZigZag1:
ZigZag2:
I wanted to give a Special Thanks to @Pinecoders for the custom RoundToTick Function from Backtesting/Trading Engine --> ()
If you like Projection, be sure to Like, Follow, and if you have any questions, don't be afraid to drop a comment below.

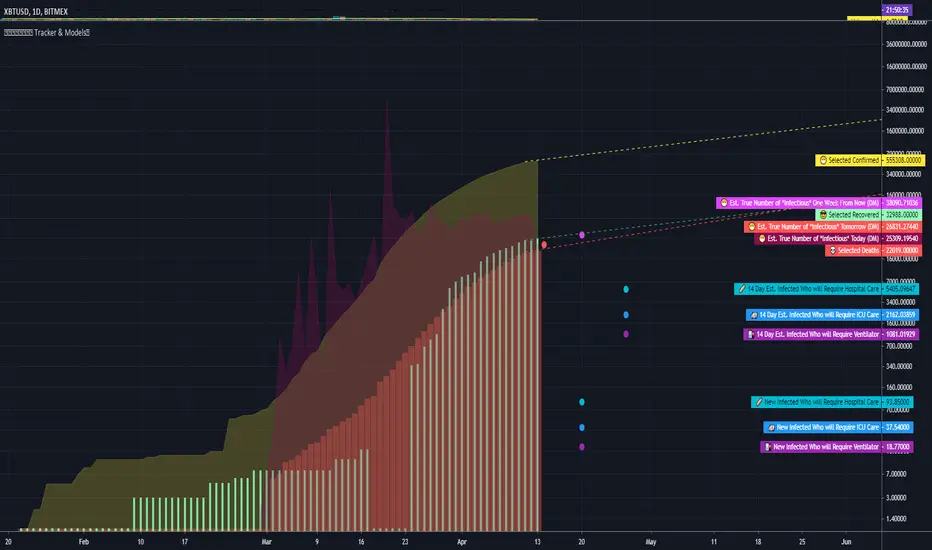
COVID Statistics Tracker & Model Projections by Cryptorhythms😷 COVID-19 Coronavirus Tracker & Statistics Tools by Cryptorhythms 😷
📜Intro
I wanted to put some more meaning behind the numbers for 2020's Covid pandemic. I hope this tool can help people analyze and deal with these hard times. With these metrics I hope to give greater depth and dimension to whats available. While also at the same time creating something that looks decently presentable and gives actionable information.
I had planned on including a few forecasting models and letting the user play with values to see how social distancing works. But alas I couldnt complete those in the scope of time I gave myself for the indicator. If you are interested in collaborating on it, I will share what I have with you and we can further work on it.
📋Description
The script contains 3 main parts you will interact with. I suggest you enable the chart labels for "indicator name" and "indicator last value" to make the charts more readable (right click on the scale of your chart and goto the "labels" pop out menu). Depending on what plots and data you choose to chart, logarithmic and regular scales can both be applied in different situations. To get similar visuals to the examples I will show below, you can goto the indicator options > style tab. I then play with the line styles, colors and transparencies to achieve the nice looking charts. Please also note there is a distinction between "Infected" and "Infectious". A model telling you the number of infected doesnt designate whether that person can still pass the virus on to others (infectious). So Infectious numbers are usually lower than total confirmed, but this isnt always the case if for example a country wasnt testing very much during the early phase or something else.
🚧Disclaimer
I am not a medical professional and none of this should be considered medical advice. All of the models, numbers and math I sourced from professional places but this is not a guarantee of the future only an approximation based on current information. Numbers change daily and so can these models!
🌐PART ONE
In this area you select a region to read the proper statistics data from tradingview. You can do global totals, country totals, or for a few places (AU, CA, CN, US) you can see state/province totals. Remember to SELECT ONLY ONE region.
🧮PART TWO
The Plots/Stats/Data section includes:
1. ) Plot the Days to Double Number of Confirmed
2. ) Plot the Infection Growth Ratio
3. ) Plot Fatality Risk Rate (Total Deaths / Total Outcomes)
4. ) Plot Overall Fatality Rate / Recovery Rate
5. ) Plot % of World Infected & % of USA Infected
6. ) Plot Daily New Deaths, Confirmed & Recovered
7. ) Plot Daily Change Percentages
🎱PART THREE
Forecasting Models and Settings:
1 .) Plot the % of Custom Population Infected (Vs. the Region Selected in Part 1 of Settings)
2 .) Plot the True Num. of Infectious (Death Model / DM)
3 .) Plot the Current and Next Weeks Cumulative Infection Projection (DM)
4 .) Plot Estimated Infection Rates? (DM)
5 .) Enable Basic Trajectory Projection?
6 .) Plot the Likelihood of > 0 **Infectious** in a Group (DM) for Today, Tomorrow and Next Week
7 .) Plot the True Num. of Infected (Confirmed/Tested Model)
8 .) Plot the Estimated Epidemiology for 7 and 14 Days Out (Hospital Beds, ICU Beds, Ventilator Units)
Planned But not completed
9.) SIR Epidemiology Model
10.) Exponential Growth Plot & Correlation
To use the Estimator for likelihood of Infected in N group of people you need to do 2 things. Select and use "Custom Population" as the population source for part 3. Then you need to enable "Custom Infected" as the source for the model. Then you enter your geographical area's population and confirmed cases. Its best to goto the smallest / most granular level of data available to accurately estimate the likelihood. So for instance in the order of least effective to most effective data source: global, country, state, county, city...etc.
If you do not understand what these terms or numbers represent, please read the source materials I have linked in the code, or use google. I dont have the time or expertise to explain all the various specific methods and terms included here. This entire project was a learning journey for me and I have zero experience in epidemiology so please excuse any errors I may have made. (and tell me, so I can change it!)
🔮Future Additions
If anyone has a model or stat they would like included I will be happy to add your code to this toolbox to make it more effective and give you credit here in the description. If you want to collaborate please message me.
📊Some Example Charts:
The Cryptorhythms Team wish you and your families all the absolute best of health!
P.S. Stay safe and act smart I dont think this will be the EOTW.
Bitcoin Logarithmic Growth Curves & ZonesI found this awesome script from @quantadelic and edited it to be a bit more legible for regular use, including coloured zones and removing the intercept / slope values as variables, to leave space for the fib levels in the indicator display. I hope you all like it.
