Volume Matrix Pro [ChartNation]Volume Matrix Pro is a comprehensive volume profile indicator that combines delta-colored volume distribution analysis with adaptive pivot detection and automated volume node identification. The indicator visualizes where institutional volume accumulated at specific price levels, providing traders with precise entry zones backed by actual trading data.
KEY FEATURES:
Delta-Colored Volume Profile: Displays volume distribution across price bins with automatic delta coloring - green bins show buyer dominance, red bins show seller control at each price level
High Volume Nodes (HVN) Detection: Automatically identifies and marks price levels with ≥80% of POC volume using yellow diamond markers - these act as magnetic support/resistance zones where institutions built positions
Low Volume Nodes (LVN) Detection: Marks thin volume areas with gray diamond markers - zones where price moves quickly with minimal friction, ideal for breakout targets
Adaptive Smart Pivots: ATR-based pivot detection that automatically adjusts length based on market volatility - catches more swings in low volatility, filters to major reversals in high volatility
Point of Control (POC) Line: Identifies the price level with maximum traded volume - the market's center of gravity. Line colors by delta: green when buyers dominated, red when sellers controlled the level
Value Area Lines: Dotted lines marking the 70% value area (configurable 50-98%) with delta-based coloring showing cumulative buyer/seller pressure within the range
Circle Pivot Markers: Clean visual markers at confirmed pivot points with translucent horizontal lines extending to current bar
Extend-Until-Touch: Pivot lines automatically retract when price touches them, keeping charts clean and showing active levels only
Dual Profile Modes: Left-side profile (default) or right-pinned bars ahead of price with fully customizable width and padding
Volume-Filtered Pivots: Only displays pivots with significant volume backing (≥20% of POC by default) - institutional turning points, not noise
HOW IT WORKS:
The indicator divides the lookback range (default 200 bars) into volume bins (default 50) and calculates total volume and delta (buying vs selling pressure) at each price level. Each bin is colored green if buyers dominated (close > open majority) or red if sellers controlled (close < open majority).
High Volume Nodes mark price levels where the most trading occurred - these become magnetic support/resistance zones. The Point of Control identifies the single price with maximum volume, acting as the market's gravitational center.
Smart Pivots use ATR to adapt to changing volatility, then filter against the volume profile. Only pivots with substantial volume backing are displayed, ensuring you see institutional turning points, not random noise.
RECOMMENDED SETTINGS:
Scalping (1-5 min): 100 lookback bars, 40 bins, 5-7 pivot length
Day Trading (15 min - 1 hour): 200 lookback bars, 50 bins, 10 pivot length (default)
Swing Trading (4 hour - Daily): 300-500 lookback bars, 60 bins, 15-20 pivot length
USAGE TIPS:
Enter long when price touches green HVN zones with adaptive pivot confirmation
Enter short when price reaches red HVN zones with pivot confirmation
Use POC as first target when entering below it, or as support backup when entering above
Watch for LVN zones as potential breakout acceleration areas
Combine green delta bins + HVN + pivot for highest-probability setups
WHAT MAKES THIS DIFFERENT:
Unlike traditional volume profiles, Volume Matrix Pro colors each bin individually by delta, giving granular insight into buyer/seller control at every price level. The adaptive pivot system adjusts automatically to volatility, while volume-filtering ensures only institutionally-backed turning points are displayed. High/Low Volume Node detection is fully automated with visual markers.
IMPORTANT NOTES:
This is a volume analysis tool - use with trend analysis and risk management
High Volume Nodes show where volume accumulated historically, not future support/resistance guarantees
Adaptive pivots adjust to volatility automatically but can still produce false signals in choppy markets
Best used as confirmation alongside price action, not as a standalone system
Profile recalculates on each bar to reflect current lookback range
POC

Volume Dynamics Pro [ChartNation]Volume Dynamics Pro by ChartNation is an advanced volume profile indicator that visualizes volume distribution across price levels using a proprietary mirrored butterfly design. The indicator identifies high-volume nodes (areas of significant trading activity) and the Point of Control (POC) - the price level with the highest traded volume within the lookback period.
KEY FEATURES:
Dynamic Volume Profile: Displays volume distribution across 25 price bins with a mirrored butterfly visualization that extends into future bars for forward-looking analysis
Point of Control (POC): Automatically identifies and highlights the price level with maximum volume, featuring a pulsing animation and optional price label with customizable positioning
Multiple Anchoring Modes: Choose between Rolling, Daily, Weekly, Monthly, or Session-based profile calculations to match your trading timeframe
Smart Range Calculation: Three range modes (Fixed Lookback, Hybrid Smart, Percentage-Based) automatically adjust the volume profile range based on recent price action
Volume-Responsive Visualization: Line thickness and glow intensity scale with volume magnitude, making high-volume areas immediately visible
Premium Statistics Box: Real-time display of POC price, total volume, range metrics, and price position relative to POC
Advanced Alert System: Configurable alerts for POC crosses, range breakouts, high-volume zone entries, and volume spikes
Professional Styling: Volume-based line styles (solid/dashed/dotted), gradient bias coloring (support/resistance), dual-tone depth borders, and customizable glow effects
HOW IT WORKS:
The indicator divides the price range into 25 bins and calculates total volume traded at each level. The mirrored butterfly profile displays this distribution, with wider sections indicating higher volume. The POC line marks the price with maximum activity - a critical level often acting as support or resistance.
Volume traces are color-coded: green tint below current price (potential support), red tint above (potential resistance). The intensity of coloring increases as price approaches each level, helping traders identify nearby high-volume zones.
USE CASES:
Identify institutional order flow and accumulation/distribution zones
Locate high-probability support and resistance levels based on actual trading activity
Track POC shifts to understand changing market structure
Confirm breakout validity by analyzing volume at key price levels
Optimize entry/exit points around high-volume nodes
SETTINGS OVERVIEW:
The indicator offers extensive customization across multiple groups: POC styling and extensions, statistics box display, profile anchoring, range calculation modes, alert configuration, line styles, volume-proportional thickness, gradient bias, glow system, depth borders, POC pulse animation, and volume profile display parameters.

POC Lines (Daily / Weekly / Monthly)This indicator plots the Point of Control (POC) on your chart for three key timeframes — daily, weekly, and monthly. The POC is the price level at which the highest trading volume occurred during a given period, highlighting where market participants were most active.
How to Trade Using the Daily / Weekly / Monthly POC Indicator
Identify Market Bias
Use the monthly POC as a major structural reference. If price is above the monthly POC, bias may be bullish; below it may signal caution or potential bearish bias.
Use the weekly POC for intermediate trend context. Price respecting the weekly POC can enhance confidence in direction.
Use the daily POC for fine-tuning entries, exits or intraday structure.
Use POC as Support/Resistance Zones
When price approaches a POC from above, the level can act as support — look for bullish reversal signals.
When price approaches a POC from below, it can act as resistance — look for bearish rejection setups.
If price breaks through a POC convincingly (with strong volume or momentum), then the level may flip: the broken POC becomes a new reference zone for opposite side trades.
Timeframe Confluence = Higher Probability
A trade setup is stronger when the daily, weekly, and monthly POCs align or cluster near the same price zone. This confluence raises the chance that price will react.
Conversely, avoid setups where the POCs are widely scattered across timeframes — these have less structural weight.
Entry, Stop & Target Strategy
Entry: Enter once price touches a significant POC level and shows confirmation (e.g., candlestick reversal, volume spike, or confluence with other level).
Stop-Loss: Place stop just beyond the POC level (for support trades, slightly below; for resistance trades, slightly above).
Target: Use the next major POC or price structure level (previous high/low, value area edges) as your initial target. If price moves through the POC, target a breakout to the next structural zone.
Be patient — price may test a POC level multiple times or ignore it entirely before reacting.
Use the POC indicator as a guiding framework, not a guarantee. Combine with other tools (trend direction, price action, volume, market context) to refine your execution.

POC Volume Bar (Highest Volume in Range)What the highlighted POC bar means
🔶 1. Institutional interest
A POC often identifies where big money stepped in.
🔶 2. Support or resistance pivot
Large volume often signals:
• A reversal
• A breakout
• Or the beginning of a trend
🔶 3. Liquidity magnet
Price tends to revisit high-volume bars.
They act like magnets.
🔶 4. Trend confirmation or exhaustion
High volume on:
• Green candle → bullish participation
• Red candle → distribution / aggressive selling

Balanced Delta Volume Profile (Zeiierman)█ Overview
Balanced Delta Volume Profile (Zeiierman) builds a vertical, price-by-price profile that blends total participation with balance quality. Instead of plotting raw volume alone, it weights each price bin by:
how balanced buyers vs. sellers were,
how compressed price was inside that bin,
how often price revisited it.
The result spotlights fair value and acceptance zones while still revealing momentum/imbalance areas—ideal for reading rotation vs. trend, continuation vs. exhaustion, and the prices that truly matter.
Highlights
Balanced score that fuses delta symmetry, price compression, and hit frequency.
Optional heat spectrum for instant read of participation density and balance strength.
POC-like auto highlight of the dominant price level within the lookback window.
Works across timeframes for session profiling, swing context, or regime shifts.
█ How It Works
⚪ Profile Construction
The script scans a fixed History Length and divides the full high–low span into Bin Count price bins. For every bar in the window, its volume is proportionally distributed across the bins it overlaps, so wide-range bars contribute across multiple bins, while narrow bars concentrate where they traded most. This yields per-bin totals for:
Total Volume (participation)
Positive / Negative Volume (up vs. down bar contribution)
Hit Count (how often price touched the bin)
Average Price Range (mean bar range inside the bin; a proxy for compression)
⚪ Delta & Direction
For each bin, delta symmetry is measured via the ratio of |pos − neg| to total volume. Bins with balanced two-sided flow score higher than one-sided, runaway bins. This curbs the tendency of raw volume profiles to over-reward impulsive bursts.
⚪ Balance Score
Each price bin gets a balance score that multiplies three normalized components:
Delta Balance: rewards bins where buy/sell pressure is symmetrical (configurable via Volume Momentum Weight).
Price Compression: rewards bins where average bar range is relatively small (configurable via Price Momentum Weight).
Durability: rewards bins revisited often (configurable via Hits Weight).
A Min Hits Filter removes flimsy, single-touch bins from dominating the score. The profile can display pure totals or Average Mode (Vol/Hit) to compare bins fairly when hit counts differ.
⚪ Display & Heat Spectrum
The final plotted bar length per bin is the display volume (total or average) weighted by the balance score and normalized to 100.
POC-like Highlight: The 100% bin is outlined (and labeled) when Highlight Max Volume Bin is ON.
Heat Spectrum (optional): A background gradient scales with normalized bar length and balance hue.
Balance Hue: Interpolates between Balance Low/High Colors so high-balance bins visually pop as “accepted value.”
█ How to Use
The profile is effectively a map of price acceptance:
High, bright bars = strong participation at balanced prices → fair value/rotation zones.
Thin, muted bars = poor acceptance → imbalance or transition areas.
POC-style level = most influential price in the lookback window.
⚪ Find Fair Value & Acceptance
Thick, high-balance bins mark value. Expect rotation: price often revisits or oscillates around these areas. They’re prime zones for mean-reversion fades, scale-ins, and risk-defined trades against the edges.
⚪ Identify Imbalance & Funnels
Low-balance, low-hit bins often act like air pockets—price can move through them quickly. These zones are helpful for continuation trades into thin areas or for timing breakout pulls back into acceptance.
⚪ POC Dynamics
When price leaves the POC and returns, watch for re-acceptance (price comes back into the POC or high-balance zone and stays there.) vs. rejection (trend continuation away from value). The auto-highlight makes this quick to judge.
█ Settings
History Length – Bars scanned for the profile. Longer = broader context, slower to adapt.
Bin Count – Vertical resolution of bins between the window’s min and max price.
Display Shift – Offsets the rendering rightward for clarity.
Average Mode (Vol/Hit) – ON uses average volume per visit; OFF uses total volume.
Volume Momentum Weight – Emphasizes two-way flow; higher values favor balanced bins over one-sided deltas.
Price Momentum Weight – Emphasizes compression; higher values favor narrow-range, coiling price action.
Hits Weight – Rewards bins revisited often; higher values favor durable acceptance.
Min Hits Filter – Minimum visits a bin needs to qualify for the balance score.
Show Heat Spectrum – Background gradient for quick read of density and balance.
Highlight Max Volume Bin – Outline + raw volume label for the dominant bin.
Max Volume Color – Color used for that highlight.
Balance Low/High Colors – Gradient endpoints for balance hue across the profile.
-----------------
Disclaimer
The content provided in my scripts, indicators, ideas, algorithms, and systems is for educational and informational purposes only. It does not constitute financial advice, investment recommendations, or a solicitation to buy or sell any financial instruments. I will not accept liability for any loss or damage, including without limitation any loss of profit, which may arise directly or indirectly from the use of or reliance on such information.
All investments involve risk, and the past performance of a security, industry, sector, market, financial product, trading strategy, backtest, or individual's trading does not guarantee future results or returns. Investors are fully responsible for any investment decisions they make. Such decisions should be based solely on an evaluation of their financial circumstances, investment objectives, risk tolerance, and liquidity needs.

Key Levels - PDL/PDH/POCs/VAHs/VALs - ArchReactorPrevious Day High/Low
Previous Day VPOC
Current Week Monday High/Low
Previous Week High/Low
Previous Week VPOC
Previous Month High/Low
Prior Week POC
Prior Month POC
Prior Day, Week and Months VAHs and VALs

Project Pegasus SideMap • VRP Heatmap • Volume Node DetectionDescription CME_MINI:NQ1!
Project Pegasus – Volume SideMap V 1.0 builds a right-anchored horizontal volume heatmap silhouette, visualizing buy/sell participation per price level over any chosen lookback or visible range. It automatically detects Low-Volume Nodes (LVN), Medium-Volume Nodes (MVN), and High-Volume Nodes (HVN), while also marking Top Volume Peaks, POI Lines (Most-Touched Levels), and complete Value Area Levels (POC / VAH / VAL) including optional session highs/lows.
What’s Unique
Right-Fixed Rendering – All profile rows are anchored to the chart’s right edge, creating a consistent visual reference during live trading.
Gap-Free Silhouette – Each price row blends seamlessly with its neighbors, producing a clean and continuous volume shape.
Triple-Tier Node Detection (LVN / MVN / HVN) – Automatically highlights zones of rejection, transition, and acceptance based on relative volume strength.
Dynamic Binning System – Adapts to price range and lookback while preserving proportional per-row volume distribution.
POI Finder (Most Touches) – Highlights price rows that have been touched most frequently by bars (traffic clusters).
Top-N Peaks – Sorts and draws the strongest single-price clusters by total volume while respecting minimum spacing.
Integrated Value Area Metrics – Calculates and plots POC, VAH, and VAL with optional session High/Low markers.
Color Modes – Choose between heatmap intensity (volume-based) or buy/sell ratio blending for directional context.
Performance Optimized – Rebuilds only when structure changes, ensuring smooth operation even with large histories.
Technical Overview
1. Binning & Aggregation
The full price range is divided into a user-defined number of rows (bins) of equal height.
For each bar, traded volume is distributed across all intersecting bins proportionally to price overlap.
A buy/sell proxy is estimated based on candle close position, producing per-row Buy, Sell, and Total Volume arrays.
2. Silhouette Rendering
Each row’s strength = total volume ÷ maximum volume.
Two color modes:
• Volume Mode → intensity scales by relative volume (heatmap).
• Ratio Mode → blend between sell and buy base colors based on dominance (close position).
Weak or neutral rows can be faded or forced to minimum width via strength and ratio-deviation filters.
3. Node Detection (LVN / MVN / HVN)
Relative bands are defined by lower/upper % thresholds.
Consecutive rows meeting criteria are grouped into “bands.”
Optional gap-merge unifies nearby bands separated by small gaps (in ticks).
Quality filters:
• Min. Average in Band (%) → enforces minimum average participation.
• Min. Prominence vs. Neighbors (%) → compares contrast against adjacent volume peaks.
Enforces minimum center distance (in ticks) to prevent overlap.
Each valid band draws a Top/Bottom line pair and optional mid-label (LVN/MVN/HVN).
4. Volume Peaks
Ranks all rows by total volume (descending) and selects top N peaks with spacing filters.
Drawn as horizontal lines or labeled markers (P1, P2, etc.).
5. POI Lines (Most Touches)
During aggregation, each row counts how many bars overlap it.
The top X rows with highest touch counts are drawn as POI lines—often strong participation or mean-retest zones.
6. Value Area (POC / VAH / VAL)
POC = row with highest total volume.
Expands outward symmetrically until the configured Value Area % of total volume is covered.
VAH and VAL mark the acceptance range; optional High/Low lines outline total range boundaries.
7. Right-Fix Layout
All components are rendered relative to the chart’s rightmost bar.
Width dynamically scales with visible bars × % width setting, ensuring proportional scaling across zoom levels.
How to Use
Read market structure:
HVNs = high acceptance or balance areas → likely mean-reversion zones.
LVNs = thin participation → breakout or rejection points (“air pockets”).
MVNs = transition areas between acceptance and rejection.
Trade around POC / VAH / VAL:
These levels represent fair-value boundaries and rotational pivots.
POI & Peaks:
Use them as strong reference lines for responsive trading decisions.
Ratio-Color Mode:
Exposes directional imbalance and potential absorption zones visually.
Best practice:
Live trading → right-fix active, moderate row count.
Post-session analysis → higher granularity, LVN/HVN/MVN and peaks enabled with labels.
Key Settings
Core
Lookback length or visible-range mode
Row count (granularity)
Profile width (% of visible bars)
Right offset, minimum box width, transparency
Date Filter
Aggregate only bars from a defined start date onward.
Coloring
Buy/Sell ratio mode toggle
Base colors for buy and sell volume
Filters
Minimum ratio deviation (±) → ignore nearly balanced rows
Minimum volume strength (%) → fade weak rows
LVN / MVN / HVN Detection
Independent enable toggles
Lower/upper % thresholds
Minimum band height (rows)
Merge small gaps (ticks)
Minimum average in band (%)
Minimum prominence vs. neighbors (%)
Minimum distance between bands (ticks)
Line color, width, style, and label options
Peaks
Number of peaks (0–20)
Minimum distance between peaks (ticks)
Color, width, style, label placement
POI Lines
Enable toggle
POI count (1–5)
Minimum gap between POIs (rows)
Color, width, style, label offset
Value Levels (POC / VAH / VAL)
Show/hide Value Area Levels
Value Area % coverage
POC / VAH / VAL line styles, widths, colors
Optional Session High/Low lines
Notes & Limitations
Optimized for intraday and swing data; accuracy depends on chart volume granularity.
Large lookbacks with high row counts and all detection layers enabled may impact performance—adjust parameters for balance.
Buy/Sell ratio is a visual approximation based on candle structure, not actual order-book delta.
Designed as a contextual visualization tool, not a trade signal generator.
Disclaimer
For educational and informational purposes only.
Not financial advice.

Anchored Session Volume Profile • Heatmap Profiles • Asia/EU/US Description
This indicator builds Anchored Session Volume Profiles for Asia, EU, and US sessions on intraday charts and renders them as right-docked line histograms (heatmap or classic style). Each session computes its own POC, VAH, VAL and optional Session High/Low lines. An optional per-price-bin Delta overlay estimates buy/sell pressure inside the profile rows for quick order-flow context.
What’s unique
Three independent session anchors (Asia/EU/US) with custom start/end times, bin size in ticks, and Value Area %.
Right-fixed live rendering or post-close persistence (draw levels only after the session closes).
Adaptive width: profile width scales with elapsed session length (anchor → now/end) within user limits.
Heatmap profile: row tint scales by relative volume; or Classic single-color with optional gradient.
Per-row Delta ticks (outside/inside, configurable direction) derived from bar delta and overlap with each price bin.
Clean POC/VAH/VAL line styling, optional ray extension, and Session High/Low rays per session.
How it works (technical)
Binning: Rows are built with a user-defined bin height in ticks. Arrays expand/shrink as price extends; the base is shifted when new lows appear to keep bins aligned.
Accumulation: For each bar within the active session window, traded volume is distributed to intersecting bins proportionally to the price overlap with that bin.
Value Area: POC is the highest-volume bin. VA is grown symmetrically around the POC until the selected coverage (VA%) is reached.
Delta per bin (optional): A bar-level delta proxy volume * (close − open) / range (clamped) is split into buy/sell and allocated to bins proportionally to the same overlap share, producing a per-row delta magnitude for rendering ticks.
Rendering modes:
Right fixed: refreshes each bar; lines/histogram are docked at the anchor X-position.
Draw Levels after Session Close: on close, only POC/VAH/VAL (and optional Session High/Low) are persisted.
No lookahead: All computations use confirmed bars; levels are deterministic on close.
How to use
Use the Asia/EU/US profiles to read participation hand-offs and session-driven rotations.
Trade off POC/VAH/VAL as acceptance/rejection references; confluence with session High/Low often marks responsive flows.
Employ Delta ticks per row to spot absorption, one-sided stacking, or fading participation inside the profile without leaving TradingView.
Prefer right-fixed during live trading and post-close when you want persistent session levels.
Key settings
General per session: Start/End (hh:mm), Bin size (ticks), Value Area %, toggle POC/VAH/VAL lines.
Rendering: Heatmap vs. Classic, orientation (Left/Right), gradient on/off, row thickness, right offset, adaptive width limits.
Delta (per price bin): global on/off, per-session on/off, tick width, max tick length (bars), outside/inside placement, direction (sign-based / always left / always right), colors.
Levels: POC/VAH/VAL styles (solid/dashed/dotted), widths, colors, extend right (ray).
Session High/Low: per-session on/off, style, width, colors, optional right-ray extension.
Notes & limitations
Designed for intraday data; accuracy depends on the feed’s volume granularity.
Large histories + small bins + delta ticks can be heavy; tune bin size, adaptive width, and delta max length for performance.
Timezone for anchors is set internally to Europe/Berlin.
Educational tool — not a signal generator.
Disclaimer
For educational and informational purposes only. Not financial advice.

Fixed-Range Volume-Profile ZonesFixed Range Volume Profile Zones (with Dynamic Percentile Buffers)
This indicator calculates a fixed‑range volume profile over a user‑defined lookback period and identifies three key zones:
– VAL (Value Area Low)
– POC (Point of Control)
– VAH (Value Area High)
Volume is grouped into user‑selected price bins to create a profile of where the most trading activity occurred.
The script then splits the distribution into three zones and highlights the extremes (VAL/VAH) and the highest‑volume price (POC).
Dynamic Percentile Buffers
Instead of static offsets, this version computes the 10th and 90th percentile prices (user‑adjustable) of recent closes over the same lookback window.
These percentiles are used to create adaptive buffers above VAH and below VAL.
The buffers automatically expand or contract with market volatility and recent price distribution, filtering out weak or noisy touches.
Visual Elements:
– Green/orange/red horizontal lines = VAL / VAH / POC
– Green shading below VAL = buy zone
– Red shading above VAH = sell zone
– Down arrows above bars = closes above VAH + buffer
– Up arrows below bars = closes below VAL – buffer
Inputs:
– Lookback Days: number of bars used to build the profile
– Number of Bins: controls resolution of the volume profile
– VAH Percentile and VAL Percentile: choose which percentile levels to use for dynamic buffers
Use Cases:
– Quickly identify areas of high participation (POC) and potential support/resistance (VAL/VAH)
– Filter out weak breakouts using dynamic buffers
– Combine with other signals to improve entries/exits
⚠️ Disclaimer:
This script is for educational and informational purposes only.
It does not constitute financial advice or a recommendation to buy or sell any security.
Past performance or historical data does not guarantee future results.
Always perform your own analysis and use risk management when trading.

Volume Profile 3D (Zeiierman)█ Overview
Volume Profile 3D (Zeiierman) is a next-generation volume profile that renders market participation as a 3D-style profile directly on your chart. Instead of flat histograms, you get a depth-aware profile with parallax, gradient transparency, and bull/bear separation, so you can see where liquidity stacked up and how it shifted during the move.
Highlights:
3D visual effect with perspective and depth shading for clarity.
Bull/Bear separation to see whether up bars or down bars created the volume.
Flexible colors and gradients that highlight where the most significant trading activity took place.
This is a state-of-the-art volume profile — visually powerful, highly flexible, and unlike anything else available.
█ How It Works
⚪ Profile Construction
The price range (from highest to lowest) is divided into a number of levels (buckets). Each bar’s volume is added to the correct level, based on its average price. This builds a map of where trading volume was concentrated.
You can choose to:
Aggregate all volume at each level, or
Split bullish vs. bearish volume , slightly offset for clarity.
This creates a clear view of which price zones matter most to the market.
⚪ 3D Effect Creation
The unique part of this indicator is how the 3D projection is built. Each volume block’s width is scaled to its relative size, then tilted with a slope factor to create a depth effect.
maxVol = bins.bu.max() + bins.be.max()
width = math.max(1, math.floor(bucketVol / maxVol * ((bar_index - start) * mult)))
slope = -(step * dev) / ((bar_index - start) * (mult/2))
factor = math.pow(math.min(1.0, math.abs(slope) / step), .5)
width → determines how far the volume extends, based on relative strength.
slope → creates the angled projection for the 3D look.
factor → adjusts perspective to make deeper areas shrink naturally.
The result is a 3D-style volume profile where large areas pop forward and smaller areas fade back, giving you immediate visual context.
█ How to Use
⚪ Support & Resistance Zones (HVNs and Value Area)
Regions where a lot of volume traded tend to act like walls:
If price approaches a high-volume area from above, it may act as support.
From below, it may act as resistance.
Traders often enter or exit near these zones because they represent strong agreement among market participants.
⚪ POC Rejections & Mean Reversions
The Point of Control (POC) is the single price level with the highest volume in the profile.
When price returns to the POC and rejects it, that’s often a signal for reversal trades.
In ranging markets, price may bounce between edges of the Value Area and revert to POC.
⚪ Breakouts via Low-Volume Zones (LVNs)
Low volume areas (gaps in the profile) offer path of least resistance:
Price often moves quickly through these thin zones when momentum builds.
Use them to spot breakouts or continuation trades.
⚪ Directional Insight
Use the bull/bear separation to see whether buyers or sellers dominated at key levels.
█ Settings
Use Active Chart – Profile updates with visible candles.
Custom Period – Fixed number of bars.
Up/Down – Adjust tilt for the 3D angle.
Left/Right – Scale width of the profile.
Aggregated – Merge bull/bear volume.
Bull/Bear Shift – Separate bullish and bearish volume.
Buckets – Number of price levels.
Choose from templates or set custom colors.
POC Gradient option makes high volume bolder, low volume lighter.
-----------------
Disclaimer
The content provided in my scripts, indicators, ideas, algorithms, and systems is for educational and informational purposes only. It does not constitute financial advice, investment recommendations, or a solicitation to buy or sell any financial instruments. I will not accept liability for any loss or damage, including without limitation any loss of profit, which may arise directly or indirectly from the use of or reliance on such information.
All investments involve risk, and the past performance of a security, industry, sector, market, financial product, trading strategy, backtest, or individual's trading does not guarantee future results or returns. Investors are fully responsible for any investment decisions they make. Such decisions should be based solely on an evaluation of their financial circumstances, investment objectives, risk tolerance, and liquidity needs.

Quadro Volume Profile [BigBeluga]🔵 OVERVIEW
The Quadro Volume Profile is a precision-engineered volume profiling tool that segments market activity into four distinct quadrants surrounding the current price. By separating bullish and bearish volume above and below the current price, it helps traders identify dominant forces and high-interest price zones with ease. Each quadrant includes label annotations showing total volume and its share of overall activity — delivering powerful insights into the market’s internal structure.
🔵 CONCEPTS
Four-Quadrant Volume Distribution : Volume is separated into Buy and Sell profiles both above and below the current price.
Directional Volume Logic : Bullish and bearish candle volume is allocated to specific bins, creating color-coded volume stacks.
Dynamic PoC Detection : Point of Control (PoC) levels are calculated per quadrant and optionally displayed.
Lookback-Based Anchoring : The volume histogram is anchored to a fixed lookback window, ensuring consistency and historical context.
Label-Based Analytics : Each quadrant displays a labeled breakdown of direction, total volume, and percentage weight of total activity.
🔵 FEATURES
Four separate volume profiles:
Upper Left: Bearish volume (Sell Quad above price)
Upper Right: Bullish volume (Buy Quad above price)
Lower Left: Bullish volume (Buy Quad below price)
Lower Right: Bearish volume (Sell Quad below price)
Live Labels for Each Quad:
Displays BUY or SELL direction
Shows total volume per quadrant (e.g. 607.49K)
Displays percent share of total quad volume (e.g. 18.87%)
Toggle visibility for each profile and each Point of Control (PoC) dashed PoC lines with volume annotations
Adjustable calculation period (lookBack), number of bins, and horizontal offset
Color gradient intensity represents volume strength per bin
Auto-cleaning visuals to keep the chart uncluttered
Gradient color control for Buy and Sell volumes
Clean midline split between upper and lower quadrants
🔵 HOW TO USE
Select your desired calculation period (default: 200 bars) to define the range for volume analysis.
Adjust the bins parameter for more or less resolution in volume distribution.
Toggle each quadrant on/off depending on your preference using the settings panel:
“Upper Sell Quad” – shows bearish volume above current price (left)
“Upper Buy Quad” – shows bullish volume above current price (right)
“Lower Buy Quad” – shows bullish volume below current price (left)
“Lower Sell Quad” – shows bearish volume below current price (right)
Enable or disable PoC lines for each quad to highlight where volume peaked.
Use the gradient coloring to identify volume imbalances — sharp differences between opposing quads often indicate key zones of rejection or breakout.
Monitor the midline level which splits the four quadrants — it serves as a psychological pivot zone.
🔵 CONCLUSION
The Quadro Volume Profile offers a powerful and visually intuitive way to dissect market activity around price. By splitting volume into four quadrants, traders can better interpret order flow, identify dominant volume zones, and spot potential reversals or continuation setups. Whether you're trading breakouts, liquidity sweeps, or range-bound behavior — this tool adds a structured layer of volume context to your charting workflow.

Phantom Trend IndicatorOverview
The Phantom Trend Indicator (PTI) is a streamlined tool for identifying trend direction and strength. It blends zigzag-based trend detection with a volume profile to display a histogram showing price distance from the Point of Control (POC). Six distinct colors highlight trend states, with background highlights for extreme price zones. Ideal for stocks, forex, crypto, and futures across any timeframe.
Features:
Trend Detection: Uses zigzag fractals to identify uptrends and downtrends.
Histogram Colors: Six colors for trend strength (low, high, extreme for up/down trends) or neutral (gray).
Dynamic Levels: Plots POC, Value Area Low (VAL), and High (VAH) via volume profile.
Background Colors: Highlights overbought (above VAH) or oversold (below VAL) zones.
Alerts: Signals new trends.
How It Works:
Trends: Zigzag fractals define trend ranges, with price position setting histogram colors (low, high, or extreme).
Histogram: Shows price deviation from POC.
Background: Colors extreme zones outside VAL/VAH.
This indicator builds on traditional trend detectors and volume profiles by integrating them into a single, cohesive tool. Unlike standard momentum indicators that rely on moving averages, PTI uses zigzag fractals for more responsive trend identification, reducing lag in volatile markets. Compared to basic volume profile scripts, it adds trend-based color coding and background alerts for extremes, providing clearer visual cues for overbought/oversold conditions. The six distinct colors indicate trend strength, and customizable thresholds allow fine-tuning for different assets and timeframes, enhancing adaptability. Traders benefit from combined momentum and liquidity insights, helping spot reversals or continuations more reliably—making PTI a valuable, standalone addition for both novice and experienced users.
Settings
Trend Detector: Toggle alerts, adjust zigzag sensitivity, and set thresholds for low-to-high and extreme color transitions.
Dynamic Levels: Configure volume profile period, multiplier, accuracy, value area percent, and ATR-based channel width.
Visuals: Customize POC, VAL, VAH, and area fill colors.
Read Histogram: Uptrend colors show early, strong, or overextended moves; downtrend colors indicate early, weakening, or oversold conditions; gray for consolidation.
Background: Monitor for overbought/oversold color-coded signals.
Tune: Adjust zigzag or period settings for your timeframe/asset.
Tips
Shorten period for intraday, extend for swing trading.
Pair with other indicators for confirmation.
Notes:
Requires sufficient chart data for volume profile.
Test settings for low-volatility assets.
For informational use only, not financial advice. Test thoroughly, and happy trading!

Liquidity Pro Map [ChartPrime]⯁ OVERVIEW
Liquidity Pro Map is a market-structure tool that simulates liquidity distribution by splitting price history into buy-side and sell-side profiles. Using candle volume and the standard deviation of close, the indicator builds two mirrored volume maps on the right-hand side of the chart. It also extends liquidity levels backwards in time until they are crossed by price, allowing you to see which zones remain untouched and where liquidity is most likely resting. Cumulative skew lines and highlighted POC levels give additional clarity on imbalance between buyers and sellers.
⯁ KEY FEATURES
Dual Liquidity Profiles: The chart is divided into buy-side (green) and sell-side (red) liquidity profiles, letting you instantly compare both sides of order flow.
Level Extension Logic: Each liquidity level is extended back in time until price crosses it. If not crossed, it persists all the way to the indicator’s lookback period, marking zones that remain “untapped.”
Dynamic Binning with Standard Deviation: The indicator distributes candle volumes into bins using close-price deviation, creating a more realistic liquidity map than static price levels.
priceDeviation = ta.stdev(close, 25) * 2
priceReference = close > open ? low - priceDeviation : high + priceDeviation
Cumulative Volume Skew Lines: Polylines on the right-hand side show the aggregated buy and sell volume profiles, making it easy to spot imbalance.
POC Identification: Highest-volume levels on both sides are marked as POC (Point of Control) , providing key zones of interest.
Clear Color Coding: Gradient shading intensifies with volume concentration—dark teal/green for buy zones, dark pink/red for sell zones.
⯁ HOW IT WORKS (UNDER THE HOOD)
Volume Distribution: Each bar’s volume is assigned to a price bin based on its reference price (close ± standard deviation offset).
Buy vs. Sell Splitting: If bins above last close price, volume is allocated to sell-side liquidity; otherwise, it’s allocated to buy-side liquidity.
Level Extension: Boxes marking liquidity bins extend back until crossed by price. If uncrossed, they anchor all the way to the start of the lookback window.
Cumulative Polylines: As bins are stacked, cumulative buy and sell values form skew polylines plotted at the right edge.
POC Levels: The highest-volume bin on each side is highlighted with labels and arrows, marking where the heaviest liquidity is concentrated.
⯁ USAGE
Use buy/sell profiles to see where liquidity is likely resting. Green shelves suggest potential support zones; red shelves suggest resistance or sell liquidity pools.
Watch untouched extended levels —these often become magnets for price as liquidity is swept.
Track POC levels as primary liquidity targets, where reactions or fakeouts are most common.
Compare cumulative skew lines to judge which side dominates in volume. Heavy buy skew may indicate absorption of sell pressure, and vice versa.
Adjust lookback period to switch between intraday liquidity maps and larger swing-based profiles.
Use separator feature to hide bins borders for better visual clarity.
Use as a confluence tool with OBs, support/resistance, and liquidity sweep setups.
⯁ CONCLUSION
Liquidity Pro Map transforms candle volume into a structured simulation of where liquidity may rest across the chart. By dividing buy vs. sell profiles, extending untouched levels, and marking cumulative skew and POC, it equips traders with a clear visual map of potential liquidity pools. This allows for better anticipation of sweeps, reversals, and areas of high market activity.

TPO Levels [VAH/POC/VAL] with Poor H/L, Single Prints & NPOCs### 🎯 Advanced Market Profile & Key Level Analysis
This script is a unique and comprehensive technical analysis tool designed to help traders understand market structure, value, and key liquidity levels using the principles of **Auction Market Theory** and **Market Profile**.
This script is unique (and shouldn't be censored) because :
It allows large history of levels to be displayed
Accurate as possible tick size
Doesn't draw a profile but only the actual levels
Supports multi-timeframe levels even on the daily mode giving macro context
There is no indicator out there that does it
While these concepts are universal, this indicator was built primarily for the dynamic, 24/7 nature of the **cryptocurrency market**. It helps you move beyond simple price action to understand *why* the market is moving, which is especially crucial in the volatile crypto space.
### ## 📊 The Concepts Behind the Calculations
To use this script effectively, it's important to understand the core concepts it is built upon. The entire script is self-contained and does not require other indicators.
* **What is Market Profile?**
Market Profile is a unique charting technique that organizes price and time data to reveal market structure. It's built from **Time Price Opportunities (TPOs)**, which are 30-minute periods of market activity. By stacking these TPOs, the script builds a distribution, showing which price levels were most accepted (heavily traded) and which were rejected (lightly traded) during a session.
* **What is the Value Area (VA)?**
The Value Area is the heart of the profile. It represents the price range where **70%** of the session's trading volume occurred. This is considered the "fair value" zone where both buyers and sellers were in general agreement.
* **Point of Control (POC):** The single price level with the most TPOs. This was the most accepted or "fairest" price of the session and acts as a gravitational line for price.
* **Value Area High (VAH):** The upper boundary of the 70% value zone.
* **Value Area Low (VAL):** The lower boundary of the 70% value zone.
VAH and VAL are dynamic support and resistance levels. Trading outside the previous session's value area can signal the start of a new trend.
***
### ## 📈 Key Features Explained
This script automatically calculates and displays the following critical market-generated information:
* **Multi-Timeframe Market Profile**
Automatically draws Daily, Weekly, and Monthly profiles, allowing you to analyze market structure across different time horizons. The script preserves up to 20 historical sessions to provide deep market context.
* **Naked Point of Control (nPOC)**
A "Naked" POC is a Point of Control from a previous session that has **not** been revisited by price. These levels often act as powerful magnets for price, representing areas of unfinished business that the market may seek to retest. The script tracks and displays Daily, Weekly, and Monthly nPOCs until they are touched.
* **Single Prints (Imbalance Zones)**
A Single Print is a price level where only one TPO traded during the session's development. This signifies a rapid, aggressive price move and an imbalanced market. These areas, like gaps in a traditional chart, are frequently revisited as the market seeks to "fill in" these thin parts of the profile.
* **Poor Structure (Unfinished Auctions)**
A **Poor High** or **Poor Low** occurs when the top or bottom of a profile is flat, with two or more TPOs at the extreme price. This suggests that the auction in that direction was weak and inconclusive. These weak structures often signal a high probability that price will eventually break that high or low.
***
### ## 💡 How to Use This Indicator
This tool is not a signal generator but an analytical framework to improve your trading decisions.
1. **Determine Market Context:** Start by asking: Is the current price trading *inside* or *outside* the previous session's Value Area?
* **Inside VA:** The market is in a state of balance or range-bound. Look for trades between the VAH and VAL.
* **Outside VA:** The market is in a state of imbalance and may be starting a trend. Look for continuation or acceptance of prices outside the prior value.
2. **Identify Key Levels:**
* Use historical **nPOCs** as potential profit targets or areas to watch for a price reaction.
* Treat historical **VAH** and **VAL** levels as significant support and resistance zones.
* Note where **Single Prints** are. These are often price magnets that may get "filled" in the future.
3. **Spot Weakness:**
* A **Poor High** suggests weak resistance that may be easily broken.
* A **Poor Low** suggests weak support, signaling a potential for a continued move lower if broken.
***
### ## ⚙️ Customization & Crypto Presets
The indicator is highly customizable, allowing you to change colors, transparency, the number of historical sessions, and more.
To help traders get started quickly, the indicator includes **built-in layout presets** specifically calibrated for major cryptocurrencies: ** BINANCE:BTCUSDT.P , BINANCE:ETHUSDT.P , and BINANCE:SOLUSDT.P **. These presets automatically adjust key visual parameters to better suit the unique price characteristics and volatility of each asset, providing an optimized view right out of the box.
***
### ## ⚠️ Disclaimer
This indicator is a tool for market analysis and should not be interpreted as direct buy or sell signals. It provides information based on historical price action, which does not guarantee future results. Trading involves significant risk, and you should always use proper risk management. This script is designed for use on standard chart types (e.g., Candlesticks, Bar) and may produce misleading information on non-standard charts.

FlowScope [Hapharmonic]FlowScope: Uncover the Market's True Intent 🔬
Ever wished you could look inside the candles and see where the real action is happening? FlowScope is your microscope for the market's flow, designed to give you a powerful edge by revealing the volume distribution that price action alone can't show you.
Instead of just looking at the open, high, low, and close, FlowScope lets you dive deeper into the market's auction process. It groups candles together and builds a detailed Volume Profile for that period, showing you exactly where the trading happened and revealing the story behind the price action.
Let's explore how you can use it to gain a powerful new edge.
🧐 Core Concept: How It Works
At its heart, FlowScope does three key things:
It Groups Candles: You decide how many candles to group together. For example, setting " Group Candles " to 4 on a 5-minute chart effectively gives you a detailed 20-minute candle and profile. This helps you see the bigger picture and filter out market noise.
It Builds a Volume Profile: For each group, FlowScope analyzes the volume at every single price level. It then displays this as a horizontal histogram (we call this a "footprint" or profile). Longer bars mean more volume was traded at that price, indicating a "fair" price or an area of acceptance. Shorter bars mean price moved through quickly, indicating rejection.
It Creates a Custom "Grouped Candle": To summarize the group's overall price action, FlowScope draws a single, custom candle representing the entire group's:
Open: The open of the first candle in the group.
High: The absolute highest price reached within the group.
Low: The absolute lowest price reached within the group.
Close: The close of the last candle in the group.
This gives you a crystal-clear view of the group's net result, free from the back-and-forth noise of the individual candles inside it.
Below are some of the stunning preset color palettes you can choose from to customize your view:
🚀 How to Use: Practical Applications
FlowScope isn't just for looking pretty; it's a powerful analysis tool. Here are a few ways to integrate it into your trading:
Identify High-Volume Nodes (HVNs): Look for the longest bars in the profile. These are price levels where the market spent the most time and traded the most volume. HVNs often act as powerful "magnets" for price, becoming key areas of support and resistance.
Spot Low-Volume Nodes (LVNs): These are areas with very short bars or gaps in the profile. They represent price levels that the market moved through quickly and inefficiently. If price returns to an LVN, it's likely to move through it quickly again.
Analyze the Summary Box: This is where the real magic happens! ✨
Total Volume (Σ): The total volume for the entire group.
Buy (B) vs. Sell (S) Volume: FlowScope analyzes the lower timeframe action to estimate the buying and selling pressure that made up the total volume. Is a big red candle mostly aggressive selling, or was it just a lack of buyers? The B/S data gives you clues. A high-volume candle with nearly 50/50 buy/sell pressure might indicate absorption or a potential reversal.
Use the Grouped Candle for Clarity: Is the market in a clear uptrend, or is it just choppy? The grouped candle can give you a much clearer signal. A series of strong, green grouped candles shows much more conviction than a mix of small green and red candles.
⚙️ Settings & Customization
This is where you can truly make FlowScope your own. Let's walk through each setting.
Profile Settings
Group Candles: The number of standard chart candles you want to combine into a single FlowScope profile. A setting of 1 will analyze every single bar. A higher number gives you a broader market view. When Group Candles is set to 5, the data from the 5 individual candles are combined, and the volume is calculated accordingly.
Max Profile Boxes: This setting is more than just a number; it's a smart limit that ensures your profiles are always readable and relevant to the current market conditions.
Adaptive Sizing (The Ideal Goal): FlowScope first tries to create the perfect profile by making each volume box's height proportional to the current market volatility. It calculates an "ideal" box height based on the Average True Range ( ATR / 10 ). This is powerful because it automatically adapts: you get smaller, more detailed boxes in quiet, low-volatility markets, and larger, clearer boxes in volatile, fast-moving markets.
The Safety Cap (Your Setting): However, what if you group several candles during a massive price move? The price range could be huge! If we only used the small, ATR-based box height, you might end up with hundreds of tiny, unreadable boxes. This is where your Max Profile Boxes setting (defaulting to 50) comes in. It acts as a maximum detail cap . If the adaptive, volatility-based calculation determines that it would need more boxes than your setting (e.g., more than 50), the indicator will override it. It will then simply divide the entire price range of the group into exactly the number of boxes you specified (e.g., 50).
In short: You are setting the maximum allowable detail. FlowScope intelligently adapts the profile's granularity below that limit based on market volatility, ensuring you always get a clear and meaningful picture.
Style
Show Profile BG: A simple toggle to show or hide the faint background color behind the volume bars. Turning it off can create a cleaner look.
Color Mode: This dropdown controls how the volume profile text is colored.
Custom Gradient: This mode uses the three custom colors you select in the "Profile Colors" section to create a beautiful gradient across the profile.
Candle Color: This mode colors the profile based on whether the grouped candle was bullish (green) or bearish (red). The color will be a gradient, with the most intense color applied to the box with the highest volume; the colors of the other boxes will fade out from that point. It's a great way to see the profile's "mood" at a glance.
Profile Colors 🎨
Use Preset Palette: This is the master switch!
If checked: You can choose from 10 stunning, pre-designed color palettes from the Palette dropdown. The custom color pickers below will be disabled.
If unchecked (Default): The Palette dropdown will be disabled, and you can now choose your own three colors for the gradient.
Palette: (Only active when "Use Preset Palette" is checked) . Choose from 10 luxurious, eye-catching color schemes like "Solar Flare" or "Deep Space" to instantly change the look and feel of your chart.
Low Price / Mid Price / High Price: (Only active when "Use Preset Palette" is unchecked) . These three color pickers allow you to design your own unique gradient for the Custom Gradient color mode.
Candle Display
These settings control the custom "Grouped Candle" that summarizes the profile. When using the "Show Custom Candle" feature, you should change the chart's candlestick display to Bars for a cleaner view.
Show Custom Candle: This is the main toggle. When you check this box, the original chart candles will be hidden, and your custom FlowScope candle will be displayed instead. This custom candle is intentionally small to ensure it does not visually overlap with the volume profile boxes.
Show Body: (Only active when "Show Custom Candle" is checked) . Toggles the visibility of the candle's body.
Wick Width & Body Width: (Only active when "Show Custom Candle" is checked) . These sliders let you control the thickness of the wick and body lines to match your personal style.
Up Color / Down Color: (Only active when "Show Custom Candle" is checked) . Choose the colors for your bullish and bearish custom candles.
Experiment with the settings, find a style that works for you, and start seeing the market in a whole new light.
Happy trading! 📈😊

POC Migration Velocity (POC-MV) [PhenLabs]📊POC Migration Velocity (POC-MV)
Version: PineScript™v6
📌Description
The POC Migration Velocity indicator revolutionizes market structure analysis by tracking the movement, speed, and acceleration of Point of Control (POC) levels in real-time. This tool combines sophisticated volume distribution estimation with velocity calculations to reveal hidden market dynamics that conventional indicators miss.
POC-MV provides traders with unprecedented insight into volume-based price movement patterns, enabling the early identification of continuation and exhaustion signals before they become apparent to the broader market. By measuring how quickly and consistently the POC migrates across price levels, traders gain early warning signals for significant market shifts and can position themselves advantageously.
The indicator employs advanced algorithms to estimate intra-bar volume distribution without requiring lower timeframe data, making it accessible across all chart timeframes while maintaining sophisticated analytical capabilities.
🚀Points of Innovation
Micro-POC calculation using advanced OHLC-based volume distribution estimation
Real-time velocity and acceleration tracking normalized by ATR for cross-market consistency
Persistence scoring system that quantifies directional consistency over multiple periods
Multi-signal detection combining continuation patterns, exhaustion signals, and gap alerts
Dynamic color-coded visualization system with intensity-based feedback
Comprehensive customization options for resolution, periods, and thresholds
🔧Core Components
POC Calculation Engine: Estimates volume distribution within each bar using configurable price bands and sophisticated weighting algorithms
Velocity Measurement System: Tracks the rate of POC movement over customizable lookback periods with ATR normalization
Acceleration Calculator: Measures the rate of change of velocity to identify momentum shifts in POC migration
Persistence Analyzer: Quantifies how consistently POC moves in the same direction using exponential weighting
Signal Detection Framework: Combines trend analysis, velocity thresholds, and persistence requirements for signal generation
Visual Rendering System: Provides dynamic color-coded lines and heat ribbons based on velocity and price-POC relationships
🔥Key Features
Real-time POC calculation with 10-100 configurable price bands for optimal precision
Velocity tracking with customizable lookback periods from 5 to 50 bars
Acceleration measurement for detecting momentum changes in POC movement
Persistence scoring to validate signal strength and filter false signals
Dynamic visual feedback with blue/orange color scheme indicating bullish/bearish conditions
Comprehensive alert system for continuation patterns, exhaustion signals, and POC gaps
Adjustable information table displaying real-time metrics and current signals
Heat ribbon visualization showing price-POC relationship intensity
Multiple threshold settings for customizing signal sensitivity
Export capability for use with separate panel indicators
🎨Visualization
POC Connecting Lines: Color-coded lines showing POC levels with intensity based on velocity magnitude
Heat Ribbon: Dynamic colored ribbon around price showing POC-price basis intensity
Signal Markers: Clear exhaustion top/bottom signals with labeled shapes
Information Table: Real-time display of POC value, velocity, acceleration, basis, persistence, and current signal status
Color Gradients: Blue gradients for bullish conditions, orange gradients for bearish conditions
📖Usage Guidelines
POC Calculation Settings
POC Resolution (Price Bands): Default 20, Range 10-100. Controls the number of price bands used to estimate volume distribution within each bar
Volume Weight Factor: Default 0.7, Range 0.1-1.0. Adjusts the influence of volume in POC calculation
POC Smoothing: Default 3, Range 1-10. EMA smoothing period applied to the calculated POC to reduce noise
Velocity Settings
Velocity Lookback Period: Default 14, Range 5-50. Number of bars used to calculate POC velocity
Acceleration Period: Default 7, Range 3-20. Period for calculating POC acceleration
Velocity Significance Threshold: Default 0.5, Range 0.1-2.0. Minimum normalized velocity for continuation signals
Persistence Settings
Persistence Lookback: Default 5, Range 3-20. Number of bars examined for persistence score calculation
Persistence Threshold: Default 0.7, Range 0.5-1.0. Minimum persistence score required for continuation signals
Visual Settings
Show POC Connecting Lines: Toggle display of colored lines connecting POC levels
Show Heat Ribbon: Toggle display of colored ribbon showing POC-price relationship
Ribbon Transparency: Default 70, Range 0-100. Controls transparency level of heat ribbon
Alert Settings
Enable Continuation Alerts: Toggle alerts for continuation pattern detection
Enable Exhaustion Alerts: Toggle alerts for exhaustion pattern detection
Enable POC Gap Alerts: Toggle alerts for significant POC gaps
Gap Threshold: Default 2.0 ATR, Range 0.5-5.0. Minimum gap size to trigger alerts
✅Best Use Cases
Identifying trend continuation opportunities when POC velocity aligns with price direction
Spotting potential reversal points through exhaustion pattern detection
Confirming breakout validity by monitoring POC gap behavior
Adding volume-based context to traditional technical analysis
Managing position sizing based on POC-price basis strength
⚠️Limitations
POC calculations are estimations based on OHLC data, not true tick-by-tick volume distribution
Effectiveness may vary in low-volume or highly volatile market conditions
Requires complementary analysis tools for complete trading decisions
Signal frequency may be lower in ranging markets compared to trending conditions
Performance optimization needed for very short timeframes below 1-minute
💡What Makes This Unique
Advanced Estimation Algorithm: Sophisticated method for calculating POC without requiring lower timeframe data
Velocity-Based Analysis: Focus on POC movement dynamics rather than static levels
Comprehensive Signal Framework: Integration of continuation, exhaustion, and gap detection in one indicator
Dynamic Visual Feedback: Intensity-based color coding that adapts to market conditions
Persistence Validation: Unique scoring system to filter signals based on directional consistency
🔬How It Works
Volume Distribution Estimation:
Divides each bar into configurable price bands for volume analysis
Applies sophisticated weighting based on OHLC relationships and proximity to close
Identifies the price level with maximum estimated volume as the POC
Velocity and Acceleration Calculation:
Measures POC rate of change over specified lookback periods
Normalizes values using ATR for consistent cross-market performance
Calculates acceleration as the rate of change of velocity
Signal Generation Process:
Combines trend direction analysis using EMA crossovers
Applies velocity and persistence thresholds to filter signals
Generates continuation, exhaustion, and gap alerts based on specific criteria
💡Note:
This indicator provides estimated POC calculations based on available OHLC data and should be used in conjunction with other analysis methods. The velocity-based approach offers unique insights into market structure dynamics but requires proper risk management and complementary analysis for optimal trading decisions.

Yelober - Market Internal direction+ Key levelsYelober – Market Internals + Key Levels is a focused intraday trading tool that helps you spot high-probability price direction by anchoring decisions to structure that matters: yesterday’s RTH High/Low, today’s pre-market High/Low, and a fast Value Area/POC from the prior session. Paired with a compact market internals dashboard (NYSE/NASDAQ UVOL vs. DVOL ratios, VOLD slopes, TICK/TICKQ momentum, and optional VIX trend), it gives you a real-time read on breadth so you can choose which direction to trade, when to enter (breaks, retests, or fades at PMH/PML/VAH/VAL/POC), and how to plan exits as internals confirm or deteriorate. On top of these intraday decision benefits, it also allows traders—in a very subtle but powerful way—to keep an eye on the VIX and immediately recognize significant spikes or sharp decreases that should be factored in before entering a trade, or used as a quick signal to modify an existing position. In short: clear levels for the chart, live internals for the context, and a smarter, rules-based path to execution.
# Yelober – Market Internals + Key Levels
*A TradingView indicator for session key levels + real‑time market internals (NYSE/NASDAQ TICK, UVOL/DVOL/VOLD, and VIX).*
**Script name in Pine:** `Yelober - Market Internal direction+ Key levels` (Pine v6)
---
## 1) What this indicator does
**Purpose:** Help intraday traders quickly find high‑probability reaction zones and read market internals momentum without switching charts. It overlays yesterday/today’s **automatic price levels** on your active chart and shows a **market breadth table** that summarizes NYSE/NASDAQ buying pressure and TICK direction, with an optional VIX trend read.
### Key features at a glance
* **Automatic Price Levels (overlay on chart)**
* Yesterday’s High/Low of Day (**yHoD**, **yLoD**)
* Extended Hours High/Low (**yEHH**, **yEHL**) across yesterday AH + today pre‑market
* Today’s Pre‑Market High/Low (**PMH**, **PML**)
* Yesterday’s **Value Area High/Low** (**VAH/VAL**) and **Point of Control (POC)** computed from a volume profile of yesterday’s **regular session**
* Smart de‑duplication:
* Shows **only the higher** of (yEHH vs PMH) and **only the lower** of (yEHL vs PML) to avoid redundant bands
* **Market Breadth Table (on‑chart table)**
* **NYSE ratio** = UVOL/DVOL (signed) with **VOLD slope** from session open
* **NASDAQ ratio** = UVOLQ/DVOLQ (signed) with **VOLDQ slope** from session open
* **TICK** and **TICKQ**: live cumulative ratio and short‑term slope
* **VIX** (optional): current value + slope over a configurable lookback/timeframe
* Color‑coded trends with sensible thresholds and optional normalization
---
## 2) How to use it (trader workflow)
1. **Mark your reaction zones**
* Watch **yHoD/yLoD**, **PMH/PML**, and **VAH/VAL/POC** for first touches, break/retest, and failure tests.
* Expect increased responsiveness when multiple levels cluster (e.g., PMH ≈ VAH ≈ daily pivot).
2. **Read the breadth panel for context**
* **NYSE/NASDAQ ratio** (>1 = more up‑volume than down‑volume; <−1 = down‑dominant). Strong green across both favors long setups; red favors short setups.
* **VOLD slopes** (NYSE & NASDAQ): positive and accelerating → broadening participation; negative → persistent pressure.
* **TICK/TICKQ**: cumulative ratio and **slope arrows** (↗ / ↘ / →). Use the slope to gauge **near‑term thrust or fade**.
* **VIX slope**: rising VIX (red) often coincides with risk‑off; falling VIX (green) with risk‑on.
3. **Confluence = higher confidence**
* Example: Price reclaims **PMH** while **NYSE/NASDAQ ratios** print green and **TICK slopes** point ↗ — consider break‑and‑go; if VIX slope is ↘, that adds risk‑on confidence.
* Example: Price rejects **VAH** while **VOLD slopes** roll negative and VIX ↗ — consider fade/reversal.
4. **Risk management**
* Place stops just beyond key levels tested; if breadth flips, tighten or exit.
> **Timeframes:** Works best on 1–15m charts for intraday. Value Area is computed from **yesterday’s RTH**; choose a smaller calculation timeframe (e.g., 5–15m) for stable profiles.
---
## 3) Inputs & settings (what each option controls)
### Global Style
* **Enable all automatic price levels**: master toggle for yHoD/yLoD, yEHH/yEHL, PMH/PML, VAH/VAL/POC.
* **Line style/width**: applies to all drawn levels.
* **Label size/style** and **label color linking**: use the same color as the line or override with a global label color.
* **Maximum bars lookback**: how far the script scans to build yesterday metrics (performance‑sensitive).
### Value Area / Volume Profile
* **Enable Value Area calculations** *(on by default)*: computes yesterday’s **POC**, **VAH**, **VAL** from a simplified intraday volume profile built from yesterday’s **regular session bars**.
* **Max Volume Profile Points** *(default 50)*: lower values = faster; higher = more precise.
* **Value Area Calculation Timeframe** *(default 15)*: the security timeframe used when collecting yesterday’s highs/lows/volumes.
### Individual Level Toggles & Colors
* **yHoD / yLoD** (yesterday high/low)
* **yEHH / yEHL** (yesterday AH + today pre‑market extremes)
* **PMH / PML** (today pre‑market extremes)
* **VAH / VAL / POC** (yesterday RTH value area + point of control)
### Market Breadth Panel
* **Show NYSE / NASDAQ / VIX**: choose which series to display in the table.
* **Table Position / Size / Background Color**: UI placement and legibility.
* **Slope Averaging Periods** *(default 5)*: number of recent TICK/TICKQ ratio points used in slope calculation.
* **Candles for Rate** *(default 10)* & **Normalize Rate**: VIX slope calculation as % change between `now` and `n` candles ago; normalize divides by `n`.
* **VIX Timeframe**: optionally compute VIX on a higher TF (e.g., 15, 30, 60) for a smoother regime read.
* **Volume Normalization** (NYSE & NASDAQ): display VOLD slopes scaled to `tens/thousands/millions/10th millions` for readable magnitudes; color thresholds adapt to your choice.
---
## 4) Data sources & definitions
* **UVOL/VOLD (NYSE)** and **UVOLQ/DVOLQ/VOLDQ (NASDAQ)** via `request.security()`
* **Ratio** = `UVOL/DVOL` (signed; negative when down‑volume dominates)
* **VOLD slope** ≈ `(VOLD_now − VOLD_open) / bars_since_open`, then normalized per your setting
* **TICK/TICKQ**: cumulative sum of prints this session with **positives vs negatives ratio**, plus a simple linear regression **slope** of the last `N` ratio values
* **VIX**: value and slope across a user‑selected timeframe and lookback
* **Sessions (EST/EDT)**
* **Regular:** 09:30–16:00
* **Pre‑Market:** 04:00–09:30
* **After Hours:** 16:00–20:00
* **Extended‑hours extremes** combine **yesterday AH** + **today PM**
> **Note:** All session checks are done with TradingView’s `time(…,"America/New_York")` context. If your broker’s RTH differs (e.g., futures), adjust expectations accordingly.
---
## 5) How the algorithms work (plain English)
### A) Key Levels
* **Yesterday’s RTH High/Low**: scans yesterday’s bars within 09:30–16:00 and records the extremes + bar indices.
* **Extended Hours**: scans yesterday AH and today PM to get **yEHH/yEHL**. Script shows **either yEHH or PMH** (whichever is **higher**) and **either yEHL or PML** (whichever is **lower**) to avoid duplicate bands stacked together.
* **Value Area & POC (RTH only)**
* Build a coarse volume profile with `Max Volume Profile Points` buckets across the price range formed by yesterday’s RTH bars.
* Distribute each bar’s volume uniformly across the buckets it spans (fast approximation to keep Pine within execution limits).
* **POC** = bucket with max volume. **VA** expands from POC outward until **70%** of cumulative volume is enclosed → yields **VAH/VAL**.
### B) Market Breadth Table
* **NYSE/NASDAQ Ratio**: signed UVOL/DVOL with basic coloring.
* **VOLD Slopes**: from session open to current, normalized to human‑readable units; colors flip green/red based on thresholds that map to your normalization setting (e.g., ±2M for NYSE, ±3.5×10M for NASDAQ).
* **TICK/TICKQ Slope**: linear regression over the last `N` ratio points → **↗ / → / ↘** with the rounded slope value.
* **VIX Slope**: % change between now and `n` candles ago (optionally divided by `n`). Red when rising beyond threshold; green when falling.
---
## 6) Recommended presets
* **Stocks (liquid, intraday)**
* Value Area **ON**, `Max Volume Points` = **40–60**, **Timeframe** = **5–15**
* Breadth: show **NYSE & NASDAQ & VIX**, `Slope periods` = **5–8**, `Candles for rate` = **10–20**, **Normalize VIX** = **ON**
* **Index futures / very high‑volume symbols**
* If you see Pine timeouts, set `Max Volume Points` = **20–40** or temporarily **disable Value Area**.
* Keep breadth panel **ON** (it’s light). Consider **VIX timeframe = 15/30** for regime clarity.
---
## 7) Tips, edge cases & performance
* **Performance:** The volume profile is capped (`maxBarsToProcess ≤ 500` and bucketed) to keep it responsive. If you experience slowdowns, reduce `Max Volume Points`, `Maximum bars lookback`, or disable Value Area.
* **Redundant lines:** The script **intentionally suppresses** PMH/PML when yEHH/yEHL are more extreme, and vice‑versa.
* **Label visibility:** Use `Label style = none` if you only want clean lines and read values from the right‑end labels.
* **Futures/RTH differences:** Value Area is from **yesterday’s RTH** only; for 24h instruments the RTH period may not reflect overnight structure.
* **Session transitions:** PMH/PML tracking stops as soon as RTH starts; values persist as static levels for the session.
---
## 8) Known limitations
* Uses public TradingView symbols: `UVOL`, `VOLD`, `UVOLQ`, `DVOLQ`, `VOLDQ`, `TICK`, `TICKQ`, `VIX`. If your data plan or region limits any symbol, the corresponding table rows may show `na`.
* The VA/POC approximation assumes uniform distribution of each bar’s volume across its high–low. That’s fast but not a tick‑level profile.
* Works best on US equities with standard NY session; alternative sessions may need code changes.
---
## 9) Troubleshooting
* **“Script is too slow / timed out”** → Lower `Max Volume Points`, lower `Maximum bars lookback`, or toggle **OFF** `Enable Value Area calculations` for that instrument.
* **Missing breadth values** → Ensure the symbols above load on your account; try reloading chart or switching timeframes once.
* **Overlapping labels** → Set `Label style = none` or reduce label size.
---
## 10) Version / license / contribution
* **Version:** Initial public release (Pine v6).
* **Author:** © yelober
* **License:** Free for community use and enhancement. Please keep author credit.
* **Contributing:** Open PRs/ideas: presets, alert conditions, multi‑day VA composites, optional mid‑value (`(VAH+VAL)/2`), session filter for futures, and alertable state machine for breadth regime transitions.
---
## 11) Quick start (TL;DR)
1. Add the indicator and **keep default settings**.
2. Trade **reactions** at yHoD/yLoD/PMH/PML/VAH/VAL/POC.
3. Use the **breadth table**: look for **green ratios + ↗ slopes** (risk‑on) or **red ratios + ↘ slopes** (risk‑off). Check **VIX** slope for confirmation.
4. Manage risk around levels; when breadth flips against you, tighten or exit.
---
### Changelog (public)
* **v1.0:** First community release with automatic RTH levels, VA/POC approximation, breadth dashboard (NYSE/NASDAQ/TICK/TICKQ/VIX) with normalization and adaptive color thresholds.

Advanced Volume Profile Pro Delta + POC + VAH/VAL# Advanced Volume Profile Pro - Delta + POC + VAH/VAL Analysis System
## WHAT THIS SCRIPT DOES
This script creates a comprehensive volume profile analysis system that combines traditional volume-at-price distribution with delta volume calculations, Point of Control (POC) identification, and Value Area (VAH/VAL) analysis. Unlike standard volume indicators that show only total volume over time, this script analyzes volume distribution across price levels and estimates buying vs selling pressure using multiple calculation methods to provide deeper market structure insights.
## WHY THIS COMBINATION IS ORIGINAL AND USEFUL
**The Problem Solved:** Traditional volume indicators show when volume occurs but not where price finds acceptance or rejection. Standalone volume profiles lack directional bias information, while basic delta calculations don't provide structural context. Traders need to understand both volume distribution AND directional sentiment at key price levels.
**The Solution:** This script implements an integrated approach that:
- Maps volume distribution across price levels using configurable row density
- Estimates delta (buying vs selling pressure) using three different methodologies
- Identifies Point of Control (highest volume price level) for key support/resistance
- Calculates Value Area boundaries where 70% of volume traded
- Provides real-time alerts for key level interactions and volume imbalances
**Unique Features:**
1. **Developing POC Visualization**: Real-time tracking of Point of Control migration throughout the session via blue dotted trail, revealing institutional accumulation/distribution patterns before they complete
2. **Multi-Method Delta Calculation**: Price Action-based, Bid/Ask estimation, and Cumulative methods for different market conditions
3. **Adaptive Timeframe System**: Auto-adjusts calculation parameters based on chart timeframe for optimal performance
4. **Flexible Profile Types**: N Bars Back (precise control), Days Back (calendar-based), and Session-based analysis modes
5. **Advanced Imbalance Detection**: Identifies and highlights significant buying/selling imbalances with configurable thresholds
6. **Comprehensive Alert System**: Monitors POC touches, Value Area entry/exit, and major volume imbalances
## HOW THE SCRIPT WORKS TECHNICALLY
### Core Volume Profile Methodology:
**1. Price Level Distribution:**
- Divides price range into user-defined rows (10-50 configurable)
- Calculates row height: `(Highest Price - Lowest Price) / Number of Rows`
- Distributes each bar's volume across price levels it touched proportionally
**2. Delta Volume Calculation Methods:**
**Price Action Method:**
```
Price Range = High - Low
Buy Pressure = (Close - Low) / Price Range
Sell Pressure = (High - Close) / Price Range
Buy Volume = Total Volume × Buy Pressure
Sell Volume = Total Volume × Sell Pressure
Delta = Buy Volume - Sell Volume
```
**Bid/Ask Estimation Method:**
```
Average Price = (High + Low + Close) / 3
Buy Volume = Close > Average ? Volume × 0.6 : Volume × 0.4
Sell Volume = Total Volume - Buy Volume
```
**Cumulative Method:**
```
Buy Volume = Close > Open ? Volume : Volume × 0.3
Sell Volume = Close ≤ Open ? Volume : Volume × 0.3
```
**3. Point of Control (POC) Identification:**
- Scans all price levels to find maximum volume concentration
- POC represents the price level with highest trading activity
- Acts as significant support/resistance level
- **Developing POC Feature**: Tracks POC evolution in real-time via blue dotted trail, showing how institutional interest migrates throughout the session. Upward POC migration indicates accumulation patterns, downward migration suggests distribution, providing early trend signals before price confirmation.
**4. Value Area Calculation:**
- Starts from POC and expands up/down to encompass 70% of total volume
- VAH (Value Area High): Upper boundary of value area
- VAL (Value Area Low): Lower boundary of value area
- Expansion algorithm prioritizes direction with higher volume
**5. Adaptive Range Selection:**
Based on profile type and timeframe optimization:
- **N Bars Back**: Fixed lookback period with performance optimization (20-500 bars)
- **Days Back**: Calendar-based analysis with automatic timeframe adjustment (1-365 days)
- **Session**: Current trading session or custom session times
### Performance Optimization Features:
- **Sampling Algorithm**: Reduces calculation load on large datasets while maintaining accuracy
- **Memory Management**: Clears previous drawings to prevent performance degradation
- **Safety Constraints**: Prevents excessive memory usage with configurable limits
## HOW TO USE THIS SCRIPT
### Initial Setup:
1. **Profile Configuration**: Select profile type based on trading style:
- N Bars Back: Precise control over data range
- Days Back: Intuitive calendar-based analysis
- Session: Real-time session development
2. **Row Density**: Set number of rows (30 default) - more rows = higher resolution, slower performance
3. **Delta Method**: Choose calculation method based on market type:
- Price Action: Best for trending markets
- Bid/Ask Estimate: Good for ranging markets
- Cumulative: Smoothed approach for volatile markets
4. **Visual Settings**: Configure colors, position (left/right), and display options
### Reading the Profile:
**Volume Bars:**
- **Length**: Represents relative volume at that price level
- **Color**: Green = net buying pressure, Red = net selling pressure
- **Intensity**: Darker colors indicate volume imbalances above threshold
**Key Levels:**
- **POC (Blue Line)**: Highest volume price - major support/resistance
- **VAH (Purple Dashed)**: Value Area High - upper boundary of fair value
- **VAL (Orange Dashed)**: Value Area Low - lower boundary of fair value
- **Value Area Fill**: Shaded region showing main trading range
**Developing POC Trail:**
- **Blue Dotted Lines**: Show real-time POC evolution throughout the session
- **Migration Patterns**: Upward trail indicates bullish accumulation, downward trail suggests bearish distribution
- **Early Signals**: POC movement often precedes price movement, providing advance warning of institutional activity
- **Institutional Footprints**: Reveals where smart money concentrated volume before final POC establishment
### Trading Applications:
**Support/Resistance Analysis:**
- POC acts as magnetic price level - expect reactions
- VAH/VAL provide intermediate support/resistance levels
- Profile edges show areas of low volume acceptance
**Developing POC Analysis:**
- **Upward Migration**: POC moving higher = institutional accumulation, bullish bias
- **Downward Migration**: POC moving lower = institutional distribution, bearish bias
- **Stable POC**: Tight clustering = balanced market, range-bound conditions
- **Early Trend Detection**: POC direction change often precedes price breakouts
**Entry Strategies:**
- Buy at VAL with POC as target (in uptrends)
- Sell at VAH with POC as target (in downtrends)
- Breakout plays above/below profile extremes
**Volume Imbalance Trading:**
- Strong buying imbalance (>60% threshold) suggests continued upward pressure
- Strong selling imbalance suggests continued downward pressure
- Imbalances near key levels provide high-probability setups
**Multi-Timeframe Context:**
- Use higher timeframe profiles for major levels
- Lower timeframe profiles for precise entries
- Session profiles for intraday trading structure
## SCRIPT SETTINGS EXPLANATION
### Volume Profile Settings:
- **Profile Type**: Determines data range for calculation
- N Bars Back: Exact number of bars (20-500 range)
- Days Back: Calendar days with timeframe adaptation (1-365 days)
- Session: Trading session-based (intraday focus)
- **Number of Rows**: Profile resolution (10-50 range)
- **Profile Width**: Visual width as chart percentage (10-50%)
- **Value Area %**: Volume percentage for VA calculation (50-90%, 70% standard)
- **Auto-Adjust**: Automatically optimizes for different timeframes
### Delta Volume Settings:
- **Show Delta Volume**: Enable/disable delta calculations
- **Delta Calculation Method**: Choose methodology based on market conditions
- **Highlight Imbalances**: Visual emphasis for significant volume imbalances
- **Imbalance Threshold**: Percentage for imbalance detection (50-90%)
### Session Settings:
- **Session Type**: Daily, Weekly, Monthly, or Custom periods
- **Custom Session Time**: Define specific trading hours
- **Previous Sessions**: Number of historical sessions to display
### Days Back Settings:
- **Lookback Days**: Number of calendar days to analyze (1-365)
- **Automatic Calculation**: Script automatically converts days to bars based on timeframe:
- Intraday: Accounts for 6.5 trading hours per day
- Daily: 1 bar per day
- Weekly/Monthly: Proportional adjustment
### N Bars Back Settings:
- **Lookback Bars**: Exact number of bars to analyze (20-500)
- **Precise Control**: Best for systematic analysis and backtesting
### Visual Customization:
- **Colors**: Bullish (green), Bearish (red), and level colors
- **Profile Position**: Left or Right side of chart
- **Profile Offset**: Distance from current price action
- **Labels**: Show/hide level labels and values
- **Smooth Profile Bars**: Enhanced visual appearance
### Alert Configuration:
- **POC Touch**: Alerts when price interacts with Point of Control
- **VA Entry/Exit**: Alerts for Value Area boundary interactions
- **Major Imbalance**: Alerts for significant volume imbalances
## VISUAL FEATURES
### Profile Display:
- **Horizontal Bars**: Volume distribution across price levels
- **Color Coding**: Delta-based coloring for directional bias
- **Smooth Rendering**: Optional smoothing for cleaner appearance
- **Transparency**: Configurable opacity for chart readability
### Level Lines:
- **POC**: Solid blue line with optional label
- **VAH/VAL**: Dashed colored lines with value displays
- **Extension**: Lines extend across relevant time periods
- **Value Area Fill**: Optional shaded region between VAH/VAL
### Information Table:
- **Current Values**: Real-time POC, VAH, VAL prices
- **VA Range**: Value Area width calculation
- **Positioning**: Multiple table positions available
- **Text Sizing**: Adjustable for different screen sizes
## IMPORTANT USAGE NOTES
**Realistic Expectations:**
- Volume profile analysis provides structural context, not trading signals
- Delta calculations are estimations based on price action, not actual order flow
- Past volume distribution does not guarantee future price behavior
- Combine with other analysis methods for comprehensive market view
**Best Practices:**
- Use appropriate profile types for your trading style:
- Day Trading: Session or Days Back (1-5 days)
- Swing Trading: Days Back (10-30 days) or N Bars Back
- Position Trading: Days Back (60-180 days)
- Consider market context (trending vs ranging conditions)
- Verify key levels with additional technical analysis
- Monitor profile development for changing market structure
**Performance Considerations:**
- Higher row counts increase calculation complexity
- Large lookback periods may affect chart performance
- Auto-adjust feature optimizes for most use cases
- Consider using session profiles for intraday efficiency
**Limitations:**
- Delta calculations are estimations, not actual transaction data
- Profile accuracy depends on available price/volume history
- Effectiveness varies across different instruments and market conditions
- Requires understanding of volume profile concepts for optimal use
**Data Requirements:**
- Requires volume data for accurate calculations
- Works best on liquid instruments with consistent volume
- May be less effective on very low volume or exotic instruments
This script serves as a comprehensive volume analysis tool for traders who need detailed market structure information with integrated directional bias analysis and real-time POC development tracking for informed trading decisions.

Cnagda Trading ToolCnagda Trading Tools - complete set of intraday trading
1. Trendline breakout based On ATR.
2. Live RSI, volume/candle average 20 Periods, trend direction last 34 periods, and some useful dashboard features.
3. Ma Scalp Line provide trend support and resistance + Where Line More Flat Previous Time You Also Use That Range As Support And Resistance
4. RSI based POC ( Point Of Control) indicate high Volume Area like fixed Range Volume profile
5. London session breakout with buy/sell Signal and NewYork session opening half hour range breakout with Buy/sell signal
Ma Scalp Buy And Sell Signal For Short term Scalping ( 5 Min Timeframe) Based on Ema And Wma Crossover
I hope these tools will improve your trading, but you should trade only after proper research, this indicator is not responsible for any loss.

Crypto Volume Data (VAH,POC,VAL)Crypto Volume Data (VAH, POC, VAL) — Multi-Exchange Aggregated Volume Zones
This indicator delivers a high-precision volume profile for crypto assets by aggregating real traded volume across Binance, Bybit, Coinbase, Kraken, OKX, and MEXC. It auto-detects multiple quote pairs (USD, USDT, USDC, FDUSD, USDT.P, USDC.P) and merges the live volume distribution respecting each exchange’s volume for that symbol to calculate institutional-grade VAH, POC, and VAL levels.
No matter which symbol or pair from which exchange is open on the chart, the script dynamically detects the base asset and fetches volume from all matching pairs on supported exchanges. For example, whether you load BTC/USDT, ETH/USDT.P, or SOL/FDUSD, the system identifies the symbol and aggregates volume from all relevant pairs of that symbol across all mentioned exchanges, weighting them based on real volume. This leads to significantly more accurate value areas — especially compared to single-source or single-pair profiles that miss fragmented liquidity and the real volume of each exchange.
This script is fully plug-and-play. There’s no need to select lookback windows or configure pairs — it's already optimized with pre-set internal parameters for common trading timeframes. (Still, you can adjust for your needs in the settings, but keep in mind more lookback is not necessarily a good thing — it might affect the accuracy of your output depending on the timeframe.)
Key Features:
Live aggregation of volume across 5 exchanges
Supports most listed altcoins with reliable quote pair coverage
Dynamic auto symbol/quote detection and normalization
Automatically adapts to any crypto chart without user setup
Real institutional zones — not synthetic, not heuristic
Why It Matters:
In fragmented crypto markets, liquidity isn’t centralized. Volume for a coin like ETH may be split between USDT on Binance, USD on Kraken, or USDC on MEXC. Most indicators ignore that. This tool doesn’t. It brings that volume together to provide the most contextually accurate VAH/POC/VAL levels possible, tailored to the charted asset and timeframe.
This isn't just another volume indicator. It’s built from the ground up to capture where the real trades happen — not just where price moved — and shows you the zones that institutions and large players respect.
Disclaimer:
This tool is for educational and informational purposes only. It does not constitute financial advice or an invitation to trade. Always do your own research and manage risk responsibly.
Credits:
Volume unification logic, cross-pair normalization, and exchange weighting system developed by me. No third-party libraries or reused scripts involved. Original architecture built from scratch for high-resolution crypto volume profile analysis.
Note:
Script designed to respect TradingView limits for both free and paid accounts, with a smart fallback system in case of hitting the limit. If you find any bug, error, or issue, kindly comment below. I will address and fix them ASAP.
Enjoy and cheers.
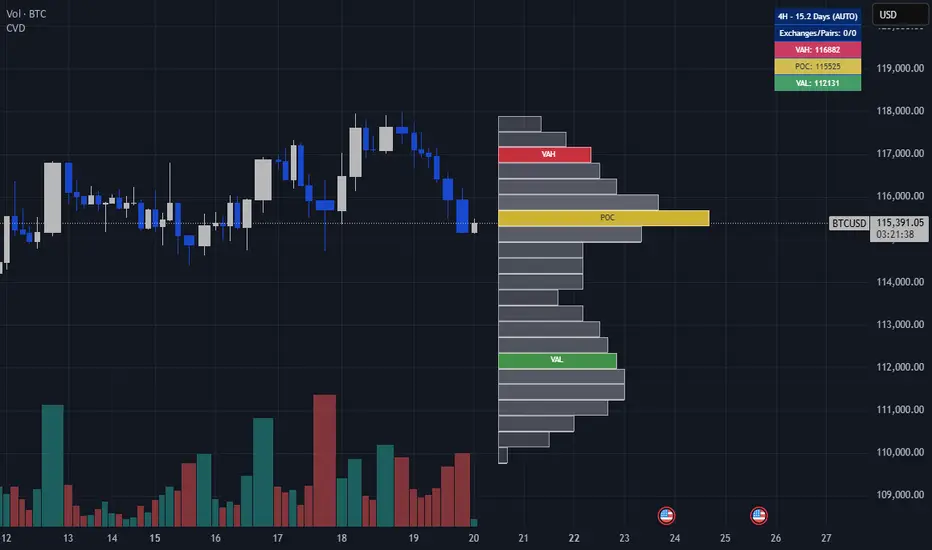
Advanced Trend Panel v3.1This is a comprehensive dashboard indicator designed to give traders a multi-faceted view of the market at a single glance. It combines key indicators across multiple timeframes, calculates trend duration, and presents all information in a clean, color-coded table. This tool is perfect for confirming trade ideas, identifying trend alignment, and understanding the underlying market dynamics.
#### Key Features:
* **All-in-One Dashboard:** A convenient on-chart table summarizes the state of multiple key indicators, saving you screen space and time.
* **Multi-Timeframe (MTF) Forecast:** Analyzes the long-term trend on a higher timeframe (e.g., Daily) to provide context for the current chart's trend.
* **Trend Analysis:** Uses dual sets of EMAs (long-term and short-term) to define the primary and immediate trend directions.
* **Trend Duration:** A unique feature that calculates how long the current short-term and long-term trends have been active, helping you gauge trend maturity.
* **Core Indicators Included:**
* **ADX:** Measures trend strength to differentiate between strong trends and weak or sideways markets.
* **RSI:** Identifies overbought and oversold conditions.
* **Point of Control (POC):** Shows the price level with the highest traded volume over a lookback period, acting as a key level of support/resistance.
* **Volume:** Compares current volume to its moving average to spot unusual activity.
* **Customizable Alerts:** Set up alerts for trend changes (long-term or short-term), RSI crossing into overbought/oversold zones, or shifts in ADX trend strength.
#### How to Use:
1. Apply the indicator to your chart.
2. In the settings, configure the timeframes, indicator lengths, and display options to match your trading style.
3. Use the table to quickly assess if the long-term trend, short-term trend, and momentum are aligned.
4. Enable alerts to be notified of key changes in market conditions without having to watch the chart constantly.
**Disclaimer:** This script is for educational purposes only and should not be considered financial advice. All trading involves risk. Past performance is not indicative of future results. Please backtest and use this tool as part of a comprehensive trading plan with proper risk management.
Feedback is always welcome! If you find this indicator useful, please leave a like.

Multi Ranges Volume Distribution [LuxAlgo]The Multi Ranges Volume Distribution tool allows traders to see the volume distribution by price for three different timeframes simultaneously. Each distribution can report the total amount of accumulated volume or the accumulated buy/sell volume separately.
Levels are displayed at the top and bottom of each timeframe's range, as well as the POC or level with the most volume.
🔶 USAGE
By default, the tool displays daily, weekly, and monthly volume distributions, highlighting the accumulated volume within each row.
Each distribution shows the volume at each price, as well as three lines: the top and bottom prices, and the price at which the most volume was traded.
The reported accumulated volume can be useful for highlighting which price areas are of the most interest to traders, with the specific timeframe specifying whether this interest is long-term or short-term.
🔹 Timeframes & Rows
Traders can adjust the timeframe and the number of rows for each volume distribution.
This is useful for multi-timeframe analysis of volume at the same price levels, or for obtaining detailed data within the same timeframe.
The chart above shows three volume distributions with the same monthly timeframe but a different number of rows; each is more detailed than the previous one.
🔹 Total vs Buy & Sell Volume
Traders can choose to display either the total volume or the buy and sell volumes.
As we can see on the above chart, the background of each row uses a gradient that is a function of the delta between the buy and sell volumes.
This is useful to determine which areas attract buyers and sellers.
🔶 SETTINGS
Volume Display: Select between total volume and buy and sell volume.
Distance between each box: Adjust the spacing of the volume distributions.
Period A: Select a timeframe and the number of rows.
Period B: Select a timeframe and the number of rows.
Period C: Select a timeframe and the number of rows.

Volume Profile (PRO) [ActiveQuants]The Volume Profile (PRO) indicator is an advanced analytical tool designed to provide traders with a deep understanding of market dynamics by displaying trading activity across different price levels over a specified period. By meticulously plotting volume distribution , this indicator helps identify significant price zones, such as areas of high acceptance ( High Volume Nodes - HVNs ), rejection ( Low Volume Nodes - LVNs ), Volume Peaks Clusters , Volume Troughs Clusters , the Point of Control (POC) , and the Value Area (VA) . This insight is crucial for spotting potential support/resistance levels, assessing market sentiment, and making more informed trading decisions.
This indicator operates on the principle that price levels with higher traded volume hold greater significance, often acting as pivotal points for future price movements. Conversely, areas with low volume typically indicate less agreement on price, leading to quicker price transitions. The Volume Profile (PRO) offers extensive customization to tailor the analysis to your specific needs and trading style.
█ KEY FEATURES
Comprehensive Volume Analysis: Visualize volume distribution horizontally, revealing key price levels based on actual traded volume.
Dynamic Profile Calculation: Uses a rolling lookback period to keep the profile relevant to recent price action.
Point of Control (POC): Automatically identifies and plots the price level with the highest traded volume within the profile period. Available as a "Regular" (fixed for the current profile) or "Developing" line that tracks its evolution bar-by-bar.
Value Area (VA): Highlights the price range where a specified percentage (typically 70%) of the total volume was traded. Also available as "Regular" or "Developing" VAH (Value Area High) and VAL (Value Area Low) lines.
High and Low Volume Nodes (HVNs & LVNs): Option to automatically detect and highlight a specified number of the highest volume concentration zones (HVNs) and lowest volume zones (LVNs) within the profile. These are crucial for identifying support/resistance and areas of potential quick price movement.
Volume Peaks and Troughs Detection: Identify statistically significant high-volume (Peaks) and low-volume (Troughs) rows relative to their neighbors, either as single rows or clusters. These can pinpoint precise levels of interest.
Multiple Volume Display Types: Choose to display volume as:
- Up/Down: Shows buying and selling volume side-by-side for each row.
- Total: Shows the aggregate volume for each row.
- Delta: Shows the difference between buying and selling volume for each row, highlighting imbalances.
Extensive Customization: Fine-tune lookback period, number of rows, profile width, horizontal placement, Value Area percentage, colors for all elements, and specific parameters for node/peak/trough detection.
Visual Enhancements:
- Optional gradient colors for volume bars.
- Display volume figures directly on rows.
- Background shading for the Value Area and the entire Profile range.
- Price labels for POC, VAH, VAL, Profile High, and Profile Low.
Integrated Alert System: Pre-built alert conditions for critical volume profile events. (See section on "█ SETTING UP ALERTS " for more details).
█ USER INPUTS
The settings panel is organized into distinct sections:
- Calculation Settings:
Lookback: Number of most recent bars for profile calculation.
Number of Rows: Resolution of the volume profile.
Profile Width: Relative horizontal length of the volume bars.
Horizontal Offset: Horizontal positioning of the profile.
Value Area (%): Percentage of volume to include in the Value Area.
Volume: Display type ("Up/Down", "Total", "Delta").
Profile Placement: "Right" or "Left" side of the chart.
- Appearance:
Volume Profile On/Off: Toggle visibility of the entire profile.
Rows Border Width & Color: Customize the outline of volume rows.
Gradient Colors: Enable/disable gradient coloring for volume bars.
Row Volume: Display numerical volume on each row.
VAH (Value Area High): Display type ("None", "Regular", "Developing"), Color, Price Label, Line Width.
VAL (Value Area Low): Display type ("None", "Regular", "Developing"), Color, Price Label, Line Width.
Profile High Price Label & Color: Toggle and customize.
Profile Low Price Label & Color: Toggle and customize.
Value Area Up/Down Color: Colors for up/down volume within VA.
Profile Up/Down Color: Colors for up/down volume outside VA.
Total Volume Color: For "Total" volume display type.
Delta Volume Positive/Negative Color: For "Delta" volume display type.
POC (Point of Control): Display type ("None", "Regular", "Developing"), Color, Line Width, Price Label.
Value Area Background & Color: Enable and customize VA background shading.
Profile Background & Color: Enable and customize profile range background shading.
Volume Nodes:
Highest Volume Nodes & Color: Number of HVNs to highlight and their color.
Lowest Volume Nodes & Color: Number of LVNs to highlight and their color.
Volume Peaks: Detection type ("None", "Single Row", "Cluster"), Color.
Compared Neighbors (Peaks): Number of neighboring rows to compare against for peak detection.
Minimum Peak Ratio (Peaks): Volume ratio required for a row to be considered a peak.
Volume Troughs: Detection type ("None", "Single Row", "Cluster"), Color.
Compared Neighbors (Troughs): Number of neighboring rows to compare against for trough detection.
Minimum Trough Ratio (Troughs): Volume ratio required for a row to be considered a trough.
█ SETTING UP ALERTS
The Volume Profile (PRO) indicator comes with a comprehensive set of pre-configured alert conditions to notify you of key market events related to volume structure. To set up an alert:
Click the " Alert " button (clock icon) on TradingView's right-hand toolbar or top panel.
In the " Condition " dropdown, select " Volume Profile (PRO) ".
A second dropdown will appear, allowing you to choose from the following specific alert conditions built into the script:
- POC Price Change: Triggers when the Point of Control price level changes.
- POC Crossover: Triggers when the closing price crosses over the POC line and is now above it.
- POC Crossunder: Triggers when the closing price crosses under the POC line and is now below it.
- Close Inside Value Area: Triggers when the closing price enters the Value Area.
- Close Outside Value Area: Triggers when the closing price exits the Value Area.
- Close Inside High Volume Node: Triggers when the closing price enters a detected High Volume Node.
- Close Inside Low Volume Node: Triggers when the closing price enters a detected Low Volume Node.
- Close Inside Volume Peak: Triggers when the closing price enters a detected Volume Peak row.
- Close Inside Volume Peak Cluster: Triggers when the closing price enters the area of a Volume Peak cluster.
- Close Inside Volume Trough: Triggers when the closing price enters a detected Volume Trough row.
- Close Inside Volume Trough Cluster: Triggers when the closing price enters the area of a Volume Trough cluster.
Choose your preferred " Trigger " option:
- " Only Once ": The alert triggers the first time the condition is met.
- " Once Per Bar Close ": ( Recommended for most profile signals ) The alert triggers only after the current bar closes if the condition was true on that closed bar. This ensures signals are based on confirmed price action.
Customize the alert name, message, and notification preferences.
Click " Create ".
█ STRATEGY EXAMPLES
The following examples are for illustrative purposes only to demonstrate how the Volume Profile (PRO) can be used. They are not financial advice. Always conduct thorough backtesting and research.
1. POC as Dynamic Support/Resistance
Goal: Identify potential bounces or rejections from the Point of Control.
Setup: Enable "POC Line" (Regular or Developing) and observe price interaction.
Entry (Long):
- Price approaches the POC from above and shows signs of holding (e.g., bullish candlestick patterns, deceleration).
- Enter on confirmation of support at the POC.
Entry (Short):
- Price approaches the POC from below and shows signs of rejection (e.g., bearish candlestick patterns).
- Enter on confirmation of resistance at the POC.
Management: Stop-loss beyond the recent swing pivot or the POC itself after a confirmed break. Target the next significant volume node (HVN/LVN) or Value Area boundary.
2. Trading Low Volume Nodes (LVNs) as "Vacuum Zones"
Goal: Capitalize on rapid price movement through LVNs and their potential to become support/resistance once traversed.
Setup: Enable "Lowest Volume Nodes" to identify LVNs.
Entry (Long):
- Price breaks decisively above an LVN.
- Look for a retest of the top of the LVN as support. Enter long on confirmation.
Entry (Short):
- Price breaks decisively below an LVN.
- Look for a retest of the bottom of the LVN as resistance. Enter short on confirmation.
Concept: Price is expected to move quickly through LVNs (volume vacuum). Once price has passed through an LVN, that area of prior low acceptance can act as a new support/resistance zone.
Management: Stop-loss beyond the retested LVN. Target the next HVN or significant price level.
█ CONCLUSION
The Volume Profile (PRO) indicator offers a sophisticated and highly customizable approach to volume analysis. By providing clear visualizations of POC, Value Area, HVNs, LVNs, and Volume Peaks/Troughs, along with integrated alerts and developing levels, this tool empowers traders to identify critical price zones, understand market structure, and develop more nuanced trading strategies. Whether you're looking for precise entry points, areas of support and resistance, or confirmation of market sentiment, this Volume Profile indicator is an invaluable addition to your technical analysis toolkit.
█ IMPORTANT NOTES
⚠ Lookback vs. Calculated Bars Relationship: The value set in the " Lookback " input ( Calculation Settings ) must be less than half of the number of bars the indicator is set to calculate on your chart (referred to as " Calculated bars " in the script, typically controlled by TradingView's historical data loading or a calc_bars_count setting within the script's indicator() declaration – in this script, it is 1200 bars by default). For example, if "Calculated bars" is 1200, your Lookback should be less than 600. The default Lookback of 500 respects this. Setting a Lookback too high relative to available calculated bars can lead to errors or incorrect profile rendering.
⚠ Parameter Optimization: The default settings are starting points. Always adjust indicator parameters (Lookback, Number of Rows, VA%, etc.) based on the specific asset, its volatility, and the timeframe you are trading. Thorough backtesting is crucial.
⚠ Context is Key: Volume Profile is powerful, but its signals are best interpreted within the broader market context (trend, news, other technical indicators).
⚠ Lookback vs. Profile Stability: A shorter lookback makes the profile very responsive to recent action but less stable. A longer lookback provides more stable levels but may lag in fast-moving markets.
⚠ Number of Rows: Higher row counts offer more granularity but can impact performance and may show too much noise. Lower row counts offer a broader view but may obscure finer details.
⚠ Alert Confirmation: Using " Once Per Bar Close " for alerts is generally recommended to ensure signals are based on confirmed price action.
█ RISK DISCLAIMER
Trading involves a substantial risk of loss and is not suitable for all investors. The Volume Profile (PRO) indicator is provided for educational and informational purposes only . It does NOT constitute financial advice or a recommendation to buy or sell any asset. Indicator signals identify potential patterns based on historical data but do not guarantee future price movements or profitability. Always conduct your own thorough research, utilize multiple sources of information, and implement robust risk management practices before making any trading decisions. Past performance is not indicative of future results.
📊 Happy trading! 🚀