StatPivot- Dynamic Range Analyzer - indicator [PresentTrading]Hello everyone! In the following few open scripts, I would like to share various statistical tools that benefit trading. For this time, it is a powerful indicator called StatPivot- Dynamic Range Analyzer that brings a whole new dimension to your technical analysis toolkit.
This tool goes beyond traditional pivot point analysis by providing comprehensive statistical insights about price movements, helping you identify high-probability trading opportunities based on historical data patterns rather than subjective interpretations. Whether you're a day trader, swing trader, or position trader, StatPivot's real-time percentile rankings give you a statistical edge in understanding exactly where current price action stands within historical contexts.
Welcome to share your opinions! Looking forward to sharing the next tool soon!
█ Introduction and How it is Different
StatPivot is an advanced technical analysis tool that revolutionizes retracement analysis. Unlike traditional pivot indicators that only show static support/resistance levels, StatPivot delivers dynamic statistical insights based on historical pivot patterns.
Its key innovation is real-time percentile calculation - while conventional tools require new pivot formations before updating (often too late for trading decisions), StatPivot continuously analyzes where current price stands within historical retracement distributions.
Furthermore, StatPivot provides comprehensive statistical metrics including mean, median, standard deviation, and percentile distributions of price movements, giving traders a probabilistic edge by revealing which price levels represent statistically significant zones for potential reversals or continuations. By transforming raw price data into statistical insights, StatPivot helps traders move beyond subjective price analysis to evidence-based decision making.
█ Strategy, How it Works: Detailed Explanation
🔶 Pivot Point Detection and Analysis
The core of StatPivot's functionality begins with identifying significant pivot points in the price structure. Using the parameters left and right, the indicator locates pivot highs and lows by examining a specified number of bars to the left and right of each potential pivot point:
Copyp_low = ta.pivotlow(low, left, right)
p_high = ta.pivothigh(high, left, right)
For a point to qualify as a pivot low, it must have left higher lows to its left and right higher lows to its right. Similarly, a pivot high must have left lower highs to its left and right lower highs to its right. This approach ensures that only significant turning points are recognized.
🔶 Percentage Change Calculation
Once pivot points are identified, StatPivot calculates the percentage changes between consecutive pivot points:
For drops (when a pivot low is lower than the previous pivot low):
CopydropPercent = (previous_pivot_low - current_pivot_low) / previous_pivot_low * 100
For rises (when a pivot high is higher than the previous pivot high):
CopyrisePercent = (current_pivot_high - previous_pivot_high) / previous_pivot_high * 100
These calculations quantify the magnitude of each market swing, allowing for statistical analysis of historical price movements.
🔶 Statistical Distribution Analysis
StatPivot computes comprehensive statistics on the historical distribution of drops and rises:
Average (Mean): The arithmetic mean of all recorded percentage changes
CopyavgDrop = array.avg(dropValues)
Median: The middle value when all percentage changes are arranged in order
CopymedianDrop = array.median(dropValues)
Standard Deviation: Measures the dispersion of percentage changes from the average
CopystdDevDrop = array.stdev(dropValues)
Percentiles (25th, 75th): Values below which 25% and 75% of observations fall
Copyq1 = array.get(sorted, math.floor(cnt * 0.25))
q3 = array.get(sorted, math.floor(cnt * 0.75))
VaR95: The maximum expected percentage drop with 95% confidence
Copyvar95D = array.get(sortedD, math.floor(nD * 0.95))
Coefficient of Variation (CV): Measures relative variability
CopycvD = stdDevDrop / avgDrop
These statistics provide a comprehensive view of market behavior, enabling traders to understand the typical ranges and extreme moves.
🔶 Real-time Percentile Ranking
StatPivot's most innovative feature is its real-time percentile calculation. For each current price, it calculates:
The percentage drop from the latest pivot high:
CopycurrentDropPct = (latestPivotHigh - close) / latestPivotHigh * 100
The percentage rise from the latest pivot low:
CopycurrentRisePct = (close - latestPivotLow) / latestPivotLow * 100
The percentile ranks of these values within the historical distribution:
CopyrealtimeDropRank = (count of historical drops <= currentDropPct) / total drops * 100
This calculation reveals exactly where the current price movement stands in relation to all historical movements, providing crucial context for decision-making.
🔶 Cluster Analysis
To identify the most common retracement zones, StatPivot performs a cluster analysis by dividing the range of historical drops into five equal intervals:
CopyrangeSize = maxVal - minVal
For each interval boundary:
Copyboundaries = minVal + rangeSize * i / 5
By counting the number of observations in each interval, the indicator identifies the most frequently occurring retracement zones, which often serve as significant support or resistance areas.
🔶 Expected Price Targets
Using the statistical data, StatPivot calculates expected price targets:
CopytargetBuyPrice = close * (1 - avgDrop / 100)
targetSellPrice = close * (1 + avgRise / 100)
These targets represent statistically probable price levels for potential entries and exits based on the average historical behavior of the market.
█ Trade Direction
StatPivot functions as an analytical tool rather than a direct trading signal generator, providing statistical insights that can be applied to various trading strategies. However, the data it generates can be interpreted for different trade directions:
For Long Trades:
Entry considerations: Look for price drops that reach the 70-80th percentile range in the historical distribution, suggesting a statistically significant retracement
Target setting: Use the Expected Sell price or consider the average rise percentage as a reasonable target
Risk management: Set stop losses below recent pivot lows or at a distance related to the statistical volatility (standard deviation)
For Short Trades:
Entry considerations: Look for price rises that reach the 70-80th percentile range, indicating an unusual extension
Target setting: Use the Expected Buy price or average drop percentage as a target
Risk management: Set stop losses above recent pivot highs or based on statistical measures of volatility
For Range Trading:
Use the most common drop and rise clusters to identify probable reversal zones
Trade bounces between these statistically significant levels
For Trend Following:
Confirm trend strength by analyzing consecutive higher pivot lows (uptrend) or lower pivot highs (downtrend)
Use lower percentile retracements (20-30th percentile) as entry opportunities in established trends
█ Usage
StatPivot offers multiple ways to integrate its statistical insights into your trading workflow:
Statistical Table Analysis: Review the comprehensive statistics displayed in the data table to understand the market's behavior. Pay particular attention to:
Average drop and rise percentages to set reasonable expectations
Standard deviation to gauge volatility
VaR95 for risk assessment
Real-time Percentile Monitoring: Watch the real-time percentile display to see where the current price movement stands within the historical distribution. This can help identify:
Extreme movements (90th+ percentile) that might indicate reversal opportunities
Typical retracements (40-60th percentile) that might continue further
Shallow pullbacks (10-30th percentile) that might represent continuation opportunities in trends
Support and Resistance Identification: Utilize the plotted pivot points as key support and resistance levels, especially when they align with statistically significant percentile ranges.
Target Price Setting: Use the expected buy and sell prices calculated from historical averages as initial targets for your trades.
Risk Management: Apply the statistical measurements like standard deviation and VaR95 to set appropriate stop loss levels that account for the market's historical volatility.
Pattern Recognition: Over time, learn to recognize when certain percentile levels consistently lead to reversals or continuations in your specific market, and develop personalized strategies based on these observations.
█ Default Settings
The default settings of StatPivot have been carefully calibrated to provide reliable statistical analysis across a variety of markets and timeframes, but understanding their effects allows for optimal customization:
Left Bars (30) and Right Bars (30): These parameters determine how pivot points are identified. With both set to 30 by default:
A pivot low must be the lowest point among 30 bars to its left and 30 bars to its right
A pivot high must be the highest point among 30 bars to its left and 30 bars to its right
Effect on performance: Larger values create fewer but more significant pivot points, reducing noise but potentially missing important market structures. Smaller values generate more pivot points, capturing more nuanced movements but potentially including noise.
Table Position (Top Right): Determines where the statistical data table appears on the chart.
Effect on performance: No impact on analytical performance, purely a visual preference.
Show Distribution Histogram (False): Controls whether the distribution histogram of drop percentages is displayed.
Effect on performance: Enabling this provides visual insight into the distribution of retracements but can clutter the chart.
Show Real-time Percentile (True): Toggles the display of real-time percentile rankings.
Effect on performance: A critical setting that enables the dynamic analysis of current price movements. Disabling this removes one of the key advantages of the indicator.
Real-time Percentile Display Mode (Label): Chooses between label display or indicator line for percentile rankings.
Effect on performance: Labels provide precise information at the current price point, while indicator lines show the evolution of percentile rankings over time.
Advanced Considerations for Settings Optimization:
Timeframe Adjustment: Higher timeframes generally benefit from larger Left/Right values to identify truly significant pivots, while lower timeframes may require smaller values to capture shorter-term swings.
Volatility-Based Tuning: In highly volatile markets, consider increasing the Left/Right values to filter out noise. In less volatile conditions, lower values can help identify more potential entry and exit points.
Market-Specific Optimization: Different markets (forex, stocks, commodities) display different retracement patterns. Monitor the statistics table to see if your market typically shows larger or smaller retracements than the current settings are optimized for.
Trading Style Alignment: Adjust the settings to match your trading timeframe. Day traders might prefer settings that identify shorter-term pivots (smaller Left/Right values), while swing traders benefit from more significant pivots (larger Left/Right values).
By understanding how these settings affect the analysis and customizing them to your specific market and trading style, you can maximize the effectiveness of StatPivot as a powerful statistical tool for identifying high-probability trading opportunities.
Pivotsupport

GOLDEN Trading System by @thejamiulThe Golden Trading System is a powerful trading indicator designed to help traders easily identify market conditions and potential breakout opportunities.
Source of this indicator :
This indicator is built on TradingView original pivot indicator but focuses exclusively on Camarilla pivots, utilising H3-H4 and L3-L4 as breakout zones.
Timeframe Selection:
Before start using it we should choose Pivot Resolution time-frame accordingly.
If you use 5min candle - use D
If you use 15min candle - use W
If you use 1H candle - use M
If you use 1D candle - use 12M
How It Works:
Sideways Market: If the price remains inside the H3-H4 as Green Band and L3-L4 as Red band, the market is considered range-bound.
Trending Market: If the price moves outside Green Band, it indicates a potential up-trend formation. If the price moves outside Red Band, it indicates a potential down-trend formation.
Additional Features:
Displays Daily, Weekly, Monthly, and Yearly Highs and Lows to help traders identify key support and resistance levels also helps spot potential trend reversal points based on historical price action. Suitable for both intraday and swing trading strategies.
This indicator is a trend-following and breakout confirmation tool, making it ideal for traders looking to improve their decision-making with clear, objective levels.
🔹 Note: This script is intended for educational purposes only and should not be considered financial advice. Always conduct your own research before making trading decisions.

Divergence Indicator Multi [TradingFinder] MACD AO RSI DIV Chart🔵 Introduction
🟣 What is Divergence in Financial Markets?
Divergence in technical analysis happens when the price of a stock moves in a direction opposite to certain indicators. This is a crucial concept in financial markets as it can signal either a trend reversal or a continuation of the current correction in the trend. Understanding divergence helps traders and analysts make more informed decisions.
🟣 Positive Regular Divergence (RD+)
A positive regular divergence occurs at the end of a downtrend, where two price lows form. This divergence appears when the price chart shows a new low, but the indicator does not follow, signaling potential buying opportunities.
Positive divergence indicates increased buying pressure and reduced selling pressure, making it a useful signal for forecasting price increases.
🟣 Negative Regular Divergence (RD-)
A negative regular divergence is seen during an uptrend when two price highs form. The price chart records a new high, but the indicator does not reflect this change, suggesting that a market downturn is likely.
This type of divergence shows strong selling pressure and weaker buying activity, which can help identify selling opportunities.
Both positive and negative divergences are powerful tools for identifying potential trend reversals and key support and resistance levels. For example, when an indicator trends upward while the price moves downward, this creates divergence, warning traders to reconsider their investment strategy.
🟣 Different Types of Divergence in Trading
1. Regular Divergence :
o Positive Regular Divergence (RD+)
o Negative Regular Divergence (RD-)
2. Hidden Divergence :
o Positive Hidden Divergence (HD+)
o Negative Hidden Divergence (HD-)
3.Time Divergence.
Note : This guide focuses specifically on Regular Divergence.
🟣 What is Regular Divergence?
Regular Divergence, often referred to as convergence, occurs when price action and indicators show conflicting patterns, usually signaling the end of a trend. Detecting regular divergence helps traders anticipate potential trend reversals or the formation of reversal patterns.
🔵 How to Use
To optimize the detection of divergence, you can adjust the Fractal Period to specify the length of time for identifying divergence patterns.
Additionally, with the Divergence Detection Method, you can select oscillators like the MACD, RSI, or AO to base divergence detection on.
Divergence in MACD :
MACD divergence occurs when the price chart forms an opposite pattern compared to the MACD line, indicating a potential price reversal.
Divergence in RSI :
In a downtrend, if the price chart forms two consecutive lows with the second lower than the first, but the RSI shows two lows with the second higher, this indicates positive regular divergence, which is a buy signal.
On the other hand, during an uptrend, if the price forms two highs with the second higher than the first, but the RSI shows the second high lower, this points to negative regular divergence, indicating a sell signal.
Divergence in AO (Awesome Oscillator) :
The AO indicator calculates histograms using the difference between 5-period and 34-period simple moving averages. It compares peaks and troughs of these histograms with price movements, detecting divergence and plotting lines and arrows to signal divergence.
🔵 Table
The following table breaks down the main features of the oscillator. It covers four critical categories: Exist, Consecutive, Divergence Quality, and Change Phase Indicator.
Exist : If divergence is detected, a "+" will appear in this row.
Consecutive: Shows the number of consecutive divergences that have formed in a short period.
Divergence Quality : Evaluates the quality of the divergence based on the number of occurrences. One is labeled "Normal," two are "Good," and three or more are considered "Strong."
Change Phase Indicator : If a phase change is detected between two oscillation peaks, this is marked in the table.

Pivot Data [QuantVue]The Pivot Data Indicator is designed to provide traders with valuable insights by identifying and analyzing pivot points on the price chart. It calculates both pivot highs and lows, then presents detailed statistics on the distance and time between these pivots.
a pivot point is defined as a specific point on the chart where the price either reaches a high or a low, with no bars higher or lower than it for a set number of bars on both sides (left and right). Essentially, it's a local high or low point, with the market moving in the opposite direction after the pivot forms.
For example:
A pivot high occurs when there are no bars with higher prices for a specified number of bars before and after that point.
A pivot low occurs when there are no bars with lower prices for the same number of bars on either side.
The number of bars to the left and right is adjustable via the Pivot Lookback Bars setting, allowing you to define how many bars are used to determine these pivot points.
Key features include:
Pivot Highs and Lows Identification: Automatically marks significant pivot highs and lows based on a user-defined lookback period, helping traders identify potential trend reversals or continuation points.
Prediction Labels: Provides forecasted pivot levels based on historical pivot price and time patterns, with options to show predictions for pivot highs, lows, or any pivot point.
Customizable Table Display: Displays a table summarizing important statistics, such as the average price percentage and the number of bars between pivots, along with the distance and time from the most recent pivot.
Traders can use this tool to map out potential levels of support and resistance based on historical data on pivot points.

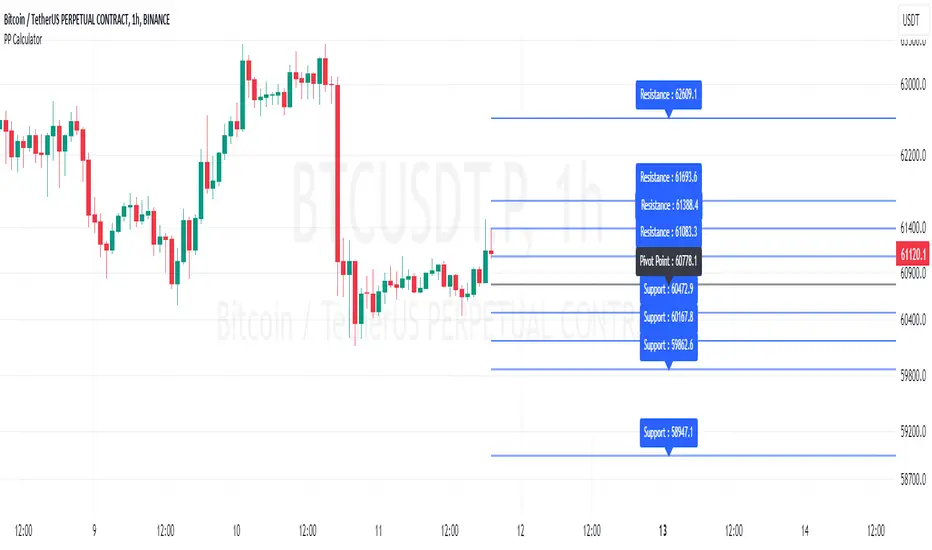
Pivot Points Level [TradingFinder] 4 Methods + Reversal lines🔵 Introduction
"Pivot Points" are places on the price chart where buyers and sellers are most active. Pivot points are calculated based on the previous day's price data and serve as reference points for traders to make decisions.
Types of Pivot Points :
Floor
Woodie
Camarilla
Fibonacci
🟣 Floor Pivot Points
Floor pivot points are widely used in technical analysis. The central pivot point (PP) serves as the main level of support or resistance, indicating the potential direction of the trend.
The first to third levels of resistance (R1, R2, R3) and support (S1, S2, S3) provide additional signals for potential trend reversals or continuations.
Floor Pivot Points Formula :
Pivot Point (PP): (H + L + C) / 3
First Resistance (R1): (2 * P) - L
Second Resistance (R2): P + H - L
Third Resistance (R3): H + 2 * (P - L)
First Support (S1): (2 * P) - H
Second Support (S2): P - H + L
Third Support (S3): L - 2 * (H - P)
🟣 Camarilla Pivot Points
Camarilla pivot points include eight levels that closely align with support and resistance. These points are particularly useful for setting stop-loss and profit targets.
Camarilla Pivot Points Formula :
Fourth Resistance (R4): (H - L) * 1.1 / 2 + C
Third Resistance (R3): (H - L) * 1.1 / 4 + C
Second Resistance (R2): (H - L) * 1.1 / 6 + C
First Resistance (R1): (H - L) * 1.1 / 12 + C
First Support (S1): C - (H - L) * 1.1 / 12
Second Support (S2): C - (H - L) * 1.1 / 6
Third Support (S3): C - (H - L) * 1.1 / 4
Fourth Support (S4): C - (H - L) * 1.1 / 2
🟣 Woodie Pivot Points
Woodie pivot points are similar to floor pivot points but place more emphasis on the closing price. This method often results in different pivot levels than the floor method.
Woodie Pivot Points Formula :
Pivot Point (PP): (H + L + 2 * C) / 4
First Resistance (R1): (2 * P) - L
Second Resistance (R2): P + H - L
First Support (S1): (2 * P) - H
Second Support (S2): P - H + L
🟣 Fibonacci Pivot Points
Fibonacci pivot points use the standard floor pivot points and then apply Fibonacci retracement levels to the range of the previous trading period. The common retracement levels used are 38.2%, 61.8%, and 100%.
Fibonacci Pivot Points Formula :
Pivot Point (PP): (H + L + C) / 3
Third Resistance (R3): PP + ((H - L) * 1.000)
Second Resistance (R2): PP + ((H - L) * 0.618)
First Resistance (R1): PP + ((H - L) * 0.382)
First Support (S1): PP - ((H - L) * 0.382)
Second Support (S2): PP - ((H - L) * 0.618)
Third Support (S3): PP - ((H - L) * 1.000)
These pivot point calculations help traders identify potential support and resistance levels, enabling more informed decision-making in their trading strategies.
🔵 How to Use
🟣 Two Methods for Trading Pivot Points
There are two primary methods for trading pivot points: trading with "pivot point breakouts" and trading with "price reversals."
🟣 Pivot Point Breakout
A breakout through pivot lines provides a significant signal to the trader, indicating a change in market sentiment. When an upward breakout occurs and the price crosses these lines, a trader can enter a long position and place their stop-loss below the pivot point (P).
Similarly, if a downward breakout happens, a short order can be placed below the pivot point.
When trading with pivot point breakouts, if the upward trend breaks, the first and second support levels can be the trader's profit targets. In a downward trend, the first and second resistance levels will serve this role.
🟣 Price Reversal
Another method for trading pivot points is waiting for the price to reverse from the support and resistance levels. To execute this strategy, one should trade in the opposite direction of the trend as the price reverses from the pivot point.
It's worth noting that although traders use this tool in higher time frames, it yields better results in shorter time frames such as one-hour, 30-minute, and 15-minute intervals.

Pivot Point Calculator [JP&Dia]English User Guide
Script Name: Pivot Point Calculator
What Does This Script Do? This script calculates classic and Camarilla pivot points used in financial markets. Pivot points are used to identify key support and resistance levels, and this script helps traders better understand market movements.
How to Use It?
Add the script to your charts on TradingView.
Enter your desired time frame in the “Enter Time Frame” field (e.g., M, W, D).
Choose either or both “Classic Pivot” and “Camarilla Pivot” options to display them.
The script will automatically calculate the pivot points and display them on the chart.
Why Is This Script Unique? This script combines both classic and Camarilla pivot calculations, allowing users to easily utilize both pivot styles through a single script.
How Can People Benefit? Traders can use this script to identify potential buy-sell points and market trends. They can also conduct their market analyses more efficiently and effectively.
Script Adı: Pivot Noktası Hesaplayıcı
Script Ne İşe Yarar? Bu script, finansal piyasalarda kullanılan klasik ve Camarilla pivot noktalarını hesaplar. Pivot noktaları, önemli destek ve direnç seviyelerini belirlemek için kullanılır ve bu script, yatırımcıların piyasa hareketlerini daha iyi anlamalarına yardımcı olur.
Nasıl Kullanılır?
Scripti TradingView’deki grafiklerinize ekleyin.
“Zaman Dilimi Girin” alanına istediğiniz zaman dilimini girin (Örneğin: M, W, D).
“Classic Pivot” ve “Camarilla Pivot” seçeneklerinden birini veya her ikisini de seçerek gösterilmesini sağlayabilirsiniz.
Script otomatik olarak pivot noktalarını hesaplayacak ve grafik üzerinde gösterecektir.
Neden Özgü Bir Script? Bu script, hem klasik hem de Camarilla pivot hesaplamalarını birleştirir ve kullanıcıların her iki pivot stilini de tek bir script üzerinden kolayca kullanmalarını sağlar.
İnsanlar Nasıl Faydalanabilir? Yatırımcılar, bu scripti kullanarak potansiyel alım-satım noktalarını ve piyasa trendlerini belirleyebilirler. Ayrıca, piyasa analizlerini daha verimli ve etkili bir şekilde yapabilirler.
K's Pivot PointsPivot points are a popular technical analysis tool used by traders to identify potential levels of support and resistance in a given timeframe. Pivot points are derived from previous price action and are used to estimate potential price levels where an asset may experience a reversal, breakout, or significant price movement.
The calculation of pivot points involves a simple formula that takes into account the high, low, and close prices from the previous trading session or a specific period. The most commonly used pivot point calculation method is the "Standard" or "Classic" method. Here's the formula:
Pivot Point (P) = (High + Low + Close) / 3
In addition to the pivot point itself, several support and resistance levels are calculated based on the pivot point value.
K's Pivot Points try to enhance them by incorporating multiple elements and by applying a re-integration strategy to validate two events:
* Found_Support: This event represents a basing market that is bound to recover or at least shape a bounce.
* Found_Resistance: This event represents a toppish market that is bound to consolidate or at least shape a pause.
K's Pivot Points are calculated following these steps:
1. Calculate the highest of highs for the previous 24 periods (preferably hours).
2. Calculate the lowest of lows for the previous 24 periods (preferably hours).
3. Calculate a 24-period (preferably hours) moving average of the close price.
4. Calculate K's Pivot Point as the average between the three previous step.
5. To find the support, use this formula: Support = (Lowest K's pivot point of the last 12 periods * 2) - Step 1
6. To find the resistance, use this formula: Resistance = (Highest K's pivot point of the last 12 periods * 2) - Step 2
The re-integration strategy to find support and resistance areas is as follows:
* A support has been found if the market breaks the support and shapes a close above it afterwards.
* A resistance has been found if the market surpasses the resistance and shapes a close below it afterwards.
The lookback period (whether 24 and 12) can be modified but the default versions work well.

Support Resistance - Dynamic v2 w/ Timeframe optionThis script is a modification from the awesome "Support Resistance - Dynamic v2" by @LonesomeTheBlue
This script is very similar to the original indicator mentioned above, but with a modification that, in my opinion, would be very useful for many traders. It enables the option to choose different timeframe to calculate the S/R levels. Very often, traders would like to use higher timeframes to define S/R levels, rather than using the same timeframe that they are trading at. For example, if trading at 5min, we often use 15min, 30min or 1hr timeframe to define our S/R levels.
For example, below shows S/R levels from three different timeframes:
Hope you find value in this indicator~ Enjoy~
CAT Month Opening RangeA trading range which is formed during the first three trading day of any month sets an important "Month Opening Range".
The lowest price made during the first three trading days can be considered the Monthly Support level (see the green line drawn by the indicator).
The highest price made during the first three trading days can be considered the Monthly Resistance level (see the red line drawn by the indicator).
In an Up trending market price tends to break over the upper edge of the Month Opening Range and keep moving higher at the very least until the middle of that month.
In an Up trending market once price broke out of the Month Opening Range, the Monthly Resistance level tends to work as a support.
In a Down trending market price tends to break under the lower edge of the Month Opening Range and keep moving higher at the very least until the middle of that month.
In a Down trending market once price broke under the Month Opening Range, the Monthly Support level tends to work as a resistance
There are may ways to use that instrument:
(1) Trend Confirmation.
The first three days of a month tends to bring volatile trading. The market sets boundaries for the following four trading weeks.
Once the range has been set, swing traders may wait for the market to break out of the range and consider that direction of the prevailing trend direction.
(2) Short "Failed Breakout" setup
Quite often price breaks out of the Month Opening Range on the fourth or fifth trading day of a month but then drops back into the range.
That failed breakout quite often is followed by decline back down to the Month Support level (the lower edge of the Month Opening Range).
(3) Long "Failed Breakdown" setup
Quite often price breaks down under the Month Support on the fourth or fifth trading day of a month but then pops back up over the Monthly Support.
That failed breakdown quite often is followed by a rally targeting to retest the Monthly Resistance (the red line).
The indicator generates signals, trade set-ups and alerts that are for educational and hypothetical purposes only and shall not be considered trade recommendations.
Any signals or trading setups drawn by the indicator is not to be construed as an offer to sell or the solicitation of an offer to buy, nor is it to be construed as a recommendation to buy, hold or sell (short or otherwise) any security. All users of the indicator must determine for themselves what specific investments to make or not make and are urged to consult with their own independent financial advisors with respect to any investment decision.

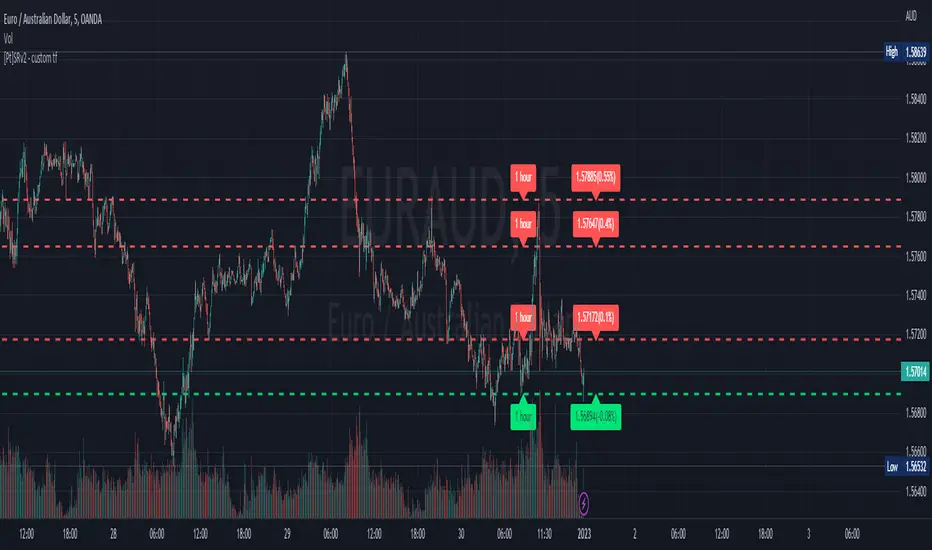
Pivot mtf semaphore support&resistance [LM]Hello Traders,
I would like to introduce you pivot semaphore mtf support&resistance levels. The idea is the same as my other S/R scripts to have a look at the important levels. The Semaphore is used to spot future multi-level Supports and Resistance zones. It is also useful to spot HL or LL or HH or LH zones. The script is based on amazing work of @LucF so really big thanks for your work on mtf line offsetting.
It has three settings:
First two settings are for higher timeframes
Third setting is setting for pivots on current timeframe
!!!! Very important is there is limitation in pinescript how many candles you can look back(4999) if you choose timeframes that are very distant from each other there is a chance that those lines won't show up
Hopefully you will enjoy
Cheers, Lukas

Turk Pivot Candle Order BlocksOrder Blocks based on pivot reversal candle
When a pivot High or Pivot Low is found and confirmed, a box will be plotted on the open and close values of that pivot candle
You also have the ability to change the amount of candles the box stretches over as well as the colors of the bullish and bearish boxes
How To Use:-
Pivot points often provide Support and Resistance points on their own,
one way of marking up order blocks is by taking the pivot candle and marking that up as a resistance area where you could be looking for price to reverse
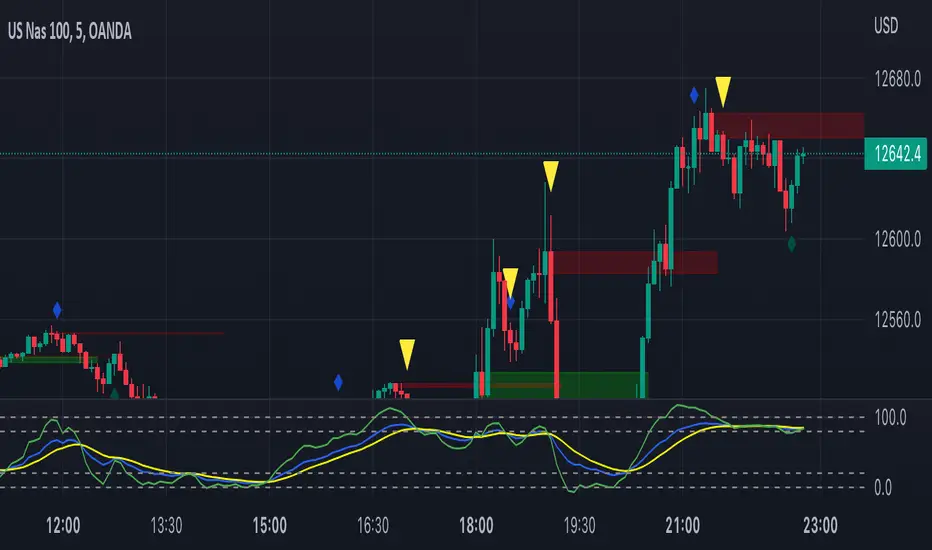
Customizable Pivot Support/Resistance Zones [MyTradingCoder]This script uses the standard pivot-high/pivot-low built-in methods to identify pivot points on the chart as a base calculation for the zones. Rather than displaying basic lines, it displays a zone from the original pivot point to the closest part of the available body on the same candle. The script comes in handy by utilizing Pinescripts available input.source() function to allow for an external indicators output value to be used within the indicator. Make sure to read all of the TOOLTIPS in the indicator settings menu to get a full understanding of what each setting does, and how it can affect the results that end up on the chart.
By enabling the custom filter in the indicator settings, you will notice you have the ability to filter out zones using an external indicator such as an RSI. Maybe you only want zones to be calculated/drawn when the RSI is overbought or oversold, or maybe you only want the zones to calculate/draw if the Supertrend is green or red. The list of possible filters that you can implement is too many to count. Feel free to play around with the indicator however you like, and configure something that you find to be the most useful for your trading.
On top of everything listed above, the indicator has pre-programmed built-in alertconditions so that you can potentially automate trading, or get a notification to your cell phone when a zone is being touched/broken.

Resistance/Support Indicator - FontiramisuIndicator showing resistances and support, based on pivots location
When a new pivot location is near from a resistance/support the latter gains weight.
You can modify multiple parameters :
Nb Max res/sup : Define the number max res/sup to keep in our res/sup history array. The greater it is the older bar index will be taken.
Nb show res/sup : Define the number of res/sup to be drawn.
Min weight shown : Define min res/sup weight to be shown. Weight is used to measure strengh of res/sup.
% range stack : Define price percentage change required to stack a pivot into an existing res/sup. Default is 0.015 = 1.5%.
Pivots are calculated with deviation parameter to validate with more precision.
Fontilab Library is used to code this indicator.

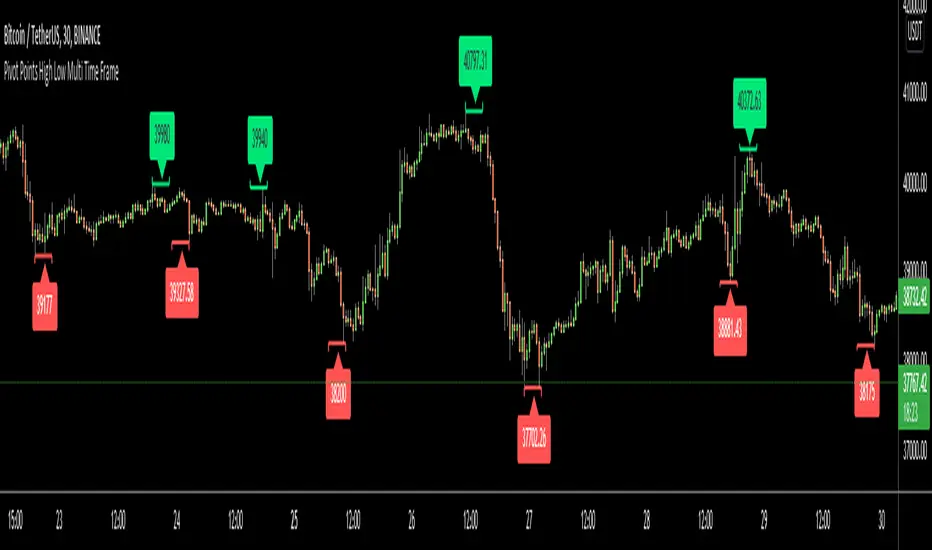
Pivot Points High Low Multi Time FrameHello All,
There are built-in and published Pivot Point High Low indicators in Public Library but as far as I see none of them is for Higher Time frames. so I decided to write & publish this script. I hope it would be useful while trading or developing your own scripts. I also did this to use in one of my future projects (we will see it in a few weeks/months ;) ).
I tried to make all settings optional, so you can play with them as you wish.
P.S. There is no control mechanism if the chart time frame is lower than the time frame in the options. So you better set higher time frame in the options than the chart time frame.
Enjoy!
Swing Pivots High LowBINANCE:BTCUSDT
This indicator is an opensource merge of the built in 'Pivot Points High Low' and the most popular 'Swing-high-low-support-resistance' indicators. The original 'Pivot Points High Low' does not have extensions with better visibility, while the most popular 'Swing-high-low-support-resistance' has no source available. I've also added additional configurable alert conditions for Pivot High and Low Crossover/Crossunder.
Please read the official documentation for further information about the indicator.

Pivot Support & ResistanceHere signals are based on the pivot high and pivot lows. Factors taken into account in understanding the breakout or breakdown are:
volume
candle bar is not opening candle
must be near pivot high or low
Recommendation:
Use once candle closes else you might get trapped in certain cases so be careful

Higher Time Frame Chart OverlayHello All,
This script gets OHLC values from any security and Higher/Same time frame you set, then creates the chart including last 10 candles. it shows Symbol name, Time Frame, Highest/Lowest level of last 10 candles and Close Price at the right side of the chart as well. Closing price text color changes by the real-time candle of the related symbol and time frame. The all this was made using the Tables in Pine and the chart location doesn't change even if you change the size of main chart window.
Almost everything can be change as you want. You can change/set:
- Colors of Body and Top/Bottom Wicks separately
- The Height of each Cell
- The Width of Body and Wicks
- The Background and Frame color
- Enable/disable Status Panel (if you disable Status Panel then only candle chart is shown)
- Location of Status Panel
- Text color and Text size
- The Background color of Status Panel
Some examples:
The info shown in Status Panel:
You can change The Height of each Cell and The Width of Body and Wicks
You can change colors:
You can change location of the chart:
If you add the script more than once then you can see the charts for different symbols and time frames: (This may slow down your chart)
If you right-click on the script and choose "Visual Order" => "Bring to front" then it will be better visually:
P.S. Using this script may slow down your chart, especially if you add it more than once
Enjoy!

3rd WaveHello All,
In Elliott Wave Theory, 3rd wave is not the shortest one in the waves 1/3/5 and it's usually longest one. so if we can catch it then we may get good opportunities to trade. This script finds 3rd wave experimentally. it can be also the 3rd waves in the waves 1, 3, 5, A and C. the 3rd wave should have greater volume than other waves, the script can check its volume and compare with the volumes of the waves 1 and 2 optionally.
Pine Team released Pine version 5! This script was developed in v5 and it uses Library feature of Pine v5 for the zigzag functions. This script is also an example for the Pine developers who learn Pine v5 and Libraries.
Options:
Zigzag Period: is the length that is used to calculate highest/lowest and the zigzag waves
Min/Max Retracements: is the retracement rates to check the wave 2 according to wave 1. for example; if min/max values are 0.500-0.618 then wave 2 must be minimum 0.500 of wave 1 and maximum 0.618 of wave 1.
Check Volume Support: is an option to compare the volumes of1. 2. and . waves. if you enable this option then the script checks their volume and 3rd wave volume must be greater then 1 and 2
there are 4 options for the targets. you can enable/disable and change their levels. targets are calculated using length of wave 1.
Options to show breakout zone, zigzag, wave 1 and 2.
and some options for the colors.
The Library that is used in this script:
P.S. This is an experimental work and can be improved. So do not hesitate to drop your comments under the script ;)
Enjoy!

CreateAndShowZigzagLibrary "CreateAndShowZigzag"
Functions in this library creates/updates zigzag array and shows the zigzag
getZigzag(zigzag, prd, max_array_size) calculates zigzag using period
Parameters:
zigzag : is the float array for the zigzag (should be defined like "var zigzag = array.new_float(0)"). each zigzag points contains 2 element: 1. price level of the zz point 2. bar_index of the zz point
prd : is the length to calculate zigzag waves by highest(prd)/lowest(prd)
max_array_size : is the maximum number of elements in zigzag, keep in mind each zigzag point contains 2 elements, so for example if it's 10 then zigzag has 10/2 => 5 zigzag points
Returns: dir that is the current direction of the zigzag
showZigzag(zigzag, oldzigzag, dir, upcol, dncol) this function shows zigzag
Parameters:
zigzag : is the float array for the zigzag (should be defined like "var zigzag = array.new_float(0)"). each zigzag points contains 2 element: 1. price level of the zz point 2. bar_index of the zz point
oldzigzag : is the float array for the zigzag, you get copy the zigzag array to oldzigzag by "oldzigzag = array.copy(zigzay)" before calling get_zigzag() function
dir : is the direction of the zigzag wave
upcol : is the color of the line if zigzag direction is up
dncol : is the color of the line if zigzag direction is down
Returns: null
ZigZag Chart with SupertrendHello All,
This script creates Zigzag Chart by using Zigzag waves, so it's timeless chart meaning that no time dependency on X-axis. Optionally it can calculate & show Zigzag Supertrend or Simple Moving Average. Also it can change bar colors of the main chart by trend direction of Zigzag Supertrend.
As seen below, each zigzag wave is a candle on Zigzag chart:
You have a few options and using these options you can find best settings for the securities/timeframes.
You can change Zigzag period, if you change Zigzag Period then all zigzag and the chart is recalculated/reconstructed.
You have option to show Zigzag Supertrend or Zigzag Moving Average, the options you have;
- You can change ATR Length and ATR multiplier for supertrend
- You can change Length for Simple Moving Average
You can change Zigzag candle & wick colors using options. Also you have option to change bar colors according to Zigzag Supertrend direction.
As it's timeless chart, below you can see how/when bar colors and Zigzag Supertrend change:
You can see Simple Moving Average of the Zigzag Candles:
You can play with ATR length and multiplier to find best supertrend:
You can play with the candle & wick colors:
Enjoy!

CPR by WsrWe recommend some preconditions for Intraday Trading Strategy with CPR (Central Pivot Range)
Rules For BUY Setup with CPR
1) Today's Pivot Level Should be higher than Previous Day's Pivot Level
2) The previous day's close should be near day's high.
Rules For SELL Setup with CPR
1) Today's Pivot Level Should be lower than Previous Day's Pivot Level
2) The previous day's close should be near day low.
CPR or central pivot range is the best tool available for the trader to see the price base indicator. You can use this tool i.e CPR (central pivot range) to check the price indicator in the stock market. You know the price of shares sometimes goes up or sometimes goes down in the stock market. So it will be best to stay updated and know it before the time the share market/stock market fall or rises.
Volume Profile / Fixed RangeHello All,
This script calculates and shows Volume Profile for the fixed range . Recently we have box.new() feature in Pine Language and it's used in this script as an example. Thanks to Pine Team and Tradingview!..
Sell/Buy volumes are calculated approximately!.
Options:
"Number of Bars" : Number of the bars that volume profile will be calculated/shown
"Row Size" : Number of the Rows
"Value Area Volume % " : the percent for Value Area
and there are other options for coloring and POC line style
Enjoy!

Pivot boxes [LM]Hello traders,
let me intoduce you pivot boxes. New features of pinescript that allows to render boxes enabled to highlight pivot zone. Range high or low is defined by pivot high or low and rangeLow and RangeHigh are defined by close of following candle.
It has two settings that you can change at your will, it also enables hide/show particular pivot setting
Hope you will enjoy as I enjoyed to write it.
Lukas
