Fibonacci Volume Profiles [AlgoAlpha]Unlock a deeper understanding of price action with the Fibonacci Volume Profiles indicator by AlgoAlpha! This powerful tool blends Fibonacci retracement levels with customizable volume profiles, helping traders identify high-probability areas of support, resistance, and accumulation. Designed for both continuous dynamic levels and custom time periods, this indicator is a must-have for traders seeking confluence in market structure analysis.
🔑 Key Features
📈 Dual Mode Selection : Choose between Continuous Fibonacci levels, which adapt dynamically to pivots, or a Custom Period mode, where you set your own start and end points.
📊 Integrated Volume Profile : Visualize volume distributions at key Fibonacci retracement levels, revealing areas of strong buying/selling interest.
🎨 Customizable Colors & Transparency : Adjust Fibonacci level colors, fill zones, and profile transparency for a visually clear experience.
🔍 Profile Resolution & Scaling : Control the number of price levels and width of the volume profile for detailed market insights.
🛠 Extendable Levels : Optionally extend Fibonacci levels to the right of the chart for better visualization of future price interaction.
📌 How to Use
Add the Indicator: Click on the star icon to add it to your favorites and apply it to your TradingView chart.
Analyze The Market: Observe how price interacts with Fibonacci levels alongside the volume profile to confirm support/resistance zones. Switch between custom range or continuous mode to align the tool with your trading style.
⚙️ How It Works
The indicator calculates pivot highs/lows dynamically (or uses user-defined time periods) to plot Fibonacci retracement levels. It then builds a volume profile by analyzing historical volume data, grouping it into price bins to highlight volume-heavy zones. The Point of Control (PoC) is identified as the level with the highest traded volume, acting as a key price magnet. The color-coded Fibonacci levels help traders spot retracement zones, while the volume profile confirms strength or weakness in those areas.
Pivot noktaları ve seviyeleri

Daily Time TheoryDaily Time Theory Indicator
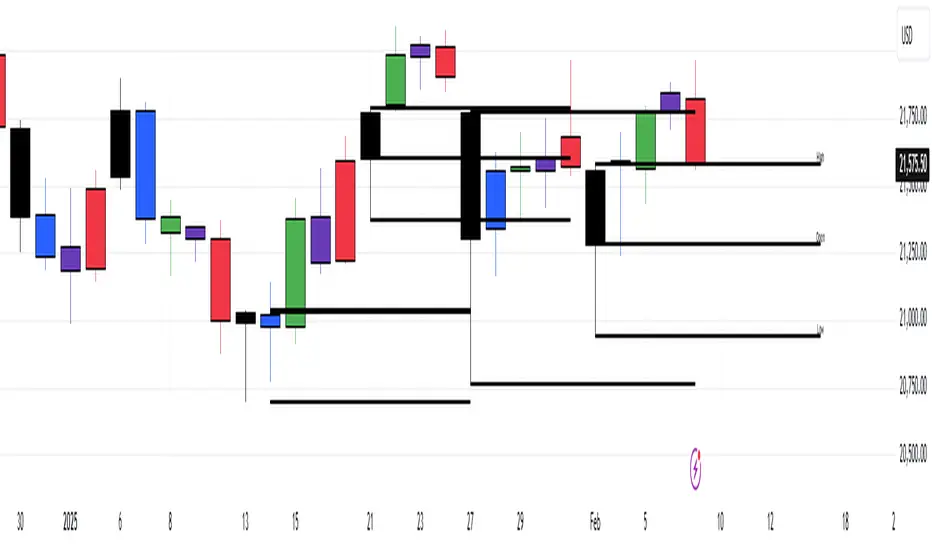
The Daily Time Theory indicator is a versatile tool designed exclusively for daily charts. It dynamically colors daily candles according to the day of the week using customizable colors, making it easy to visually distinguish between Monday through Friday. In addition, it provides the option to display horizontal lines for key price levels (Open, High, Low, and Close) for each day. These lines extend into the future for a user-defined number of weeks, giving traders a clear view of historical support and resistance levels.
Key Features:
Day-Based Candle Coloring:
Each weekday’s candles are automatically colored based on user-defined color settings (e.g. blue for Monday, green for Tuesday, etc.), enhancing chart clarity and enabling quick visual analysis of daily patterns.
Customizable Price Level Lines:
Traders can toggle on or off the display of the Open, High, Low, and Close price levels for each day. This allows you to focus on the specific data points that are most relevant to your trading strategy.
Extended Projections:
The indicator lets you extend the drawn price level lines for multiple weeks. This feature provides insight into historical price levels and helps identify potential support and resistance areas.
Tiny Labels for Clarity:
Each line drawn comes with a small, unobtrusive label at its far right that clearly indicates whether the line represents the Open, High, Low, or Close. This ensures that you always know which price level is being highlighted without cluttering the chart.
User-Friendly Input Grouping:
The inputs are neatly organized into groups by day, making it simple to adjust colors and toggle settings for each weekday independently.
How It Works:
The indicator automatically detects the current day on a daily chart and assigns a corresponding color to the candles.
It stores each day’s Open, High, Low, and Close values using persistent variables so that historical price levels remain visible.
When toggled on, horizontal lines representing the selected price levels are drawn across the chart. A tiny label is attached to the end of each line, indicating the type of price level.
The extended lines allow you to see how historical daily price levels may act as support or resistance in the future.
Usage Recommendations:
This indicator is best used on daily timeframes for markets with regular trading sessions. It is ideal for traders who wish to analyze intra-week price behavior, identify recurring support and resistance levels, and incorporate daily price structure into their trading strategy.
Position resetThe "Position Reset" indicator
The Position Reset indicator is a sophisticated technical analysis tool designed to identify possible entry points into short positions based on an analysis of market volatility and the behavior of various groups of bidders. The main purpose of this indicator is to provide traders with information about the current state of the market and help them decide whether to open short positions depending on the level of volatility and the mood of the main players.
The main components of the indicator:
1. Parameters for the RSI (Relative Strength Index):
The indicator uses two sets of parameters to calculate the RSI: one for bankers ("Banker"), the other for hot money ("Hot Money").
RSI for Bankers:
RSIBaseBanker: The baseline for calculating bankers' RSI. The default value is 50.
RSIPeriodBanker: The period for calculating the RSI for bankers. The default period is 14.
RSI for hot money:
RSIBaseHotMoney: The baseline for calculating the RSI of hot money. The default value is 30.
RSIPeriodHotMoney: The period for calculating the RSI for hot money. The default period is 21.
These parameters allow you to adjust the sensitivity of the indicator to the actions of different groups of market participants.
2. Sensitivity:
Sensitivity determines how strongly changes in the RSI will affect the final result of calculations. It is configured separately for bankers and hot money:
SensitivityBanker: Sensitivity for bankers' RSI. It is set to 2.0 by default.
SensitivityHotMoney: Sensitivity for hot money RSI. It is set to 1.0 by default.
Changing these parameters allows you to adapt the indicator to different market conditions and trader preferences.
3. Volatility Analysis:
Volatility is measured based on the length of the period, which is set by the volLength parameter. The default length is 30 candles. The indicator calculates the difference between the highest and lowest value for the specified period and divides this difference by the lowest value, thus obtaining the volatility coefficient.
Based on this coefficient, four levels of volatility are distinguished.:
Extreme volatility: The coefficient is greater than or equal to 0.25.
High volatility: The coefficient ranges from 0.125 to 0.2499.
Normal volatility: The coefficient ranges from 0.05 to 0.1249.
Low volatility: The coefficient is less than 0.0499.
Each level of volatility has its own significance for making decisions about entering a position.
4. Calculation functions:
The indicator uses several functions to process the RSI and volatility data.:
rsi_function: This function applies to every type of RSI (bankers and hot money). It adjusts the RSI value according to the set sensitivity and baseline, limiting the range of values from 0 to 20.
Moving Averages: Simple moving averages (SMA), exponential moving averages (EMA), and weighted moving averages (RMA) are used to smooth fluctuations. They are applied to different time intervals to obtain the average values of the RSI.
Thus, the indicator creates a comprehensive picture of market behavior, taking into account both short-term and long-term dynamics.
5. Bearish signals:
Bearish signals are considered situations when the RSI crosses certain levels simultaneously with a drop in indicators for both types of market participants (bankers and hot money).:
The bankers' RSI crossing is below the level of 8.5.
The current hot money RSI is less than 18.
The moving averages for banks and hot money are below their signal lines.
The RSI values for bankers are less than 5.
These conditions indicate a possible beginning of a downtrend.
6. Signal generation:
Depending on the current level of volatility and the presence of bearish signals, the indicator generates three types of signals:
Orange circle: Extremely high volatility and the presence of a bearish signal.
Yellow circle: High volatility and the presence of a bearish signal.
Green circle: Low volatility and the presence of a bearish signal.
These visual markers help the trader to quickly understand what level of risk accompanies each specific signal.
7. Notifications:
The indicator supports the function of sending notifications when one of the three types of signals occurs. The notification contains a brief description of the conditions under which the signal was generated, which allows the trader to respond promptly to a change in the market situation.
Advantages of using the "Position Reset" indicator:
Multi-level analysis: The indicator combines technical analysis (RSI) and volatility assessment, providing a comprehensive view of the current market situation.
Flexibility of settings: The ability to adjust the sensitivity parameters and the RSI baselines allows you to adapt the indicator to any market conditions and personal preferences of the trader.
Clear visualization: The use of colored labels on the chart simplifies the perception of information and helps to quickly identify key points for entering a trade.
Notification support: The notification sending feature makes it much easier to monitor the market, allowing you to respond to important events in time.

Fixed Gap Price LevelsIndicator Description:
The Fixed Gap Price Levels indicator draws horizontal price levels at user-defined intervals on the chart.
Users can select a starting price level (e.g., 71 or 2.1).
Lines are drawn at fixed gaps (e.g., if 71 is chosen, lines appear at 71, 142, 213, etc.).
An optional midpoint line can be enabled to appear halfway between the main levels.
Customizable colors for both main and midpoint lines.
Lines extend across the entire screen for easy visualization of price levels.
This tool helps traders quickly identify key price levels based on predefined spacing, aiding in technical analysis.

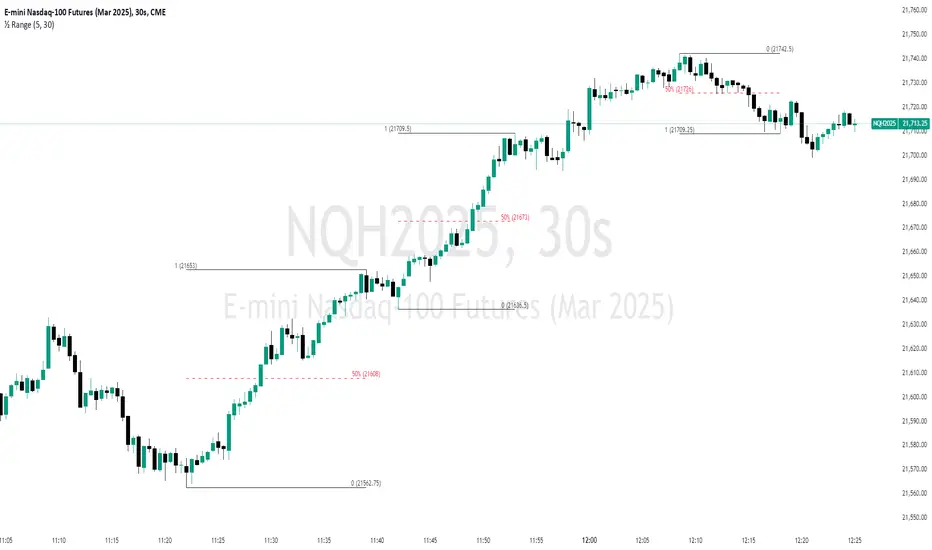
Unmitigated 50% of the RangeThis indicator is designed to display unmitigated 50% zones of price ranges within two swing (High and Low) points. The 50% level serves as a probable target for retracements before the price resumes its movement in the direction of the most recent swing. The underlying theory is that Price Action tends to correct unbalanced price zones by returning to 50% of the range.
The indicator identifies highs and lows utilizing the “Left Swing Sensitivity” setting, which detects the high/low points within the specified number of bars. It then ensures that the zone meets a minimum size requirement, configured via the “Minimum Leg Size” setting, to filter out smaller legs/zones that would not provide sufficient profit and loss opportunities for entries at 50% and take profit at the most recent swing point.
To prevent duplication of zones when the price is gradually moving up, an "Auto Adjust Levels" setting is available. Enabled by default, this feature automatically cleans up smaller zones, retaining only the primary zone between the most recent swing point and the outer swing.
Additionally, the indicator automatically removes mitigated zones where the price has returned to the 50% level, thus maintaining clean charts.
There are several visualization settings available, offering comprehensive control over what is displayed on the charts:
Control the color and style of the lines representing the 1, 0, and 50% levels.
Choose whether to display labels and if they should show the price at the rendered levels.
Optionally extend the lines/labels to the right for each level.
Killzones & Previous High-Low Liquidity [odnac]This indicator is designed for use in intraday trading to visualize key "Killzones" (specific time windows during different global market sessions) and highlight liquidity levels based on previous highs and lows from the previous day and week.
It helps traders identify potential market entry and exit points based on time-based trading zones and price action levels.
Key Features:
Killzone (Market Session Timeframes):
Asia (2000-0000 UTC): Displays a shaded box over the Asia trading session.
Europe (0200-0500 UTC): Highlights the European trading session.
New York AM (0830-1100 UTC): Represents the morning session of the NY market.
New York PM (1330-1600 UTC): Represents the afternoon session of the NY market.
Each of these timeframes can be customized in terms of session start and end times, and the shaded areas will help identify high liquidity periods when the market tends to be more active.
Previous High-Low Liquidity Zones:
Previous Week's High/Low: Displays lines at the high and low of the previous week.
These are important liquidity levels that can influence price action.
Previous Day's High/Low: Shows the high and low from the previous trading day.
These are also significant levels to watch for potential support and resistance.
Filters and Customization:
Position Filtering: The indicator allows users to filter out previous highs or lows if the current price doesn't align with those levels.
For example, it can filter out previous week highs if the current price is lower than that level.
Vertical Lines: Optional vertical lines to highlight key time points such as the start and end of the previous week and day.
How It Works:
The indicator visually draws "killzones" as shaded regions on the chart, indicating periods of increased market activity.
This can help traders align their strategies with the most liquid periods of the day.
The previous high and low lines (both for the previous week and the previous day) are drawn as solid lines and can be toggled on/off in the settings.
Labels are added to indicate the specific levels and periods.
The indicator provides clear visual cues, helping traders assess if the price is near important liquidity levels and whether the current market conditions align with those levels.
Customizable Settings:
You can control whether each Killzone and liquidity level is shown on the chart.
Color customization for the various zones and lines is also available.
The indicator also lets you decide whether to hide weekend data, set time-frame limits, and choose whether or not to show vertical lines at the beginning and end of each trading session.
This indicator is aimed at traders who want to trade based on high-liquidity periods and understand where key support and resistance levels are likely to emerge based on previous price action.

CandelaCharts - Fib Retracement (OTE) 📝 Overview
The CandelaCharts Fib Retracement (OTE) indicator is a precision tool designed to help traders identify Optimal Trade Entry (OTE) levels based on Fibonacci retracement principles, as taught in ICT (Inner Circle Trader) methodology.
This indicator automatically plots Fibonacci retracement levels between a selected swing high and swing low, highlighting the key OTE zone between the 61.8% and 78.6% retracement levels—a prime area for potential reversals in trending markets.
📦 Features
Automatic & Custom lookback modes
Customizable fib levels
Dynamic coloring
Reverse & extend
⚙️ Settings
Lookback: Controls the number of bars to look back. You can choose between **Automatic** or **Custom** mode.
Line Style: Sets the line style for the Fibonacci levels.
Levels: 0, 0.236, 0.0.382, 0.500, 0.620, 0.705, 0.790, 0.886, 1.000. Allows you to toggle the visibility of Fibonacci levels.
Dynamic Coloring: Colors Fibonacci levels according to trend direction.
Show Labels: Shows the price value at each Fibonacci level.
Reverse: Flips the Fibonacci levels in the opposite direction.
Extend Left: Extends the Fibonacci levels to the left.
⚡️ Showcase
Dynamic Coloring
Manual Coloring
Fib Retracement
Extended
Custom Length
📒 Usage
Using the CandelaCharts Fib Retracement (OTE) is pretty straightforward—just follow these steps to spot high-probability trade setups and refine your entries.
Identify the Trend – Determine whether the market is in an uptrend or downtrend.
Select Swing Points – The indicator automatically plots from the most recent swing high to swing low (or vice versa).
Wait for Price to Enter OTE Zone – Look for price action confirmation within the optimal entry zone (61.8%-78.6%).
Enter the Trade – Consider longs in an uptrend at the OTE zone, and shorts in a downtrend.
Set Stop & Target – Place stops below/above the swing low/high and target extension levels (127.2%, 161.8%).
🎯 Key takeways
The CandelaCharts Fib Retracement (OTE) is a must-have tool for traders looking to refine their entries and maximize risk-reward potential with precision-based ICT trading strategies. 🚀
🚨 Alerts
The indicator does not provide any alerts!
⚠️ Disclaimer
Trading involves significant risk, and many participants may incur losses. The content on this site is not intended as financial advice and should not be interpreted as such. Decisions to buy, sell, hold, or trade securities, commodities, or other financial instruments carry inherent risks and are best made with guidance from qualified financial professionals. Past performance is not indicative of future results.

Pivot Breakouts with MA FilterPivot Breakouts with MA Filter
This script identifies pivot breakouts (both bullish and bearish) using support and resistance levels and overlays breakout labels, arrows, and customizable Moving Averages. It allows traders to fine-tune their analysis with multiple options to customize the display and behavior of the breakout signals.
Key Features:
Pivot Support and Resistance:
Support is defined by the lowest low in a given range (using the lookback period).
Resistance is defined by the highest high in a given range (using the lookback period).
The script draws support and resistance boxes on the chart when these levels change, providing clear visual markers for potential breakout areas.
Breakout Detection:
Bullish Breakout: A breakout above resistance and the price is above the selected moving average (MA).
Bearish Breakout: A breakdown below support and the price is below the selected MA.
Breakout events trigger labels indicating "Resistance Breakout" (for bullish) and "Support Breakout" (for bearish).
The option to show Breakout Labels (with customizable colors) is available in the settings.
Moving Average Filter:
You can select the type of moving average (SMA or EMA) to use for filtering breakout signals.
MA Filter Length: This input allows you to set the period of the moving average to act as a filter for breakout conditions. This helps ensure the breakout aligns with the broader trend.
Multiple Moving Averages (Optional):
You can add up to four different moving averages (SMA or EMA), each with its own length and color.
You have the option to toggle each moving average on or off and adjust their appearance settings (color and length).
The script supports dynamic plots for each moving average, helping to visualize multiple trends at once.
Breakout Arrows:
The script can display arrows (or other shapes) below the bar for bullish breakouts and above the bar for bearish breakouts.
Arrows are optional and can be turned on/off in the settings.
You can customize the shape of the arrows (e.g., arrow, circle, square, or even a large or small triangle).
Customizable Colors and Labels:
The color of the breakout labels and arrows can be customized in the settings to make them fit your chart's style and personal preferences.
Alerts:
Alerts can be set for new support and resistance levels, as well as when breakouts occur (either bullish or bearish).
The alert system helps to notify traders when significant price action takes place without needing to constantly monitor the chart.
Settings:
Select Moving Average Type (SMA or EMA)
MA Filter Length: Length of the moving average used for filtering breakout conditions.
Lookback Range: Determines the range over which the pivot points (support and resistance) are calculated.
Breakout Labels: Option to turn on/off breakout labels, and customize label colors.
Show Breakout Arrows: Enable or disable breakout arrows with shape options (arrow, circle, square, large triangle, small triangle).
Multiple Moving Averages: Option to show up to 4 MAs with customizable colors and lengths.

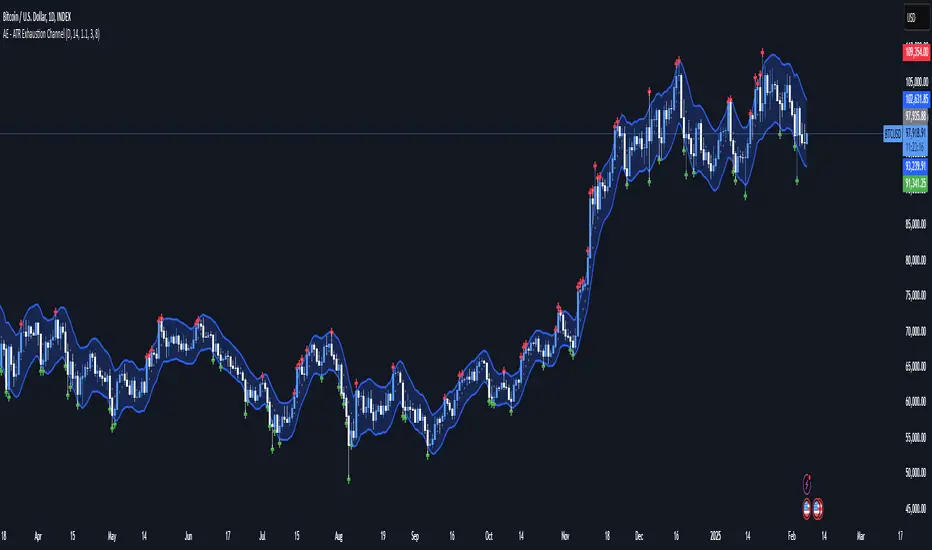
AE - ATR Exhaustion ChannelAE - ATR Exhaustion Channel
📈 Overview
Identify Exhaustion Zones & Trend Breakouts with ATR Precision!
The AE - ATR Exhaustion Channel is a powerful volatility-based trading tool that combines an averaged SMA with ATR bands to dynamically highlight potential trend exhaustion zones. It provides real-time breakout detection by marking when price moves beyond key volatility bands, helping traders spot overextensions and reversals with ease.
🔑 Key Features
✔️ ATR-SMA Hybrid Channel: Uses an averaged SMA as the core trend filter while incorporating adaptive ATR-based bands for precise volatility tracking.
✔️ Dynamic Exhaustion Markers: Marks red crosses when price exceeds the upper band and green crosses when price drops below the lower band.
✔️ Customizable ATR Sensitivity: Adjust the ATR multiplier and length settings to fine-tune band sensitivity based on market conditions.
✔️ Clear Channel Visualization: A gray SMA midpoint and a blue-filled ATR band zone make it easy to track market structure.
📚 How It Works
1️⃣ Averaged SMA Calculation: The script calculates an averaged SMA over a user-defined range (min/max period). This smooths out short-term fluctuations while preserving trend direction.
2️⃣ ATR Band Construction: The ATR value (adjusted by a multiplier) is added to/subtracted from the SMA to form dynamic upper and lower volatility bands.
3️⃣ Exhaustion Detection:
If high > upper ATR band, a red cross is plotted (potential overextension).
If low < lower ATR band, a green cross is plotted (potential reversal zone).
4️⃣ Filled ATR Channel: The area between the upper and lower bands is shaded blue, providing a visual trading range.
🎨 Customization & Settings
⚙️ ATR Length – Adjusts the ATR calculation period (default: 14).
⚙️ ATR Multiplier – Scales the ATR bands for tighter or wider volatility tracking (default: 0.8, adjustable in 0.1 steps).
⚙️ SMA Range (Min/Max Length) – Defines the period range for calculating the averaged SMA (default: 5-20).
⚙️ Rolling Lookback Length – Controls how far back the high/low comparison is calculated (default: 50 bars).
🚀 Practical Usage
📌 Spotting Exhaustion Zones – Look for red/green markers appearing outside the ATR bands, signaling potential trend exhaustion and possible reversal opportunities.
📌 Breakout Confirmation – Price consistently breaching the upper band with momentum could indicate continuation, while repeated touches without strong closes may hint at reversal zones.
📌 Trend Reversal Signals – Watch for green markers below the lower band in uptrends (buy signals) and red markers above the upper band in downtrends (sell signals).
🔔 Alerts & Notifications
📢 Set Alerts for Exhaustion Signals!
Traders can configure alerts to trigger when price breaches the ATR bands, allowing for instant notifications when volatility-based exhaustion is detected.
📊 Example Scenarios
✔ Trend Exhaustion in Overextended Moves – A series of red crosses near resistance may indicate a short opportunity.
✔ Trend Exhaustion in Overextended Moves – A series of red crosses near resistance may indicate an opportunity to open a short trade.
✔ Volatility Compression Breakouts – If price consolidates within the ATR bands and suddenly breaks out, it could signify a momentum shift.
✔ Reversal Catching in Trending Markets – Spot potential trend reversals by looking for green markers below the ATR bands in bullish markets.
🌟 Why Choose AE - ATR Exhaustion Channel?
Trade with Confidence. Spot Volatility. Catch Breakouts.
The AE - ATR Exhaustion Channel is an essential tool for traders looking to identify trend exhaustion, detect breakouts, and manage volatility effectively. Whether you're trading stocks, crypto, or forex, this ATR-SMA hybrid system provides clear visual cues to help you stay ahead of market moves.
✅ Customizable to Fit Any Market
✅ Combines Volatility & Trend Analysis
✅ Easy-to-Use with Instant Breakout Detection
Liquidity ZonesLiquidity Zones Indicator
The Liquidity Zones indicator is a custom Pine Script™ tool designed to identify significant price levels where high trading volume has occurred. These zones often act as support or resistance levels, providing valuable insights for traders.
Key Features:
Window Size: The number of bars to consider for calculating the moving averages and identifying peaks.
Tolerance: The allowable percentage difference to consider peaks as unique.
Number of Peaks: The maximum number of significant peaks to identify.
Minimum Volume: The minimum volume threshold relative to the average volume to consider a peak.
Minimum Range: The minimum price range to consider a peak.
How It Works:
Input Parameters: The user can customize the window size, tolerance, number of peaks, minimum volume, and minimum range.
Moving Averages: The script calculates the simple moving average (SMA) of the volume and closing prices over the specified window.
Peak Identification:
For each bar, the script identifies the bar with the highest volume within the window.
It checks if the volume exceeds the minimum volume threshold.
It determines the peak price based on whether the bar closed higher or lower than it opened.
It ensures the price range of the bar exceeds the minimum range.
It checks if the peak is above the SMA of the closing prices.
It verifies the peak is unique within the specified tolerance.
Plotting Peaks: The identified peaks are plotted on the chart with lines and labels, color-coded based on whether the bar closed higher (green) or lower (red).
This indicator helps traders visualize key liquidity zones, aiding in making informed trading decisions.

[AcerX] Leverage, TP & Optimal TP CalculatorHow It Works
Inputs:
Portfolio Allocation (%): The percentage of your portfolio you're willing to risk on the trade.
Stop Loss (%): The stop loss distance below the entry price.
Taker Fee (%) and Maker Fee (%): The fees applied on entry and exit.
Calculations:
The script calculates the required "raw" leverage to risk 1% of your portfolio.
It floors the computed leverage to an integer ("effectiveLeverage").
If the computed leverage is less than 1, it shows an error message (and suggests the maximum allocation for at least 1× leverage).
Otherwise, it calculates the TP levels for target profits of 1.2%, 1.5%, and 2%, and an "Optimal TP" that nets a 1% profit after fees.
Display:
A table is drawn on the top right corner of your chart displaying the effective leverage, the TP levels, and an error message if applicable.
Simply add this script as a new indicator in TradingView, and adjust the inputs as needed.
Happy trading!

Discount/Premium OTE LevelsThis indicator is created to identify discount/premium areas to provide additional confluence to trades taken. The underlying theory is that the trades taken in discounted areas are likely to have less risk due to a smaller stop loss and a higher reward/risk ratio.
The indicator operates by first identifying a zone between the last major swing high and low. These highs and lows are determined as price points that at the extremes within the number of bars to the left, as defined by the "Swing Sensitivity" setting.
Once a price zone is established, the indicator verifies that the zone meets the minimum size in points as configured via the "Minimum size" setting to be considered tradable. Zones that are too small may not provide a sufficient range even for scalping. The default value is 42 points based on Nasdaq, which means that the distance between inner most OTE levels (0.382 and 0.618) is at least 10 points.
When a valid zone is identified, it is then subdivided into areas of interest based on OTE levels, which can be configured/adjusted via the "Levels to Draw" setting. These levels represent the midpoint (50%), which distinguishes between premium and discount, and the three OTE levels 0.79, 0.705, 0.618, above the 50% for discount and below the 50% for premium.
For example, if a zone is formed initially by a swing low followed by a swing high with the assumption that the draw is higher, the indicator can be used to formulate long positions from below the 50% level starting at 0.38 OTE level, or ideally at 0.295 OTE level using 0 as a stop loss. Alternatively, if the 50% level is not yet tapped, short scalp positions can be made from 0.79-0.618 OTE levels with 50% as a partial or TP target.
See for long/short example
Typically, the indicator will show only a single zone. However, there may be cases with two zones: one larger parent zone containing a smaller, valid price zone within itself.
The indicator will automatically invalidate and remove the zone once the high/low of the zone is invalidated.
Configuration:
The indicator provides several visualization options for customization, including:
Color settings for OTE levels, with separate settings for edge/50% color, premium, and discount levels.
Settings for line style for OTE levels.
Settings to determine whether to show prices on level labels.
Settings to decide if lines should be extended to the right.

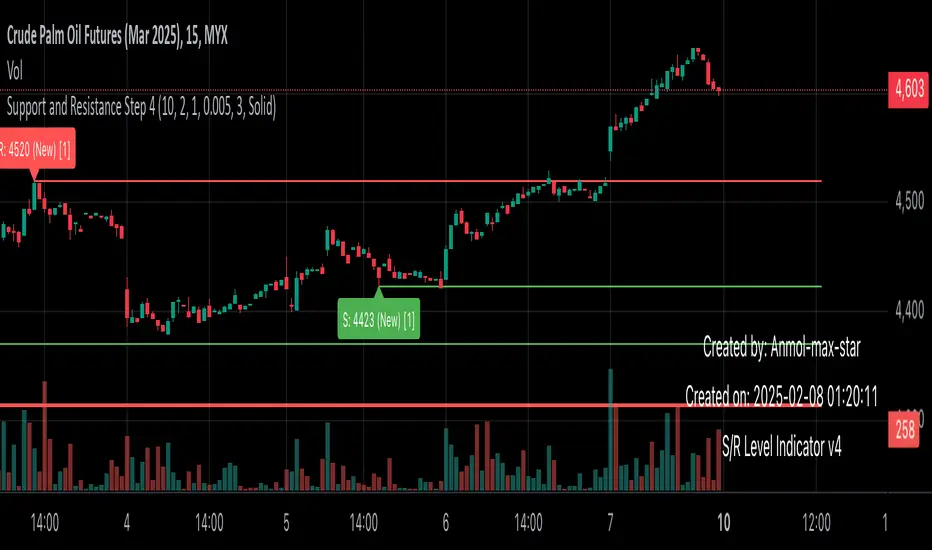
Support and Resistance all in one The Support and Resistance Indicator (v4) is designed to identify and track key price levels in financial markets. Here's how it works:
Core Functionality
Level Detection
Uses pivot points to identify significant price levels
Looks for swing highs (resistance) and swing lows (support)
Requires price action to pivot over a specified period (default 10 bars)
Dynamic Level Management
Maintains separate arrays for support and resistance levels
Limits maximum displayed levels (default 10) to prevent chart clutter
Removes oldest levels when maximum is reached
Ensures new levels are sufficiently distant from existing ones (minimum 1% separation)
Touch Detection System
Monitors price interaction with established levels
Counts when price comes within 0.1% of any level
Updates touch count and strength classification
Categories: "New" (1 touch), "Moderate" (2 touches), "Strong" (3+ touches)
Visual Representation
Draws horizontal lines at each level
Updates line width based on strength (thicker for stronger levels)
Shows labels with price and strength information
Color coding: Red (new/moderate levels), Green (strong levels)
Displays triangles (▼▲) at pivot points
Trading Applications
Support/Resistance Trading
Strong levels (3+ touches) suggest reliable trading zones
More touches indicate higher probability reversal points
Use for stop loss and target placement
Breakout Trading
Monitor breaks of strong levels
Higher touch count suggests more significant breakouts
Watch for false breakouts at weaker levels
Risk Management
Place stops beyond strong levels
Use level strength to adjust position size
Consider multiple timeframe analysis
Best Practices
Use with other indicators for confirmation
Consider market context and trend
Monitor level strength development
Don't rely solely on touch count
Watch for price reaction at levels
Customization Options
Adjust pivot length for different timeframes
Modify minimum distance between levels
Change required touches for "Strong" classification
Toggle strength labels display
Choose line style (Solid/Dashed/Dotted)
This indicator helps identify key price levels where market participants have shown interest, making it valuable for trade planning and risk management
Swing Breakout System (SBS)The Swing Breakout Sequence (SBS) is a trading strategy that focuses on identifying high-probability entry points based on a specific pattern of price swings. This indicator will identify these patterns, then draw lines and labels to show confirmation.
How To Use:
The indicator will show both Bullish and Bearish SBS patterns.
Bullish Pattern is made up of 6 points: Low (0), HH (1), LL (2 | but higher than initial Low), New HH (3), LL (5), LL again (5)
Bearish Patten is made up of 6 points: High (0), LL (1), HH (2 | but lower than initial high), New LL (3), HH (5), HH again (5)
A label with an arrow will appear at the end, showing the completion of a successful sequence
Idea behind the strategy:
The idea behind this strategy, is the accumulation and then manipulation of liquidity throughout the sequence. For example, during SBS sequence, liquidity is accumulated during step (2), then price will push away to make a new high/low (step 3), after making a minor new high/low, price will retrace breaking the key level set up in step (2). This is price manipulating taking liquidity from behind high/low from step (2). After taking liquidity price the idea is price will continue in the original direction.
Step 0 - Setting up initial direction
Step 1 - Setting up initial direction
Step 2 - Key low/high establishing liquidity
Step 3 - Failed New high/low
Step 4 - Taking liquidity from step (2)
Step 5 - Taking liquidity from step 2 and 4
Pattern Detection:
- Uses pivot high/low points to identify swing patterns
- Stores 6 consecutive swing points in arrays
- Identifies two types of patterns:
1. Bullish Pattern: A specific sequence of higher lows and higher highs
2. Bearish Pattern: A specific sequence of lower highs and lower lows
Note: Because the indicator is identifying a perfect sequence of 6 steps, set ups may not appear frequently.
Visualization:
- Draws connecting lines between swing points
- Labels each point numerically (optional)
- Shows breakout arrows (↑ for bullish, ↓ for bearish)
- Generates alerts on valid breakouts
User Input Settings:
Core Parameters
1. Pivot Lookback Period (default: 2)
- Controls how many bars to look back/forward for pivot point detection
- Higher values create fewer but more significant pivot points
2. Minimum Pattern Height % (default: 0.1)
- Minimum required height of the pattern as a percentage of price
- Filters out insignificant patterns
3. Maximum Pattern Width (bars) (default: 50)
- Maximum allowed width of the pattern in bars
- Helps exclude patterns that form over too long a period

HTF EMA Pivot PointsHTF EMA Pivot Points - TradingView Indicator
📌 Overview
The HTF EMA Pivot Points indicator displays Exponential Moving Averages (EMAs) from higher timeframes (HTF) on your current chart. These EMAs act as dynamic support and resistance levels, helping traders identify key areas where price is likely to react.
⚡ Key Features
✅ Plots EMAs from multiple timeframes (1H, 4H, Daily)
✅ Works on any chart (1M, 5M, 15M, etc.)
✅ Acts as pivot points for price action, helping with trade entries & exits
✅ Customizable EMA lengths for flexibility
✅ Ideal for scalping, 0DTE options trading, and swing trading
🛠 How It Works
The script calculates EMAs from 1H, 4H, and Daily charts and overlays them on your current timeframe. These levels often act as support and resistance zones, where price tends to bounce or reject.
🎯 How to Use It for Trading
📍 Bullish Setup (Buy Calls)
• Price bounces off a higher timeframe EMA (e.g., 4H or Daily EMA)
• Confirmation with RSI or Fair Value Gaps (FVGs)
📍 Bearish Setup (Buy Puts)
• Price rejects from a higher timeframe EMA
• Confirmation with other indicators (RSI, MACD, Order Flow)
🚀 Why Use This Indicator?
• Filters out noise from lower timeframe EMAs
• Confirms trend direction using key moving averages
• Helps avoid false breakouts by identifying strong institutional levels
This is a must-have tool for traders who rely on higher timeframe confluence for scalping, options trading, or swing trading. 📈🔥

Pivot Point+ Supertrend + EMA + Support/Resistance- LAXMANTAK98
Pivot Point Supertrend with EMA and Support/Resistance Indicator
This custom trading indicator combines the following key components to assist in market analysis and trade decision-making:
Pivot Points:
Pivot points are calculated based on a chosen price source (High, Low, Open, or Close). These levels are used to determine potential support and resistance zones.
Pivot Highs (Resistance) and Pivot Lows (Support) are plotted as labels on the chart for easy identification.
Supertrend Indicator:
The Supertrend is a trend-following indicator that helps to identify bullish or bearish trends.
It uses the Average True Range (ATR) to calculate dynamic support/resistance levels, with adjustable settings for ATR length and multiplier factor.
The trend direction is visually represented by green (bullish) and red (bearish) lines on the chart.
Exponential Moving Averages (EMA):
The indicator plots up to four EMAs with user-defined periods (e.g., 9, 21, 50, 200).
EMAs are commonly used to smooth out price data and identify trends over various timeframes.
Support and Resistance Levels:
Based on Pivot Points, support and resistance levels are plotted using crosses on the chart.
These levels indicate possible price reversal points, helping traders spot key zones for entry and exit.
Visual Alerts:
The indicator includes built-in alerts for trend changes and potential buy/sell signals based on the transition between uptrend and downtrend states.
This combined indicator allows traders to analyze trends, identify key levels for trading, and make more informed decisions by integrating Pivot Points, Supertrend, EMAs, and Support/Resistance in one cohesive system.
