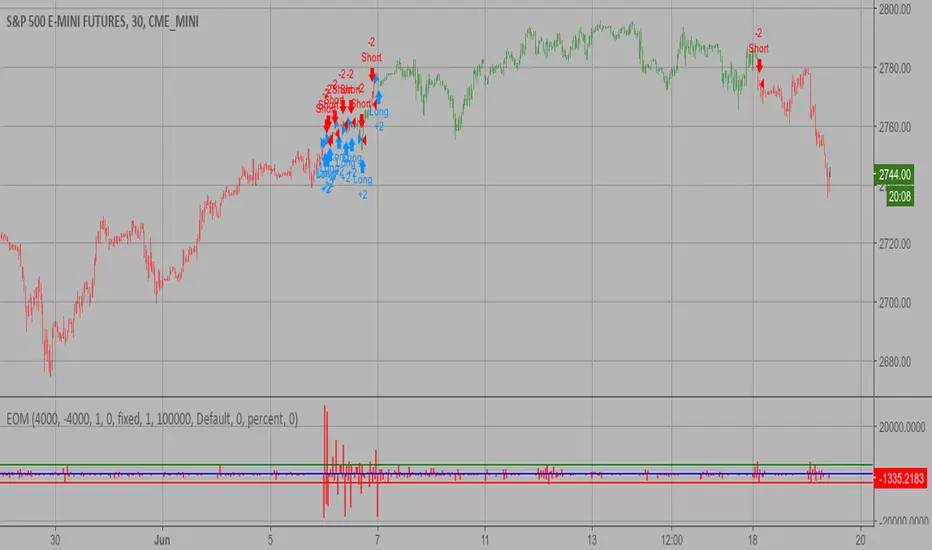
Pivot of Pivot Reversal Strategy [QuantNomad]Continue looking for more signifcant pivot points.
This script is based on my "Significant Pivot Reversal Strategy".
In this strategy I use concept of pivot of pivot points.
So for PoP I require that pivot highs point should have 2 lower pivot highs points around them and pivot low 2 higher pivot lows points.
Transparent lines represent usual pivot levels ints.
Not transparent lines represent pivot of pivot levels.
Link to original script:
Pivot Noktaları

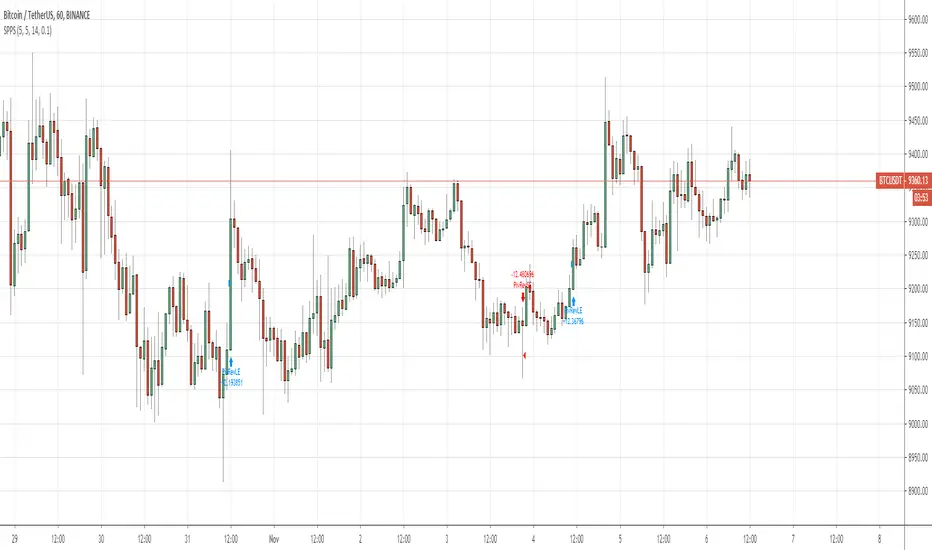
QuantNomad - Significant Pivot Reversal StrategyI'm working on improving the Pivot Points Reversal Strategy.
As one of the ways to filter out insignificant levels I decided to check that pivot point is not above/below neighbors, but check that it's above/below at least by a certain amount.
I use ATR, so in params, you can set length of ATR and also ATR multiplier. The new level will be calculated only if PP will be above/below neighbors by atr * atr_mult.
It seems this approach might help in some cases.
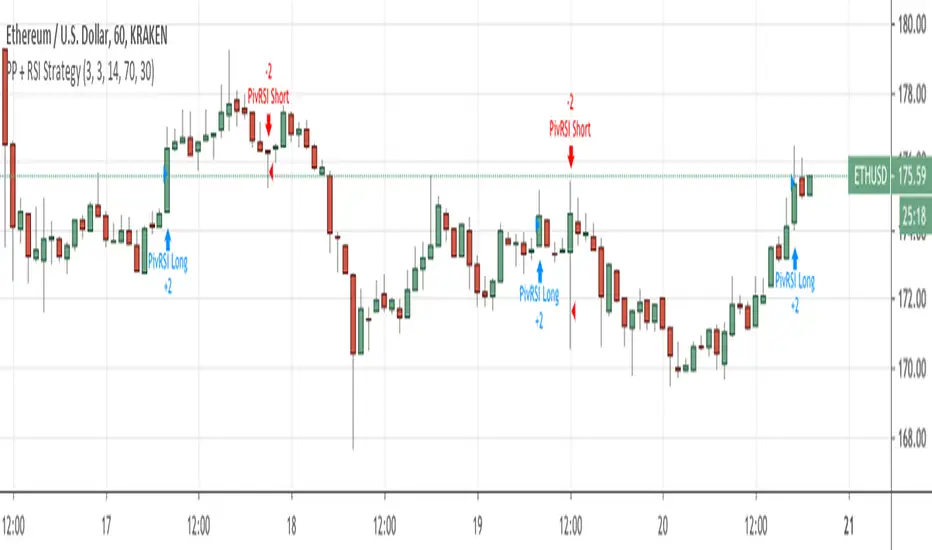
Here I have PivotPoint + RSI strategy:
Pivot Point Reversal + RSI StrategyThis strategy joins the Pivot Reversal strategy with the RSI indicator.
We check RSI level at the pivot point level and only if RSI condition is satisfied we update levels for stop orders.
The strategy works pretty good for crypto, 30m, 1h, 2h timeframes.
QuantNomad - Pivot Reversal Strategy - XBTUSD - 1hPivot reversal strategy almost always works pretty good for crypto.
Here is setup with 4 left, 4 right bars for pivot points for XBTUSD 1h chart.
It shows a pretty nice performance of 350% with only 10% dd, Sharpe is 1.16.
If you're interested in using this strategy in my scripts you can find alerts for it and a version with added backtesting range.
And remember:
Past performance does not guarantee future results.


High and Low Levels Backtest This script shows a high and low period value.
Width - width of lines
SelectPeriod - Day or Week or Month and etc.
LookBack - Shift levels 0 - current period, 1 - previous and etc.
You can change long to short in the Input Settings
WARNING:
- For purpose educate only
- This script to change bars colors.

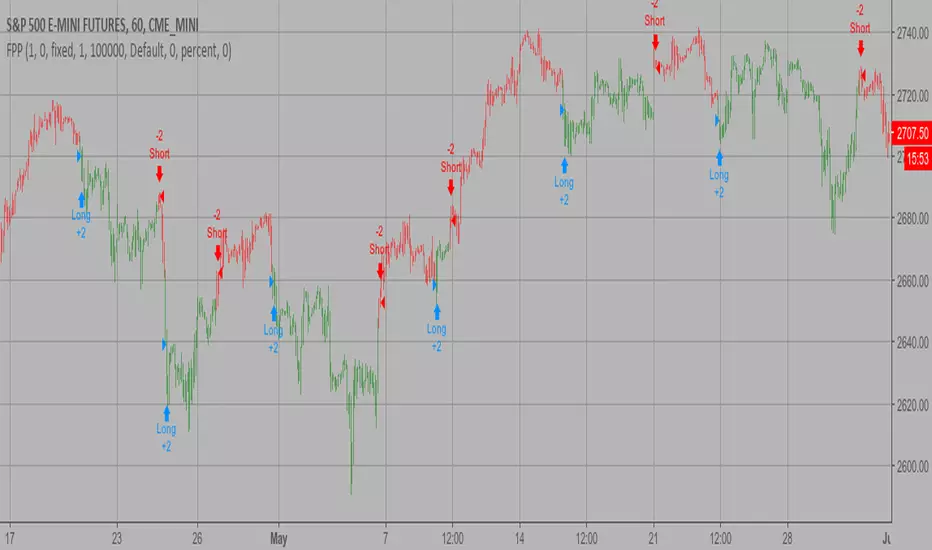
Floor Pivot Points Backtest The name ‘Floor-Trader Pivot,’ came from the fact that Pivot points can
be calculated quickly, on the fly using price data from the previous day
as an input. Although time-frames of less than a day can be used, Pivots are
commonly plotted on the Daily Chart; using price data from the previous day’s
trading activity.
You can change long to short in the Input Settings
WARNING:
- For purpose educate only
- This script to change bars colors.
Ease of Movement (EOM) Backtest This indicator gauges the magnitude of price and volume movement.
The indicator returns both positive and negative values where a
positive value means the market has moved up from yesterday's value
and a negative value means the market has moved down. A large positive
or large negative value indicates a large move in price and/or lighter
volume. A small positive or small negative value indicates a small move
in price and/or heavier volume.
A positive or negative numeric value. A positive value means the market
has moved up from yesterday's value, whereas, a negative value means the
market has moved down.
You can change long to short in the Input Settings
WARNING:
- For purpose educate only
- This script to change bars colors.
Dynamic Pivot Point Backtest This Pivot points is calculated on the current day.
Pivot points simply took the high, low, and closing price from the previous period and
divided by 3 to find the pivot. From this pivot, traders would then base their
calculations for three support, and three resistance levels. The calculation for the most
basic flavor of pivot points, known as ‘floor-trader pivots’, along with their support and
resistance levels.
You can change long to short in the Input Settings
WARNING:
- For purpose educate only
- This script to change bars colors.

My BTC/USDT 45min Ichimoku Strat v2Improved last version by adding a RSI derivative condition, which is very effective for spotting sheep herd moves, and follow them asap.
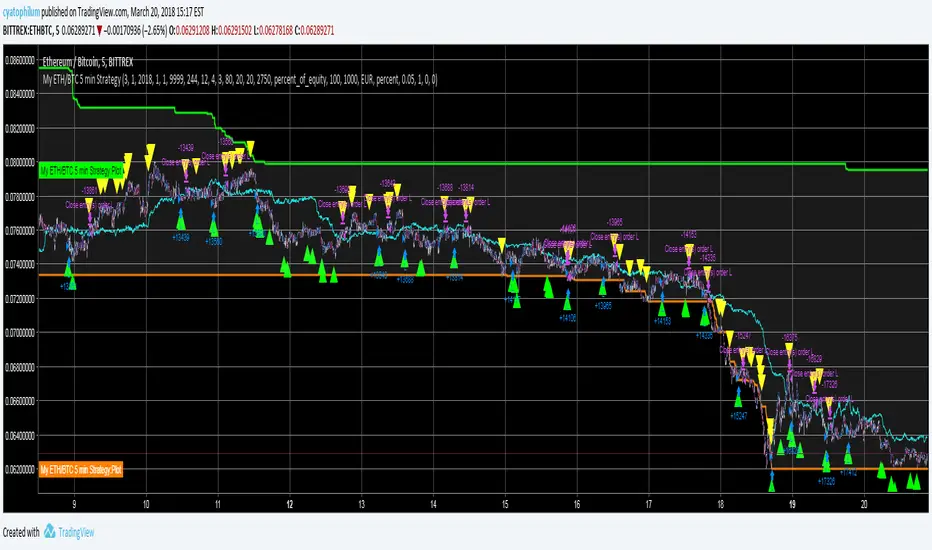
My ETH/BTC 5 min StrategyHello, beginner in trading here. Use this at your own risk.
Commission : 0.05%
Time Unit : 5 min
Backtest range : 15 days (looking like that is the maximum in 5 min UT)
Initial capital : 1000€
How it works :
Long entries and exits. That's all, no pyramiding, no shorting.
It takes the first buy signal (green triangle) and the first sell signal (yellow triangle)
The idea is to scalp while in range using stochastic, and to get out / in when a big trend appears (that is what the tunnel is for).
See the code for details.
I think those are pretty good result when we look at hueg negative buy and hold returns of this month of March. What do you think?
TTM scalper indicator Backtest TTM scalper indicator of John Carter’s Scalper Buys and Sells. The methodology
is a close approximation of the one described in his book Mastering the Trade.
The book is highly recommended. Note the squares are not real-time but will
show up once the third bar has confirmed a reversal.
You can change long to short in the Input Settings
WARNING:
- For purpose educate only
- This script to change bars colors.

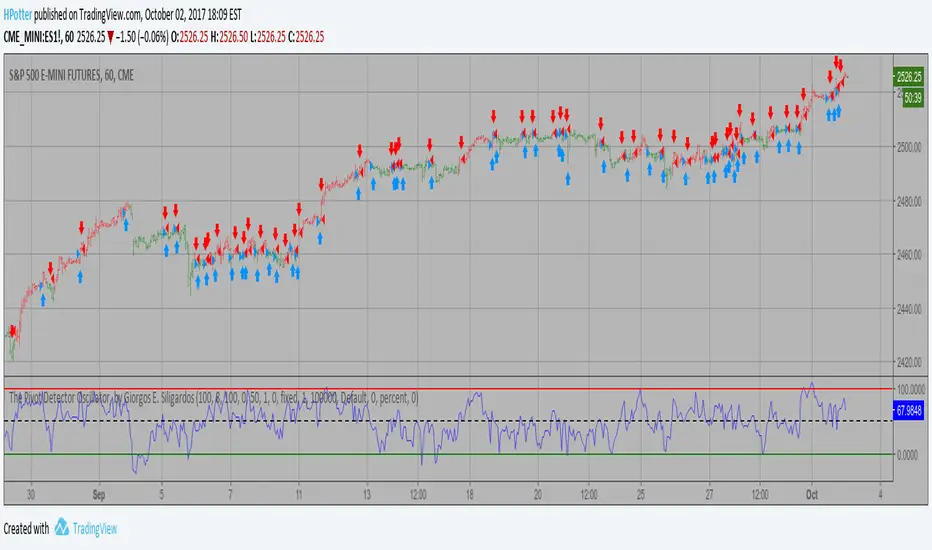
The Pivot Detector Oscillator Backtest The Pivot Detector Oscillator, by Giorgos E. Siligardos
The related article is copyrighted material from Stocks & Commodities 2009 Sep
You can change long to short in the Input Settings
WARNING:
- For purpose educate only
- This script to change bars colors.
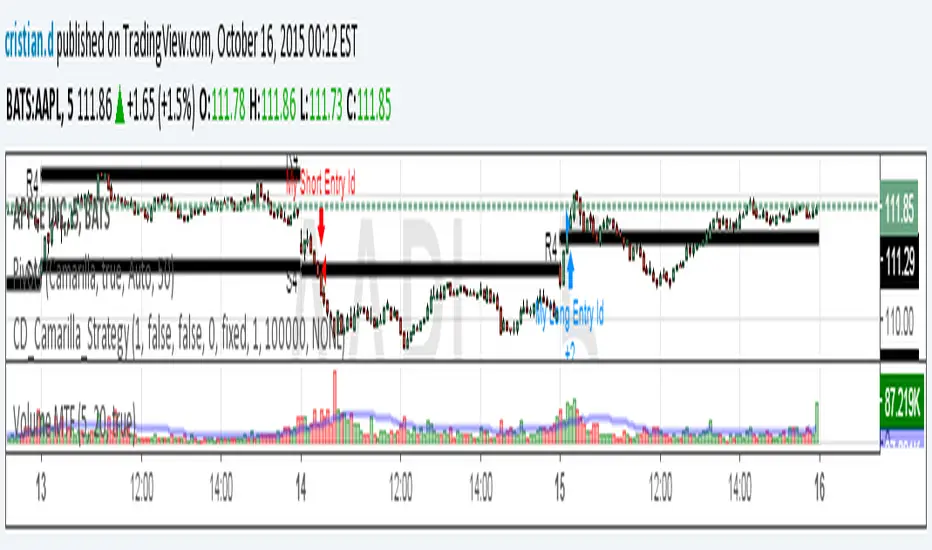
CamarillaStrategy -V1 - H4 and L4 breakout - exits addedExits added using trailing stops.
2.6 Profit Factor and 76% Profitable on SPY , 5M - I think it's a pretty good number for an automated strategy that uses Pivots. I don't think it's possible to add volume and day open price in relation to pivot levels -- that's what I do manually ..
Still trying to add EMA for exits.. it will increase profitability. You can play in pinescript with trailing stops entries..

Camarilla Strategy - breakouts of H4 and L4Breakout strategy of H4 and L4 levels. Manual entries and exits - higher profits BUT because I am a novice in pinescript,
Can someone please:
1. Show me how to add exit strategy lines : close> ema(close,3) for exit short and opposite for long. I added myself but I can't make it to work in relation to camarilla entries; instead it shows all ema crossings..
2.Why some entries over/above my pivots are not shown.. Example:11.15 AM (short) and 13.10 PM (long) AAPL, October 15, today? Today would've been 3 signals, not one..
Thank you in advance for any advice. I am a strong Camarilla follower, but I am not a coder.