Account GuardianAccount Guardian: Dynamic Risk/Reward Overlay
Introduction
Account Guardian is an open-source indicator for TradingView designed to help traders evaluate trade setups before entering positions. It automatically calculates Risk-to-Reward ratios based on market structure, displays visual Stop Loss and Take Profit zones, and provides real-time position sizing recommendations.
The indicator addresses a fundamental question every trader should ask before entering a trade: "Does this setup make mathematical sense?" Account Guardian answers this question visually and numerically, helping traders avoid impulsive entries with poor risk profiles.
Core Functionality
Account Guardian performs four primary functions:
Detects swing highs and swing lows to identify logical stop loss placement levels
Calculates Risk-to-Reward ratios for both long and short setups in real-time
Displays visual SL/TP zones on the chart for immediate trade planning
Computes position sizing based on your account size and risk tolerance
The goal is to provide traders with instant feedback on whether a potential trade meets their minimum risk/reward criteria before committing capital.
How It Works
Swing Detection
The indicator uses pivot point detection to identify recent swing highs and swing lows on the chart. These swing points serve as logical areas for stop loss placement:
For Long Trades: The most recent swing low becomes the stop loss level. Price breaking below this level would invalidate the bullish thesis.
For Short Trades: The most recent swing high becomes the stop loss level. Price breaking above this level would invalidate the bearish thesis.
The swing detection lookback period is configurable, allowing you to adjust sensitivity based on your trading timeframe and style.
It automatically adjusts the tp and sl when it is applied to your chart so it is always moving up and down!
Risk/Reward Calculation
Once swing levels are identified, the indicator calculates:
Entry Price: Current close price (where you would enter)
Stop Loss: Recent swing low (for longs) or swing high (for shorts)
Risk: Distance from entry to stop loss
Take Profit: Entry plus (Risk × Target Multiplier)
R:R Ratio: Reward divided by Risk
The R:R ratio is then evaluated against your configured thresholds to determine if the setup is valid, marginal, or poor.
Visual Elements
SL/TP Zones
When enabled, the indicator draws colored boxes on the chart showing:
Red Zone: Stop Loss area - the region between your entry and stop loss
Green/Gold/Red Zone: Take Profit area - colored based on R:R quality
The color coding provides instant visual feedback:
Green: R:R meets or exceeds your "Good R:R" threshold (default 3:1)
Gold: R:R meets minimum threshold but below "Good" (between 2:1 and 3:1)
Red: R:R below minimum threshold - setup should be avoided
Swing Point Markers
Small circles mark detected swing points on the chart:
Green circles: Swing lows (potential support / long SL levels)
Red circles: Swing highs (potential resistance / short SL levels)
Dashboard Panel
The dashboard in the top-right corner displays comprehensive trade planning information:
R:R Row: Current Risk-to-Reward ratio for long and short setups
Status Row: VALID, OK, BAD, or N/A based on R:R thresholds
Stop Loss Row: Exact price level for stop loss placement
Take Profit Row: Exact price level for take profit placement
Pos Size Row: Recommended position size based on your risk parameters
Risk $ Row: Dollar amount at risk per trade
Position Sizing Logic
The indicator calculates position size using the formula:
Position Size = Risk Amount / Risk per Unit
Where:
Risk Amount = Account Size × (Risk Percentage / 100)
Risk per Unit = Entry Price - Stop Loss Price
For example, with a $10,000 account risking 1% per trade ($100), if your entry is at 100 and stop loss at 98 (risk of 2 per unit), your position size would be 50 units.
Input Parameters
Swing Detection:
Swing Lookback: Number of bars to look back for pivot detection (default: 10). Higher values find more significant swing points but may be slower to update.
Target Multiplier: Multiplier applied to risk to calculate take profit distance (default: 2). A value of 2 means TP is 2× the distance of SL from entry.
Risk/Reward Thresholds:
Minimum R:R: Minimum acceptable Risk-to-Reward ratio (default: 2.0). Setups below this show as "BAD" in red.
Good R:R: Threshold for excellent setups (default: 3.0). Setups at or above this show as "VALID" in green.
Account Settings:
Account Size ($): Your trading account size in dollars (default: 10,000). Used for position sizing calculations.
Risk Per Trade (%): Percentage of account to risk per trade (default: 1.0%). Professional traders typically risk 0.5-2% per trade.
Display:
Show SL/TP Zones: Toggle visibility of the colored zone boxes on chart (default: enabled)
Show Dashboard: Toggle visibility of the information panel (default: enabled)
Analyze Direction: Choose to analyze Long only, Short only, or Both directions (default: Both)
How to Use This Indicator
Basic Workflow:
Add the indicator to your chart
Configure your account size and risk percentage in the settings
Set your minimum and good R:R thresholds based on your trading rules
Look at the dashboard to see current R:R for potential long and short entries
Only consider trades where the status shows "VALID" or at minimum "OK"
Use the displayed SL and TP levels for your order placement
Use the position size recommendation to determine lot/contract size
Interpreting the Dashboard:
VALID (Green): Excellent setup - R:R meets your "Good" threshold. This is the ideal scenario for taking a trade.
OK (Gold): Acceptable setup - R:R meets minimum but isn't optimal. Consider taking if other confluence factors align.
BAD (Red): Poor setup - R:R below minimum threshold. Avoid this trade or wait for better entry.
N/A (Gray): Cannot calculate - usually means no valid swing point detected yet.
Best Practices:
Use this indicator as a filter, not a signal generator. It tells you IF a trade makes sense, not WHEN to enter.
Combine with your existing entry strategy - use Account Guardian to validate setups from other analysis.
Adjust the swing lookback based on your timeframe. Lower timeframes may need smaller lookback values.
Be honest with your account size input - accurate position sizing requires accurate inputs.
Consider the target multiplier carefully. Higher multipliers mean larger potential reward but lower probability of hitting TP.
Alerts
The indicator includes four alert conditions:
Good Long Setup: Triggers when long R:R reaches or exceeds your "Good R:R" threshold
Good Short Setup: Triggers when short R:R reaches or exceeds your "Good R:R" threshold
Bad Long Setup: Triggers when long R:R falls below your minimum threshold
Bad Short Setup: Triggers when short R:R falls below your minimum threshold
These alerts can help you monitor multiple charts and get notified when favorable setups appear.
Technical Implementation
The indicator is built using Pine Script v6 and includes:
Pivot-based swing detection using ta.pivothigh() and ta.pivotlow()
Dynamic box drawing for visual SL/TP zones
Table-based dashboard for clean information display
Color-coded visual feedback system
Persistent variable tracking for swing levels
Code Structure:
// Swing Detection
float swingHi = ta.pivothigh(high, swingLen, swingLen)
float swingLo = ta.pivotlow(low, swingLen, swingLen)
// R:R Calculation for Long
float longSL = recentSwingLo
float longRisk = entry - longSL
float longTP = entry + (longRisk * targetMult)
float longRR = (longTP - entry) / longRisk
// Position Sizing
float riskAmount = accountSize * (riskPct / 100)
float posSize = riskAmount / longRisk
Limitations
The indicator uses historical swing points which may not always represent optimal SL placement for your specific strategy
Position sizing assumes you can trade fractional units - adjust accordingly for instruments with minimum lot sizes
R:R calculations assume linear price movement and don't account for gaps or slippage
The indicator doesn't predict price direction - it only evaluates the mathematical viability of a setup
Swing detection has inherent lag due to the lookback period required for pivot confirmation
Recommended Settings by Trading Style
Scalping (1-5 minute charts):
Swing Lookback: 5-8
Target Multiplier: 1-2
Minimum R:R: 1.5
Good R:R: 2.0
Day Trading (15-60 minute charts):
Swing Lookback: 8-12
Target Multiplier: 2
Minimum R:R: 2.0
Good R:R: 3.0
Swing Trading (4H-Daily charts):
Swing Lookback: 10-20
Target Multiplier: 2-3
Minimum R:R: 2.5
Good R:R: 4.0
Why Risk/Reward Matters
Many traders focus solely on win rate, but profitability depends on the combination of win rate AND risk/reward ratio. Consider these scenarios:
50% win rate with 1:1 R:R = Breakeven (before costs)
50% win rate with 2:1 R:R = Profitable
40% win rate with 3:1 R:R = Profitable
60% win rate with 1:2 R:R = Losing money
Account Guardian helps ensure you only take trades where the math works in your favor, even if you're wrong more often than you're right.
Disclaimer
This indicator is provided for educational and informational purposes only. It is not intended as financial, investment, trading, or any other type of advice or recommendation.
Trading involves substantial risk of loss and is not suitable for all investors. The calculations provided by this indicator are based on historical price data and mathematical formulas that may not accurately predict future price movements.
Position sizing recommendations are estimates based on user inputs and should be verified before placing actual trades. Always consider factors such as leverage, margin requirements, and broker-specific rules when determining actual position sizes.
The Risk-to-Reward ratios displayed are theoretical calculations based on swing point detection. Actual trade outcomes will vary based on market conditions, execution quality, and other factors not captured by this indicator.
Past performance does not guarantee future results. Users should thoroughly test any trading approach in a demo environment before risking real capital. The authors and publishers of this indicator are not responsible for any losses or damages arising from its use.
Always consult with a qualified financial advisor before making investment decisions.
Pine

Multi-Fractal Trading Plan [Gemini] v22Multi-Fractal Trading Plan
The Multi-Fractal Trading Plan is a quantitative market structure engine designed to filter noise and generate actionable daily strategies. Unlike standard auto-trendline indicators that clutter charts with irrelevant data, this system utilizes Fractal Geometry to categorize market liquidity into three institutional layers: Minor (Intraday), Medium (Swing), and Major (Institutional).
This tool functions as a Strategic Advisor, not just a drawing tool. It calculates the delta between price and structural pivots in real-time, alerting you when price enters high-probability "Hot Zones" and generating a live trading plan on your dashboard.
Core Features
1. Three-Tier Fractal Engine The algorithm tracks 15 distinct fractal lengths simultaneously, aggregating them into a clean hierarchy:
Minor Structure (Thin Lines): Captures high-frequency volatility for scalping.
Medium Structure (Medium Lines): Identifies significant swing points and intermediate targets.
Major Structure (Thick Lines): Maps the "Institutional" defense lines where trend reversals and major breakouts occur.
2. The Strategic Dashboard A dynamic data panel in the bottom-right eliminates analysis paralysis:
Floor & Ceiling Targets: Displays the precise price levels of the nearest Support and Resistance.
AI Logic Output: The script analyzes market conditions to generate a specific command, such as "WATCH FOR BREAKOUT", "Near Lows (Look Long?)", or "WAIT (No Setup)".
3. "Hot Zone" Detection Never miss a critical test of structure.
Dynamic Alerting: When price trades within 1% (adjustable) of a Major Trend Line, the indicator’s labels turn Bright Yellow and flash a warning (e.g., "⚠️ WATCH: MAJOR RES").
Focus: This visual cue highlights the exact moment execution is required, reducing screen fatigue.
4. The Quant Web & Markers
Pivot Validation: Deep blue fractal markers (▲/▼) identify the exact candles responsible for the structure.
Inter-Timeframe Web: Faint dotted lines connect Minor pivots directly to Major pivots, visualizing the "hidden" elasticity between short-term noise and long-term trend anchors.
5. Enterprise Stability Engine Engineered to solve the "Vertical Line" and "1970 Epoch" glitches common in Pine Script trend indicators. This engine is optimized for Futures (NQ/ES), Forex, and Crypto, ensuring stability across all timeframes (including gaps on ETH/RTH charts).
Operational Guide
Consult the Dashboard: Before executing, check the "Strategy" output. If it says "WAIT", the market is in chop. If it says "WATCH FOR BOUNCE", prepare your entry criteria.
Monitor Hot Zones: A Yellow Label indicates price is testing a major liquidity level. This is your signal to watch for a rejection wick or a high-volume breakout.
Utilize the Web: Use the faint web lines to find "confluence" where a short-term pullback aligns with a long-term trend line.
Configuration
Show History: Toggles "Ghost Lines" (Blue) to display historical structure and broken trends.
Fractal Points: Toggles the geometric pivot markers.
Hot Zone %: Adjusts the sensitivity of the Yellow Warning system (Default: 1%).
Max Line Length: A noise filter that removes stale or "spiderweb" lines that are no longer statistically relevant.

Quant VWAP System 3.8 This is the lower-indicator companion to the "Quant VWAP System." While the main chart tells you where the price is, this oscillator tells you how statistically significant the move is.
It uses a Z-Score algorithm to normalize price action. This means it ignores dollar amounts and instead measures how many Standard Deviations (SD) the price is away from its mean (VWAP). This allows you to instantly spot "Overbought" or "Oversold" conditions on any asset (Bitcoin, Forex, or Stocks) without needing to guess.
Key Features:
1. Normalized Extremes (The "Kill Zones")
±2.0 SD: These dotted lines represent statistical extremes. When the signal line crosses above +2.0, the asset is mathematically expensive (Overbought). When it crosses below -2.0, it is mathematically cheap (Oversold).
The Logic: Price rarely sustains movement beyond 2 Standard Deviations without a reversion or a pause.
2. The Squeeze Radar (Yellow Dots)
Volatility Detection: A row of Yellow Dots appearing on the center line indicates a "Squeeze."
What it means: The Standard Deviation bands are compressing. Energy is building.
Warning: DO NOT trade Mean Reversion when you see Yellow Dots. A squeeze often leads to a violent breakout. Wait for the dots to disappear to confirm the direction of the explosion.
3. Momentum Coloring
Green Line: Z-Score is rising (Bullish Momentum).
Red Line: Z-Score is falling (Bearish Momentum).
This helps you spot divergences (e.g., Price makes a Higher High, but the Oscillator makes a Lower High = Exhaustion).
How to Trade with It
Strategy A: The "Zero Bounce" (Trend Continuation)
Scenario: You are in a Bull Trend.
Signal: The Oscillator line pulls back to the Zero Line (White), turns Green, and curls upward.
Meaning: Price has tested the average (VWAP) and buyers have stepped in. This is a high-probability entry for trend continuation.
Strategy B: The "Extreme Fade" (Reversion)
Scenario: The Oscillator pushes deep into the Red Zone (+2.0 SD).
Signal: The line turns Red and crosses back down below the +2.0 dotted line. A small Red Triangle will appear.
Meaning: The statistical extension has failed, and price is likely snapping back to the mean.
Strategy C: Squeeze Breakout
Scenario: Yellow Dots appear on the center line.
Action: Stop trading. Wait.
Signal: The dots disappear, and the line shoots aggressively through +1.0 SD (Long) or -1.0 SD (Short). Ride the momentum.

cd_VW_Cx IMPROVED - Quant VWAP System: Regime, Magnets & Z-ScoQuant VWAP System: Regime, Magnets & Z-Score Matrix
This indicator is a comprehensive Quantitative Trading System designed to move beyond simple support and resistance. Instead of static lines, it uses Statistical Probability (Z-Score) and Standard Deviation to define the current market regime, identify institutional value zones, and project high-probability liquidity targets.
It is engineered for Day Traders and Scalpers (Crypto & Futures) who need to know if the market is Trending, Ranging, or preparing for a Breakout.
1. The "Regime" System (Standard Deviation Bands)
The core engine anchors a VWAP (Volume Weighted Average Price) to your chosen timeframe (Daily, Weekly, or Monthly) and projects volatility bands based on market variance.
The Trend Zone (Inner Band / 1.0 SD): This is the "Fair Value" zone. In a healthy trend, price will pull back into this zone and hold. A hold here signals a high-probability continuation (Trend Following).
The Reversion Zone (Outer Band / 2.0 SD): This represents a statistical extreme. Price rarely sustains movement beyond 2 Standard Deviations without a reversion. A touch of this band signals "Overbought" or "Oversold" conditions.
2. Liquidity Magnets (Virgin VWAPs)
The script automatically tracks "Unvisited VWAPs" from previous sessions. These are price levels where significant volume occurred but have not yet been re-tested.
The Logic: Algorithms often target these "open loops." The script visualizes them as Blue Dashed Lines with price tags.
Smart Scaling (Anti-Scrunch): Includes a custom "Ghost Engine" that automatically hides or "ghosts" magnets that are too far away. This prevents your chart from being squashed (scrunched) on lower timeframes, keeping your candles perfectly readable while still tracking targets in the background.
3. The Quant Matrix (Dashboard)
A real-time Heads-Up Display (HUD) that interprets the data for you:
Regime: Detects Volatility Squeezes. If the bands compress, it signals "⚠ SQUEEZE", warning you to stop mean-reversion trading and prepare for an explosive breakout.
Bias: Color-coded Trend Direction (Bullish/Bearish) based on VWAP slope.
Signal: actionable text prompts such as "BUY DIP" (Trend Following), "FADE EXT" (Mean Reversion), or "PREP BREAK" (Squeeze).
4. Visual Intelligence
Bold Day Separators: Clear, vertical dotted dividers with Date Stamps to instantly separate trading sessions.
Dynamic Labels: Floating labels on the right axis identify exactly which deviation level is which, preventing chart confusion.
How to Use
Strategy A: The Trend Pullback (continuation)
Check Matrix: Ensure Bias is BULLISH (Green).
Wait: Allow price to pull back into the Inner Band (Dark Green Zone).
Trigger: If price holds the Center VWAP or the -1.0 SD line, enter Long.
Target: The next Liquidity Magnet above or the +2.0 SD band.
Strategy B: The Reversion Fade (Counter-Trend)
Check Matrix: Ensure price is labeled "EXTREME" or Signal says "FADE EXT".
Trigger: Price touches or pierces the Outer Band (2.0 SD).
Action: Enter counter-trend (Short) with a target back to the Center VWAP (Mean Reversion).
Strategy C: The Magnet Target
Identify a "MAGNET" line (Blue Dashed) near current price.
These act as high-probability Take Profit levels. Price will often rush to these levels to "close the loop" before reversing.
Settings
Anchor: Daily (default), Weekly, or Monthly.
Magnet Focus Range: Adjusts how aggressively the script hides distant magnets to fix chart scaling (Default: 2%).
Visuals: Fully customizable colors, label sizes, and dashboard position.

cd_VW_CxOverview
The cd_VW_Cx is a sophisticated trend analysis tool designed to quantify market momentum using Multi-Period VWAP (Volume Weighted Average Price). Unlike standard indicators, this script evaluates the current price relationship across multiple historical VWAP anchors to generate a real-time "Confidence Score" ranging from -100 to +100.
💡 Key Features
• Dynamic Anchoring: Seamlessly switch between Daily, Weekly, or Monthly open anchors to align with your trading style (Scalping, Day Trading, or Swing).
• Algorithmic Scoring (The Score Box): The indicator compares the current VWAP against historical periods.
o Score > +70: Strong Bullish Momentum.
o Score < -70: Strong Bearish Momentum.
• Polyline Rendering: Utilizes Pine Script v6’s advanced polyline architecture for high-performance, sleek visual plotting that doesn't clutter your chart.
• Institutional Support/Resistance: Historical VWAP levels are color-coded, often acting as "invisible" magnetic zones where institutional orders are clustered.
🛠 How to Trade with cd_VW_Cx
1. Momentum Confirmation: Look for the Score Box to turn Teal (Bullish) or Red (Bearish). This indicates that the current trend has statistical backing from multiple previous sessions.
2. The Breakout Signal: The script tracks price crossovers of the current VWAP. A "Bullish Breakout" combined with a high score is a high-probability entry signal.
3. Visual Guidance: Use the custom labels to identify which specific day/week/month’s VWAP is currently being tested as support or resistance.
⚙️ Customizable Settings
• Anchor Selection: Choose the calculation basis (Daily, Weekly, Monthly).
• Thresholds: Adjust the sensitivity of the Bullish/Bearish alerts (Default is +/- 70).
• Visuals: Full control over table positioning, font sizes, and color palettes to match your chart theme.
📢 cd_VW_Cx: Multi-Period VWAP Scoring & Analysis Guide
🔍 Overview & Visual Logic
The labels next to the VWAP levels dynamically change based on your Anchor selection:
• Daily Open: Displays the Day Name (e.g., Monday, Tuesday).
• Weekly Open: Displays the Week Number (1 – 52).
• Monthly Open: Displays the Month Number (1 – 12).
•
General View:
________________________________________
🚦 How to Filter & Track Your Assets
You can monitor your favorite assets using two powerful methods:
1. Real-Time Alerts
Stay updated with TradingView notifications:
• Per Asset: Track a single pair.
• Watchlist Basis: Monitor your entire list at once. Alert Setup Guide:
2. Pine Screener Integration
Filter the market effortlessly using the Pine Screener. Pine Screener View:
________________________________________
⚙️ Settings & Configuration
• Timeframe Selection: Your chart timeframe must be lower than the selected Anchor timeframe. (e.g., If "Daily Open" is selected, the timeframe should be lower than 1D).
• Anchor Choice: Select Daily, Weekly, or Monthly opens.
• Source Selection: Default value is set to ohlc4. Source Settings:
Filtering Criteria Examples:
• Bullish Filtering: Find assets with high momentum scores.
• Bullish Breakout (Single Criteria): Filters assets that have closed above the current VWAP level.
• Combined Strength (Score + Breakout): Filters assets that have a Score > 70 AND a fresh VWAP Breakout simultaneously.
________________________________________
⚠️ Important Notes & Warnings
• Calculation Logic: The indicator calculates levels and scores on timeframes lower than the anchor. It is best used on timeframes that are close to but lower than the anchor.
• Avoid Extreme Gaps: Using a very low timeframe (e.g., 1m) with a very high anchor (e.g., Monthly) increases the risk of erroneous results.
• Optimization: The default score threshold of 70 is a starting point; I recommend adjusting it based on your own trading experience.
• The Power of Confluence: VWAP levels are naturally strong. Their significance increases when they coincide with institutional levels like PDH (Previous Day High), Session H/L, or HTF FVG.
• Experience Matters: A high score alone is not enough for an entry. Always combine this data with your personal strategy.
________________________________________
💬 Community & Feedback
I would love to hear your suggestions regarding the scoring logic or visual improvements! Feel free to share your thoughts in the comments.
Happy Trading! 🚀

Smart Weekly Lines — Clean & Scroll-Proof (Pine v6)Because your chart deserves structure. Elegant weekly dividers that stay aligned, scroll smoothly, and project future weeks using your wished UTC offset.
Smart Weekly Lines draws precise, full-height vertical lines marking each new week — perfectly aligned to your local UTC offset. It stays clean, smooth, and consistent no matter how far you scroll.
Features
• Accurate weekly boundaries based on your local UTC offset (supports half-hour zones like India +5.5)
• Clean, full-height lines that never cut off with zoom or scroll
• Adjustable color, opacity, width, and style (solid, dashed, dotted)
• Future week projection for planning and alignment
• Optional visibility: show only on Daily and Intraday charts
Works with any market — stocks, crypto, forex, or futures.
Built for traders who value clarity, structure, and precision.
Developed collaboratively with the assistance of ChatGPT under my direction and testing.

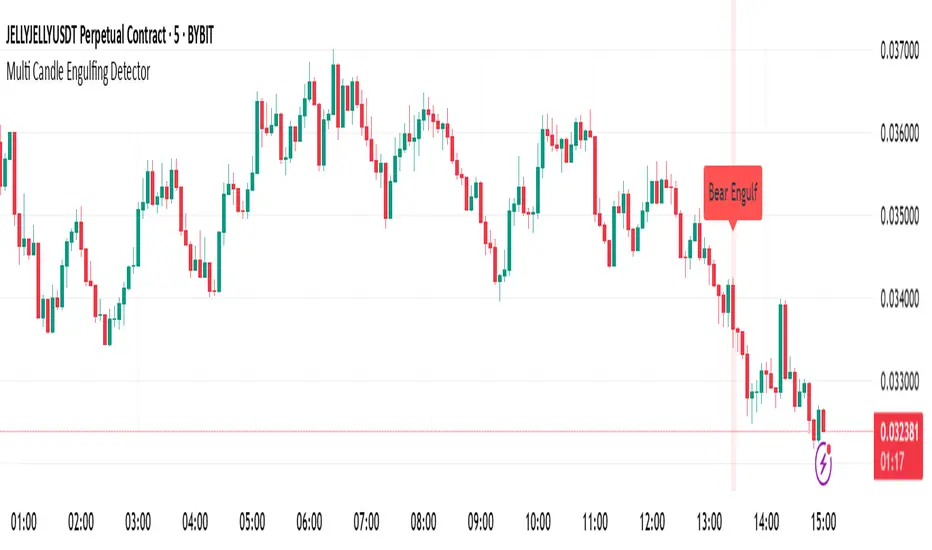
Multi Candle Engulfing Detector🔍 Multi Candle Engulfing Detector
This indicator identifies powerful engulfing candles that consume three or more previous candles — a signal often tied to strong market reversals or continuation moves.
🧠 Features
Detects candles that fully engulf the previous 3 or more candles
Optional filtering: only trigger when the engulfed candles are of the opposite color
Customizable engulf count for greater pattern control
Clear bullish and bearish signal labels on the chart
Alerts integrated: get notified the moment a setup forms
Background highlighting for enhanced visibility
⚙️ Settings
Minimum Number of Candles to Engulf: Default is 3, but can be adjusted
Require Opposite Color: When enabled, the engulfing candle must be opposite in color to the engulfed ones (e.g., green engulfing red)
📈 Use Cases
Spot strong reversal signals at tops and bottoms
Confirm breakout momentum on trend continuation
Use in confluence with other tools like volume or support/resistance
🚨 Alerts
Alerts fire when a bullish or bearish engulfing pattern is detected, allowing for mobile, email, or webhook notifications.
✅ Notes
This script is fully customizable and can be extended into a strategy or scanning tool. Feedback and suggestions are always welcome!
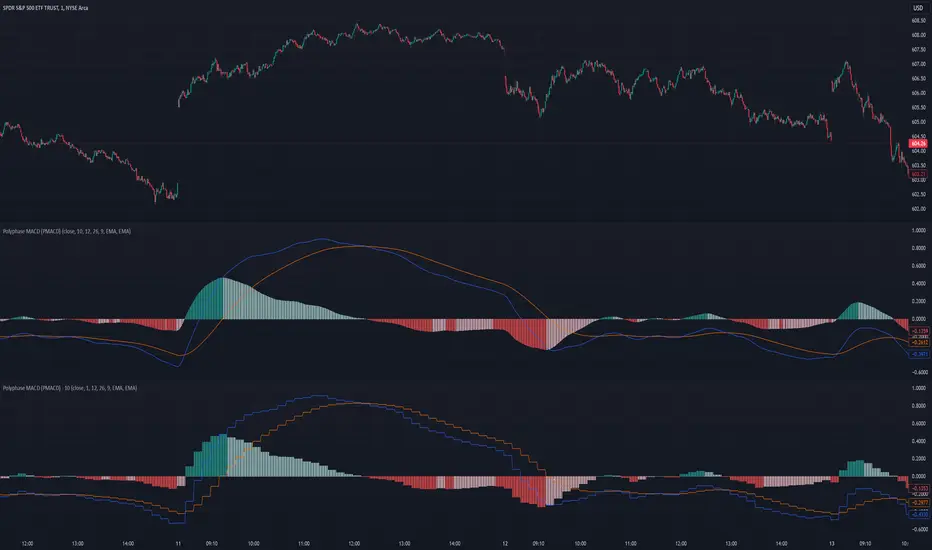
Polyphase MACD (PMACD)The Polyphase MACD (PMACD) uses polyphase decimation to create a continuous estimate of higher timeframe MACD behavior. The number of phases represents the timeframe multiplier - for example, 3 phases approximates a 3x higher timeframe.
Traditional higher timeframe MACD indicators update only when each higher timeframe bar completes, creating stepped signals that can miss intermediate price action. The PMACD addresses this by maintaining multiple phase-shifted MACD calculations and combining them with appropriate anti-aliasing filters. This approach eliminates the discrete jumps typically seen in higher timeframe indicators, though the resulting signal may sometimes deviate from the true higher timeframe values due to its estimative nature.
The indicator processes price data through parallel phase calculations, each analyzing a different time-offset subset of the data. These phases are filtered and combined to prevent aliasing artifacts that occur in simple timeframe conversions. The result is a smooth, continuous signal that begins providing meaningful values immediately, without requiring a warm-up period of higher timeframe bars.
The PMACD maintains the standard MACD components - the MACD line (fast MA - slow MA), signal line, and histogram - while providing a more continuous view of higher timeframe momentum. Users can select between EMA and SMA calculations for both the oscillator and signal components, with all calculations benefiting from the same polyphase processing technique.
FUNCTION: Limited Historical Data WorkaroundFUNCTION: Limited Historical Data Workaround
If you are working with bitcoin weekly charts, or any other ticker with a low amount of price history this function may help you out. For example you want to apply indicators to some shitcoin that just launched? This can help you.
It can be frustrating to use certain built-ins since they will only give an output once the full lookback length is available. This function allows you to avoid that situation and start plotting things with almost no history whatsoever!
In this example code we do it by utilizing a replacement for the built in pine SMA function. This function allows us to pass a series instead of just a simple int to the length variable of the SMA. This can be achieved with all the pine built ins and I believe @pinecoders has a publication already detailing many of them with full coded examples.
Then we replace the length of the SMA with the custom history function. It checks to see if the current bar index is less than the length of the function. Then if it is, it changes the length to the bar index allowing us to get plots and series earlier than otherwise possible.

PSv5 Color Magic and Chart Theme SimulatorKEEP YOUR COINS FOLKS! I DON'T NEED THEM, DON'T WANT THEM. Many other talented authors on TV deserve them.
INTRODUCTION:
This is my "PSv5 Color Magic and Chart Theme Simulator" displayed using Pine Script version 5.0. The purpose of this PSv5 colorcator is to show vivid colors that are most suitable in my opinion for modifying or developing Pine scripts. Whether you are new to Pine or an experienced Pine poet, this should aid you in developing indicators with stunning color from the provided color list that is easily copied and pasted into any novel script you should possess. Whichever colors you choose, and how, is up to your imagination's capacity.
COMMENTARY:
I have a thesis. Pine essentially is a gigantor calculator with a lot of programmable bells and whistles to perform intense analytics. Zillions of numbers per day are blended up into another cornucopia of numbers to analyze. The thing is, ALL of those numbers are moot unless we can informatively portray them in various colorized forms with unique methods to point out significant numeric events. By graphically displaying them with specific modes of operation, only then do these numbers truly make any sense to us and become quantitatively beneficial.
I have to admit... I hate numbers. I never really liked them, even before I knew what an ema() was. Some days I almost can't stand them, and on occasion I feel they deserve to be flushed down the toilet at times. However, I'm a stickler for a proper gauge of measurements. Numbers are a mental burden, but they do have "purpose and meaning". That's where COLOR comes in! By applying color in specific ways in varying dynamic forms, we can generate smarter visual aids from these numerics. Numbers can be "transformed" into something colorful it wasn't before, into a tool, like a hammer. But we don't need a hammer, we need an impressive jack hammer for BIG problem solving that we could never achieve in the not to distant past.
As time goes on, we analytically measure more, and more, and more each year. It's necessary to our continual evolution. That's one significant difference between us and cave men, and the pertinent reason why we are quickly evolving as a species, while animals haven't. Humankind is gifted to enumerate very well AND blessed to see in color. We use it for innumerable things in the technological present for purpose and pleasure. Day in and day out, we take color for granted, because it's every where we can look. The fact is, color is the most important apparatus in humankind's existence EVER. We wouldn't have survived this far without it.
By utilizing color to it's grand potential, greater advancements can be attained while simultaneously being enjoyed visually. Once color is transformed from it's numeric origins into applicable tools, we can enjoy the style, elegance, and QUALITATIVE nature of the indication that can be forged. Quantities can't reveal all. Color on the other hand has a handy "quality" factor to it, often revealing things we can't ordinarily recognize. When high quality tools provide us with obtained goals, that's when we will realize how magical color truly is, always has been, and shall always be.
The future emerging economies and future financial vessels of people around the globe are going to be dependent on the secured construction of intelligent applications with a rock solid color foundation, not just math alone. I have no doubt about that. I can envision that with my eyes closed. To make an informed choice, it should be charted or graphed somehow prior to a final executive decision to trade. Going back to abysmal black and white with double decimal points placed next to cartoons within extinction doomed newspapers is not a viable option any more.
OBSERVATIONS AND UTILITY:
One thing you will notice is the code is very dense. Looks almost hideous right? Well, the variable naming is lengthy, but it's purpose is to be self explanatory, even for those who don't know how to program, YET. I'm simply not a notation enthusiast. My main intention was to provide clearly identifiable variables from their origin of assignment to their intended destination of use, clearly visible for anyone visiting. The empowerment of well versed words that are easier to understand, is a close rival to the prominent influence color has.
Secondly, I'm displaying hline() and label.new() as prime candidates to exemplify by demonstration how the "Power of Color" can be embraced with the "Power of Pine". Color in Pine has been extensively upgraded to serve novel purposes to accomplish next generation indicators that do and WILL come to exist. New functions included with PSv5 are color.rgb(), color.from_gradient(), color.r(), color.g(), color.b(), and color.t() to accompany color.new() in our mutual TV adventures. Keep in mind, the extreme agility of color also extends to line.new(), the "entirely new" linefill.new(), table.new(), bgcolor() and every other function that may utilize color.
There's a wide range of adjustability in Settings to make selections to see how they perform on different backgrounds, with their size and form. As you curiously toy with those, you're going to notice how some jump out like laser beams while others don't. Things that aren't visually appealing, still have very viable purposes, even if they don't stand out in the crowd. Often, that's preferable. The important thing is that when pertinent information relative to indication is crucial, you can program it with distinction from an assortment of a potential 1.67 million colors that can be created in Pine. "These" are my chosen favorite few, and I hope you adopt them.
PURPOSES:
For those of you who are new to Pine Script, this also may help you understand color hex/rgb and how it is utilized in Pine in a most effective manner. The most skilled of programmers can garner perks as well. There is countless examples of code diversity present here that are applicable in other scripts with adequate mutation. Any member has the freedom use any of this code in this script any way they see fit. It's specifically intended for all. There is absolutely no need for accreditation for any of this code reuse ever, in the present case. Don't worry about, I'm not.
The color_tostring() will be most valuable in troubleshooting color when using color.rgb() and becoming adept with it. I'm not going to be able to use color.rgb() without it. Chameleon indicators of the polychromatic variety are most likely going to be fine tuned with color_tostring() divulging it's results to label.new() or even table.new() maybe. One the best virtues of this script in chart, is when you hover over the generated labels, there's a hidden gift for those who truly wish to learn the intricate mechanics of diverse color in Pine. Settings has informative tooltips too.
AFTERTHOUGHTS:
Colors are most vibrant on the "Black Chart" which is the default, but it doesn't currently exist as a chart theme. With the extreme luminous intensity of LCDs in millicandela( mcd ), you may notice "Light" charts may saturate the colors making charts challenging to analyze. Because of this, I personally use "Dark Charts" and design my indicators specifically for these. I hope this provides inspiration for the future developers who are contemplating the creation of next generation indicators and how color may enhance their usefulness.
When available time provides itself, I will consider your inquiries, thoughts, and concepts presented below in the comments section, should you have any questions or comments regarding this indicator. When my indicators achieve more prevalent use by TV members , I may implement more ideas when they present themselves as worthy additions. Have a profitable future everyone!

RKs Notepad++ Pine Script V5█ OVERVIEW
After reading all the new names and renames that Pine Script V5 brought to us, I knew that my old Notepad++ User Defined Language (UDL) would need a big update, so I decided to do a complete remake using the same Dark color scheme theme of the Pine Editor.
Then, I create a Notepad++ Theme and the Auto-Completion file with the Parameter hints for every built-in function to make everything look nicer
█ IMPORTANT
This is not an indicator!!
These are 3 XML files to copy and paste inside the Notepad++ folder.
You can use any Notepad Software to create the XML files.
The main Notepad++ folder is normally on %AppData%\Notepad++\
To avoid mistakes, always make a Backup of your files before anything.
█ INSTALLATION
Just follow these steps:
1. open a New Document File;
2. Copy everything between ↓↓↓ and ↑↑↑ symbols to this new document;
3. Remove the "//" of every single line;
4. Save each document with the correct name in the right folder;
5. Restart the Notepad++
█ NOTES:
If you have some problem installing, ask me, and I will try to help you.
But, in any case, here is the link to these files on my GitHub:

Indicator PanelHello All,
This script shows Indicator panel in a Table. Table.new() is a new feature and released today! Thanks a lot to Pine Team to add this new great feature! This new feature is a game changer!
The script shows indicator values for each symbol and changes background color of each cell by using current and last values of the indicators for each symbol. if current value is greater than last value then backgroung color is green, if lower than last value then red, if they are equals then gray.
You can choose the indicators to display. Number of columns in the table is dynamic and is changed by number of the indicators.
You can choose 5 different Symbols, 6 Indicators and 2 Simple or Exponential Moving averages, you can set type of moving averages and the lengths. You can also set the lengths for each Indicators.
Indicators:
- RSI
- MACD ( MACD and Signal and Histogram )
- DMI ( +DI and -DI + and ADX )
- CCI
- MFI
- Momentum
- MA with Length 50 (length can be set)
- MA with Length 200 (length can be set)
In this example RSI, MACD and MA 200 were chosen, you can see how table size changes dynamically:
Enjoy!

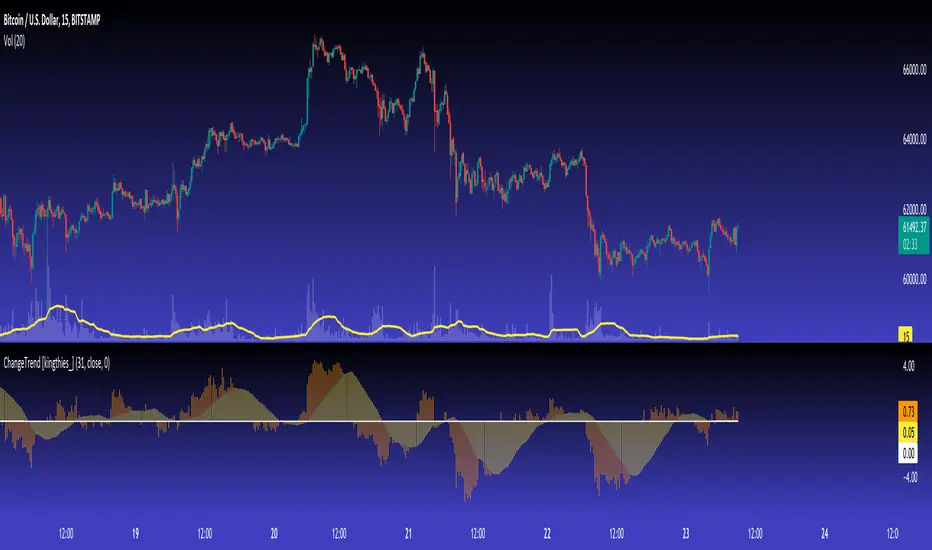
ChangeTrend [kingthies_]% X Change Over Y Amount of Time
AKA "ChangeTrend"
Published by user Eric Thies on 9/3/2020
Description
Relatively simple script that is measuring the performance of the input over the previous y # bars.
The EMA appears to make troughs and peaks easy to see coming / look at as they happen.
Interpretation:
Orange Histogram Represents the immediate % Change
Yellow Histogram represents the overall trend of such as an SMA of the same Y # of bars.
Cheers,
Barssince Context TestThis is just published for visibility as a public service until the Pine devs are able to fix or document this behavior. The barssince() function returns different values when inside a conditional context. As long as it can be documented (and relied upon), this could be a pretty cool feature, but right now this is now how I read the help documentation to describe the function's intended behavior.
Anyway, in the script you'll see that test and test2 agree on red bars, but on green bars test gets a much lower value, which was pretty shocking to me until I traced down this particular cause within my larger script.

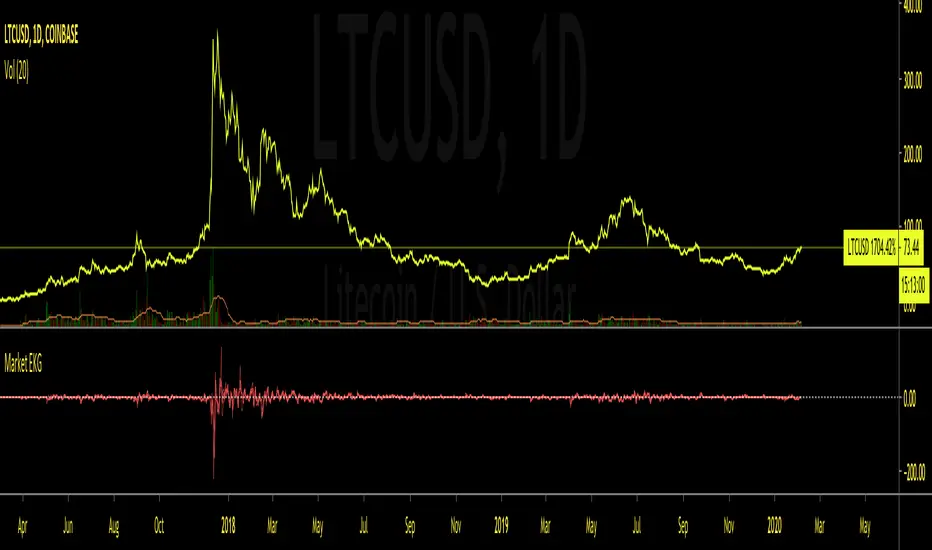
Market EKGShort Summary
This indicator takes the differences in the previous 4 period OHLC inputs, and compares them to the previously closed candle input. The difference is then placed into an oscillator that when all four inputs are scrolled back on, shows an EKG appearing oscillator / volatility measure for traders to use on indexes, tickers and markets that do not allow typical volume based indicators.
Full Summary
Named for its similar appearance to an EKG medical chart, this script takes the difference in relative averages of previous periods in a trend , and compares it to the most recent period input. This can be used as a price based volatility measure, useful in markets that may be limited by no valume measures or other indexes where volatility is useful to meeasure but will not allow volume initializations.
Steps taken
Taking Previous Period OHLC
Taking Previous 3 Periods OHLC Avgs
Difference Between #1 & #2 (Comparing most recent confirmation to relative trend
Plot Results
This RSI Script is intended for public use and can be shared / implemented as needed
Questions? I do not monitor my TradingView inbox. See email address in signature at the bottom of this page for contact information.
Use this script and its calculations as needed! No permission required.
Cheers,
RSI Divergence (Pine v4)Summary
Script highlights the divergences in RSI worth taking notice of. By comparing current envionment to relative sample we can see more than
the standard divergences that many catch through analysis. This framework aims to remove the bias or noise many see when looking for any supporting
evidence to their given emotion on a market.
Step-by-Step Walkthrough
Calculates RSI
Sets Divergence Framework
-------> a. Defining variable values, mandatory in Pine 4)
-------> b. Identify Divergences --> "If bar with lowest / highest is current bar, use it's value"
Compare high of current bar being examined with previous bar's high --> "If curr bar high is higher than the max bar high in the lookback window range"
Finds pivot point with at least 2 right candles with lower value
Finds pivot point with at least 2 right candles with lower value
Plot
Set Alerts
This RSI Script is intended for public use and can be shared / implemented as needed
Questions? I do not monitor my TradingView inbox. See email address in signature at the bottom of this page for contact information.

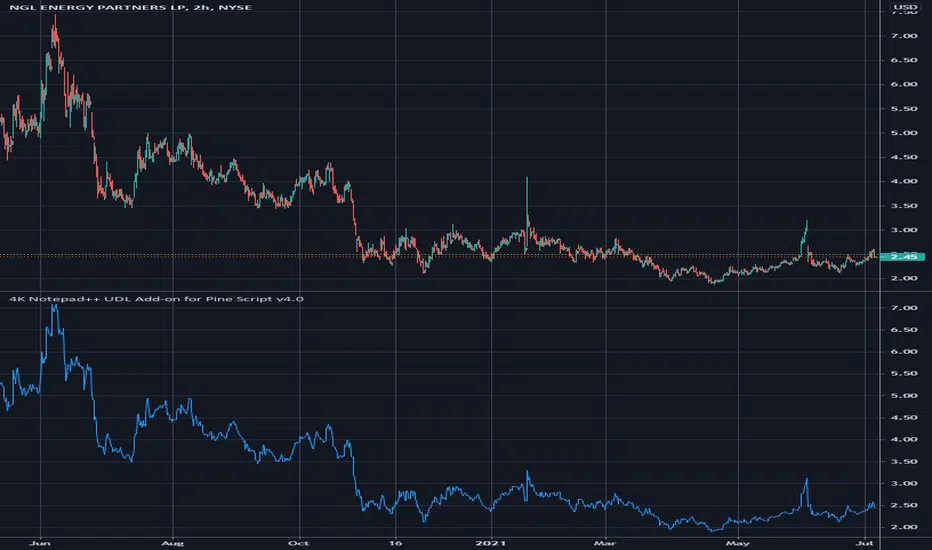
4K Notepad++ UDL Add-on for Pine Script v4.0FIRST OF ALL, THIS NOT AN INDICATOR! This is in XML format as a "utilitarian developer tool add-on" for Notepad++ editor for viewing Pine Script on 4K screens, but 4K isn't REQUIRED to use this.
For all Notepad++ enthusiasts out there utilizing Pine Script, I present a UDL(User Defined Language)... for Notepad++... for Pine Script v4.0... on 4K LCDs.
This is only for a dark background in Notepad++ editor, FYI. I would also like to mention, I used a 42" 4K LCD at this time of initial publication.
NOTICE: Please be sure to strip the "//" from this code on every line where the XML is commented with Pine Script comment operators(//) before saving to drive as an XML(*.xml) file. This may be done easily within the Pine Editor using ' CTRL + / ' after a click/drag selection of the bulk XML code. Pine Script commenting will then be stripped out of the XML following after the beginning/closing tags and .
The entire section below entitled "Notepad++ UDL INSTALLATION INSTRUCTIONS" is not required for importation into Notepad++. These are just HOW TOs concerning export/configuration in Notepad++ in the XML comments , and will be ignored if it's included during the import procedure, no worries.
I will update this as PSv4.0 evolves and time provides itself to me. Any anomalies discovered, please respectfully contact me privately via TV chat to discuss any ideas/concerns.
With all that aforementioned said, I believe this will be very useful to Pine Script developers who use Notepad++ editor in tandem with Pine Editor, further unleashing the "Power of Pine" on this planet.
NOTICE: Copy pasting bandits who may be having nefarious thoughts, DO NOT attempt this, because this may violate Tradingview's terms, conditions and/or house rules. "WE" are always watching the TV community vigilantly for mischievous behaviors and actions that exploit well intended authors for the purpose of unscrupulously increasing brownie points in reputation scores. Hiding behind a "protected" wall may not protect you from investigation and account penalization by TV staff. Be respectful, and don't just throw a meaningless feature in there branding it as "your" gizmo. Fair enough? Alrighty then... I firmly believe in "innovating" future state-of-the-art indicators, and please contact me if you wish to do so.
The comments section below is solely just for commenting and other remarks, ideas, compliments, etc... regarding only this indicator, not others. When available time provides itself, I will consider your inquiries, thoughts, and concepts presented below in the comments section if you do have any questions or comments regarding this indicator. When my indicators achieve more prevalent use by TV members, I may implement more ideas when they present themselves as worthy additions. As always, "Like" it if you simply just like it with a proper thumbs up, and also return to my scripts list occasionally for additional postings. Have a profitable future everyone!

How to avoid repainting when using security() - PineCoders FAQNOTE
The non-repainting technique in this publication that relies on bar states is now deprecated, as we have identified inconsistencies that undermine its credibility as a universal solution. The outputs that use the technique are still available for reference in this publication. However, we do not endorse its usage. See this publication for more information about the current best practices for requesting HTF data and why they work.
This indicator shows how to avoid repainting when using the security() function to retrieve information from higher timeframes.
What do we mean by repainting?
Repainting is used to describe three different things, in what we’ve seen in TV members comments on indicators:
1. An indicator showing results that change during the realtime bar, whether the script is using the security() function or not, e.g., a Buy signal that goes on and then off, or a plot that changes values.
2. An indicator that uses future data not yet available on historical bars.
3. An indicator that uses a negative offset= parameter when plotting in order to plot information on past bars.
The repainting types we will be discussing here are the first two types, as the third one is intentional—sometimes even intentionally misleading when unscrupulous script writers want their strategy to look better than it is.
Let’s be clear about one thing: repainting is not caused by a bug ; it is caused by the different context between historical bars and the realtime bar, and script coders or users not taking the necessary precautions to prevent it.
Why should repainting be avoided?
Repainting matters because it affects the behavior of Pine scripts in the realtime bar, where the action happens and counts, because that is when traders (or our systems) take decisions where odds must be in our favor.
Repainting also matters because if you test a strategy on historical bars using only OHLC values, and then run that same code on the realtime bar with more than OHLC information, scripts not properly written or misconfigured alerts will alter the strategy’s behavior. At that point, you will not be running the same strategy you tested, and this invalidates your test results , which were run while not having the additional price information that is available in the realtime bar.
The realtime bar on your charts is only one bar, but it is a very important bar. Coding proper strategies and indicators on TV requires that you understand the variations in script behavior and how information available to the script varies between when the script is running on historical and realtime bars.
How does repainting occur?
Repainting happens because of something all traders instinctively crave: more information. Contrary to trader lure, more information is not always better. In the realtime bar, all TV indicators (a.k.a. studies ) execute every time price changes (i.e. every tick ). TV strategies will also behave the same way if they use the calc_on_every_tick = true parameter in their strategy() declaration statement (the parameter’s default value is false ). Pine coders must decide if they want their code to use the realtime price information as it comes in, or wait for the realtime bar to close before using the same OHLC values for that bar that would be used on historical bars.
Strategy modelers often assume that using realtime price information as it comes in the realtime bar will always improve their results. This is incorrect. More information does not necessarily improve performance because it almost always entails more noise. The extra information may or may not improve results; one cannot know until the code is run in realtime for enough time to provide data that can be analyzed and from which somewhat reliable conclusions can be derived. In any case, as was stated before, it is critical to understand that if your strategy is taking decisions on realtime tick data, you are NOT running the same strategy you tested on historical bars with OHLC values only.
How do we avoid repainting?
It comes down to using reliable information and properly configuring alerts, if you use them. Here are the main considerations:
1. If your code is using security() calls, use the syntax we propose to obtain reliable data from higher timeframes.
2. If your script is a strategy, do not use the calc_on_every_tick = true parameter unless your strategy uses previous bar information to calculate.
3. If your script is a study and is using current timeframe information that is compared to values obtained from a higher timeframe, even if you can rely on reliable higher timeframe information because you are correctly using the security() function, you still need to ensure the realtime bar’s information you use (a cross of current close over a higher timeframe MA, for example) is consistent with your backtest methodology, i.e. that your script calculates on the close of the realtime bar. If your system is using alerts, the simplest solution is to configure alerts to trigger Once Per Bar Close . If you are not using alerts, the best solution is to use information from the preceding bar. When using previous bar information, alerts can be configured to trigger Once Per Bar safely.
What does this indicator do?
It shows results for 9 different ways of using the security() function and illustrates the simplest and most effective way to avoid repainting, i.e. using security() as in the example above. To show the indicator’s lines the most clearly, price on the chart is shown with a black line rather than candlesticks. This indicator also shows how misusing security() produces repainting. All combinations of using a 0 or 1 offset to reference the series used in the security() , as well as all combinations of values for the gaps= and lookahead= parameters are shown.
The close in the call labeled “BEST” means that once security has reached the upper timeframe (1 day in our case), it will fetch the previous day’s value.
The gaps= parameter is not specified as it is off by default and that is what we need. This ensures that the value returned by security() will not contain na values on any of our chart’s bars.
The lookahead security() to use the last available value for the higher timeframe bar we are using (the previous day, in our case). This ensures that security() will return the value at the end of the higher timeframe, even if it has not occurred yet. In our case, this has no negative impact since we are requesting the previous day’s value, with has already closed.
The indicator’s Settings/Inputs allow you to set:
- The higher timeframe security() calls will use
- The source security() calls will use
- If you want identifying labels printed on the lines that have no gaps (the lines containing gaps are plotted using very thick lines that appear as horizontal blocks of one bar in length)
For the lines to be plotted, you need to be on a smaller timeframe than the one used for the security() calls.
Comments in the code explain what’s going on.
Look first. Then leap.

Dragon-Bot - Default ScriptDragon-Script is a framework to make it as easy as possible to test your own strategies and set alerts for external execution bots. This is the alerts version of the script.
The script has many features build in, like:
1) A ping/pong mechanism between longs and shorts
2) A stop-loss
3) Trailing Stops with several ways to calculate them.
4) 2 different ways to flip from long to short.
The script is divided into several parts.
The first part of the script is used to set all the variables. You should normally never change the first part except for the comments at the top.
The second part of the script is the part where you initialise all your indicators. Several indicators can be found on Tradingview and on other sites. Please keep in mind that all the variable names used in the indicator should be unique. (all the … = … parts)
The third part of the script, is the most important part of the script. Here you can create the entry and exit points.
Let’s look at the OPENLONG function to explain this part: The first variables are all the possible entries; These are longentry1 till longentry5. You can add many more if you like.
The variables are all initialised as being false. This way the script can set a value to true if an entry happens.
The if function is the actual logic: You could say “if this is true” then (the line below the if function) longentry1 := (becomes) true.
In this case we have said: “if this is true” then (the line below the if function) longentry1 := (becomes) true when the current close is larger than the close that is 1 back.
The last part is the makelong_funct. This part says that if any of the entries are true, the whole function is true.
The last part of the script is the actual execution. Here the alerts are plotted and the back test strategies are opened and closed.
We hope you guys like it and all feedback is welcome!

Security() Correction - Realtime vs. Historical BarsProblem
Pine's implementation of the security() function behaves differently in realtime vs. historical bars. Specifically, for historical bars, calling security() for a time frame (TF) larger/slower than the current chart's TF will return information about the last completed bar of the higher TF. However, for realtime bars (i.e. if you allow the chart to continue to plot in realtime), security() returns information about the presently in-progress bar of the higher TF. Clearly, this leads to discontinuity that is arbitrarily dependent upon when the user last loaded or refreshed the chart.
Solution
Fortunately, after understanding the problem, solving it is trivial: use security() normally for historical bars, but switch to explicitly requesting prior candle bars once the indicator is operating on realtime bars. I leave the source open here for any to use as they see fit. For testing, I include an input to allow switching back and forth between standard and corrected behavior.
Figure 1 displays the standard behavior we see in security() calls, and Figure 2 displays the behavior after my correction:
Figure 1: Typical security() behavior in Pine
Figure 2: Corrected security() behavior, forcing historical and realtime bars to refer to the same higher TF bar offset.
I publish this mostly as a reminder to myself, so I will not forget and then have to figure it out again next time it comes up in my scripting.
V21: Initial release.

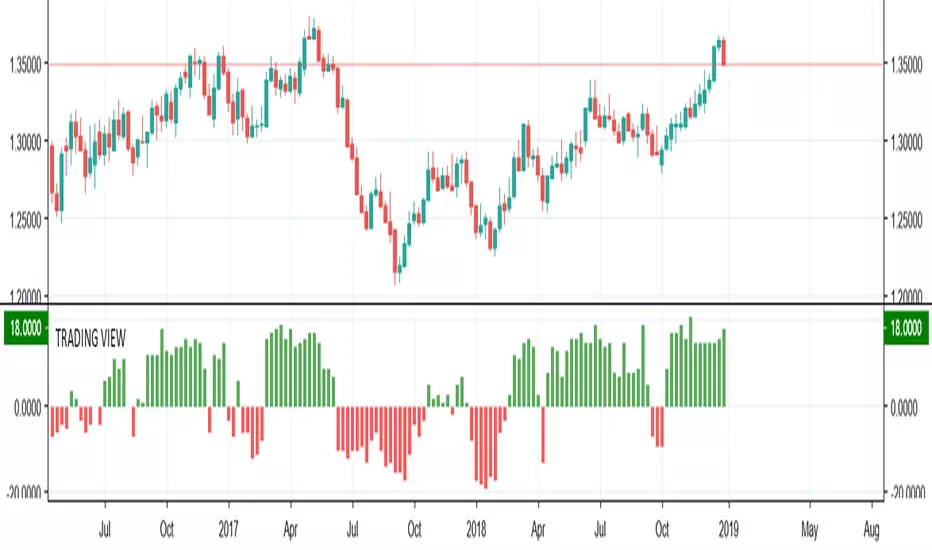
TRADING VIEW INDICATOR - PINE TUTORIAL 5After a long gap, I have written the 5th tutorial for the pine script. You can find the others below, if you read through all of these you should be good to do your own writing.
This script mimics the Trading View Indicator . For example this one below.
www.tradingview.com
It shows the net result of the 28 indicator, either as buy or sell. I have worked hard to make sure it matches the trading view results but I am not in hundred percent agreement with tradingView on SMA, EMA and Ichimoku indicator.
There are many commented plots because I needed to check separately if each indicator is working correctly.
Someone else wrote this code but they did not make it public. It took me about 3 weeks to write this and to be honest it could be cleaner and better commented.
If you find any mistake please let me know. I hope it will be useful in your learning.