Previous Highs & Lows [LuxAlgo]The Previous Highs & Lows indicator highlights a user-set amount of previous maximum/minimum prices made within specific intervals, these are displayed as levels customizable levels.
Additionally, one upper and lower zone constructed from the previously displayed highs/lows is included, providing support/resistance areas.
🔶 USAGE
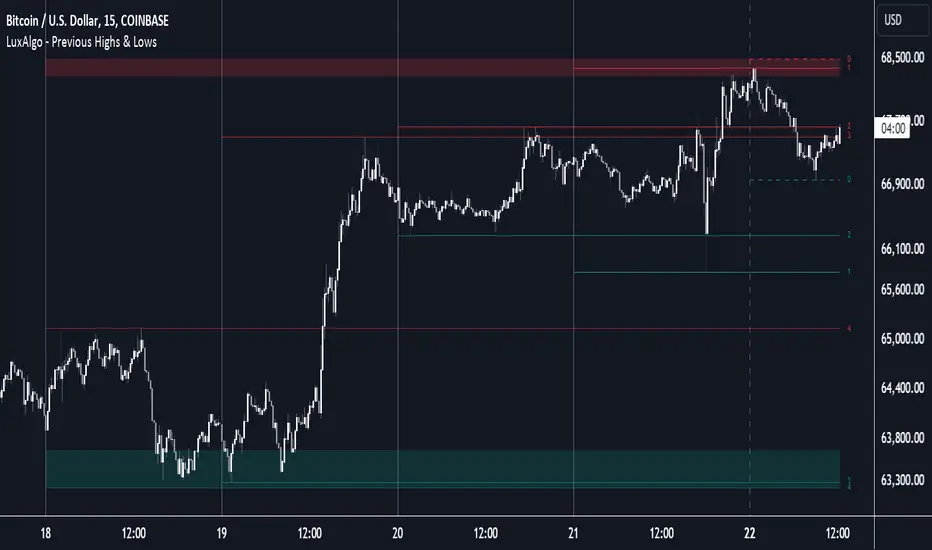
Previous highs/lows are often perceived as key trading levels with the potential of generating multiple reactions upon being reached.
While the daily interval is more commonly used, users can use different intervals, with the indicator supporting hourly, daily, weekly, monthly, and yearly intervals. Using higher intervals on low timeframes can return more distant levels relative to the most recent price, which might not be relevant.
Each level is numbered, with more recent previous highs/lows having a lower number associated with them, users can also highlight more recent levels through a transparency gradient.
Users can control the amount of previous highs/lows displayed using the "Show Last" settings, with a higher value providing more potential support/resistance. Returned previous highs/lows can eventually be filtered out based on their position by enabling the "Filter Based On Position" setting, only keeping previous highs above the current closing price and previous lows below the current closing price, giving more relevant levels as a result.
🔹 Previous High/Low Areas
The indicator includes two areas constructed from the respective percentiles of the returned previous highs/lows. These can be useful as more general support/resistance areas.
Wider areas are often indicative of a group of previous highs or lows being more dispersed, resulting in areas that are easier to reach. Wider areas can also be obtained by increasing the "Areas Width" setting.
Note: Areas will only be displayed if "Show Last" is greater than 1
🔶 SETTINGS
Show Last: Determines the amount of more recent previous highs and previous low levels displayed by the indicator.
Interval: Interval used to capture maximum/minimum price values,
Areas Width: Width of the displayed top/bottom areas, with higher values returning wider areas.
Filter Based On Position: When enabled only display previous highs above the current closing price and previous lows below the current closing price.
🔹 Style
Minimum Gradient Transparency: Minimum transparency value applied to the colors of the oldest displayed previous highs/lows levels.
Pdhl
Breakout Detector (Previous MTF High Low Levels) [LuxAlgo]The Breakout Detector (Previous MTF High Low Levels) indicator highlights breakouts of previous high/low levels from a higher timeframe.
The indicator is able to: display take-profit/stop-loss levels based on a user selected Win/Loss ratio, detect false breakouts, and display a dashboard with various useful statistics.
Do note that previous high/low levels are subject to backpainting, that is they are drawn retrospectively in their corresponding location. Other elements in the script are not subject to backpainting.
🔶 USAGE
Breakouts occur when the price closes above a previous Higher Timeframe (HTF) High or below a previous HTF Low.
On the advent of a breakout, the closing price acts as an entry level at which a Take Profit (TP) and Stop Loss (SL) are placed. When a TP or SL level is reached, the SL/TP box border is highlighted.
When there is a breakout in the opposite direction of an active breakout, previous breakout levels stop being updated. Not reaching an SL/TP level will result in a partial loss/win,
which will result in the box being highlighted with a dotted border (default). This can also be set as a dashed or solid border.
Detection of False Breakouts (default on) can be helpful to avoid false positives, these can also be indicative of potential trend reversals.
This indicator contains visualization when a new HTF interval begins (thick vertical grey line) and a dashboard for reviewing the breakout results (both defaults enabled; and can be disabled).
As seen in the example above, the active, open breakout is colored green/red.
You can enable the setting ' Cancel TP/SL at the end of HTF ', which will stop updating previous TP/SL levels on the occurrence of a new HTF interval.
🔶 DETAILS
🔹 Principles
Every time a new timeframe period starts, the previous high and low are detected of the higher timeframe. On that bar only there won't be a breakout detection.
A breakout is confirmed when the close price breaks the previous HTF high/low
A breakout in the same direction as the active breakout is ignored.
A breakout in the opposite direction stops previous breakout levels from being updated.
Take Profit/Stop Loss, partially or not, will be highlighted in an easily interpretable manner.
🔹 Set Higher Timeframe
There are 2 options for choosing a higher timeframe:
• Choose a specific higher timeframe (in this example, Weekly higher TF on a 4h chart)
• Choose a multiple of the current timeframe (in this example, 75 minutes TF on a 15 min chart - 15 x 5)
Do mind, that when using this option, non-standard TFs can give less desired timeframe changes.
🔹 Setting Win/Loss Levels
The Stop Loss (SL) / Take Profit (TP) setting has 2 options:
W%:L% : A fixed percentage is chosen, for TP and SL.
W:L : In this case L (Loss-part) is set through Loss Settings , W (Win-part) is calculated by multiplying L , for example W : L = 2 : 1, W will be twice as large as the L .
🔹 Loss Settings
The last drawing at the right is still active (colored green/red)
The Loss part can be:
A multiple of the Average True Range (ATR) of the last 200 bars.
A multiple of the Range Cumulative Mean (RCM).
The Latest Swing (with Length setting)
Range Cumulative Mean is the sum of the Candle Range (high - low) divided by its bar index.
🔹 False Breakouts
A False Breakout is confirmed when the price of the bar immediately after the breakout bar returns above/below the breakout level.
🔹 Dashboard
🔶 ALERTS
This publication provides several alerts
Bullish/Bearish Breakout: A new Breakout.
Bullish/Bearish False Breakout: False Breakout detected, 1 bar after the Breakout.
Bullish/Bearish TP: When the TP/profit level has been reached.
Bullish/Bearish Fail: When the SL/stop-loss level has been reached.
Note that when a new Breakout causes the previous Breakout to stop being updated, only an alert is provided of the new Breakout.
🔶 SETTINGS
🔹 Set Higher Timeframe
Option : HTF/Mult
HTF : When HTF is chosen as Option , set the Higher Timeframe (higher than current TF)
Mult : When Mult is chosen as Option , set the multiple of current TF (for example 3, curr. TF 15min -> 45min)
🔹 Set Win/Loss Level
SL/TP : W:L or W%:L%: Set the Win/Loss Ratio (Take Profit/Stop Loss)
• W : L : Set the Ratio of Win (TP) against Loss (SL) . The L level is set at Loss Settings
• W% : L% : Set a fixed percentage of breakout price as SL/TP
🔹 Loss Settings
When W : L is chosen as SL/TP Option, this sets the Loss part (L)
Base :
• RCM : Range Cumulative Mean
• ATR : Average True Range of last 200 bars
• Last Swing : Last Swing Low when bullish breakout, last Swing High when bearish breakout
Multiple : x times RCM/ATR
Swing Length : Sets the 'left' period ('right' period is always 1)
Colours : colour of TP/SL box and border
Borders : Style border when breakout levels stop being updated, but TP/SL is not reached. (Default dotted dot , other option is dashed dsh or solid sol )
🔹 Extra
Show Timeframe Change : Show a grey vertical line when a new Higher Timeframe interval begins
Detect False Outbreak
Cancel TP/SL at end of HTF
🔹 Show Dashboard
Location: Location of the dashboard (Top Right or Bottom Right/Left)
Size: Text size (Tiny, Small, Normal)
See USAGE/DETAILS for more information

PDHL levels with INTRADAY Auto FIBThe present script includes Previous day High/low levels and once the PDH or PDL breaks the present bar's background changes color according to the direction of price breakout.
It's helpful when working on lower timeframe charts with small screen space, so that the user can know that the PDHL has been taken out in one glance at the chart instead of scrolling all around to find out whether the PDH or PDL are broken or not.
The high and low of day before yesterday are also plotted for reference.
The intraday fib levels get drawn taking present day's high and low into account, useful to mark support/retest levels.
The color of the intraday AUTO FIB high and low lines also change from gray to respective assigned colors once the present day price crosses PDH or PDL this is helpful while viewing charts on mobile app.
Disclaimer: Only for studying price movement ideas, trading is not advised.

ATR PivotsThe "ATR Pivots" script is a technical analysis tool designed to help traders identify key levels of support and resistance on a chart. The indicator uses various metrics such as the Average True Range (ATR), Daily True Range ( DTR ), Daily True Range Percentage (DTR%), Average Daily Range (ADR), Previous Day High ( PDH ), and Previous Day Low ( PDL ) to provide a comprehensive picture of the volatility and movement of a security. The script also includes an EMA cloud and 200 EMA for trend identification and a 1-minute ATR scalping strategy for traders to make informed trading decisions.
ATR Detail:-
The ATR is a measure of the volatility of a security over a given period of time. It is calculated by taking the average of the true range (the difference between the high and low of a security) over a set number of periods. The user can input the number of periods (ATR length) to be used for the ATR calculation. The script also allows the user to choose whether to use the current close or not for the calculation. The script calculates various levels of support and resistance based on the relationship between the security's range ( high-low ) and the ATR. The levels are calculated by multiplying the ATR by different Fibonacci ratios (0.236, 0.382, 0.5, 0.618, 0.786, 1.000) and then adding or subtracting the result from the previous close. The script plots these levels on the chart, with the -100 level being the most significant level. The user also has an option to choose whether to plot all Fibonacci levels or not.
DTR and DTR% Detail:-
The Daily True Range Percentage (DTR%) is a metric that measures the daily volatility of a security as a percentage of its previous close. It is calculated by dividing the Daily True Range ( DTR ) by the previous close. DTR is the range between the current period's high and low and gives a measure of the volatility of the security on a daily basis. DTR% can be used as an indicator of the percentage of movement of the security on a daily basis. In this script, DTR% is used in combination with other metrics such as the Average True Range (ATR) and Fibonacci ratios to calculate key levels of support and resistance for the security. The idea behind using DTR% is that it can help traders to better understand the daily volatility of the security and make more informed trading decisions.
For example, if a security has a DTR% of 2%, it suggests that the security has a relatively low level of volatility and is less likely to experience significant price movements on a daily basis. On the other hand, if a security has a DTR% of 10%, it suggests that the security has a relatively high level of volatility and is more likely to experience significant price movements on a daily basis.
ADR:-
The script then calculates the ADR (Average Daily Range) which is the average of the daily range of the security, using the formula (Period High - Period Low) / ATR Length. This gives a measure of the average volatility of the security on a daily basis, which can be useful for determining potential levels of support and resistance .
PDH /PDL:-
The script also calculates PDH (Previous Day High) and PDL (Previous Day Low) which are the High and low of the previous day of the security. This gives a measure of the previous day's volatility and movement, which can be useful for determining potential levels of support and resistance .
EMA Cloud and 200 EMA Detail:-
The EMA cloud is a technical analysis tool that helps traders identify the trend of the market by comparing two different exponential moving averages (EMAs) of different lengths. The cloud is created by plotting the fast EMA and the slow EMA on the chart and filling the space between them. The user can input the length of the fast and slow EMA , and the script will calculate and plot these EMAs on the chart. The space between the two EMAs is then filled with a color that represents the trend, with green indicating a bullish trend and red indicating a bearish trend . Additionally, the script also plots a 200 EMA , which is a commonly used long-term trend indicator. When the fast EMA is above the slow EMA and the 200 EMA , it is considered a bullish signal, indicating an uptrend. When the fast EMA is below the slow EMA and the 200 EMA , it is considered a bearish signal, indicating a downtrend. The EMA cloud and 200 EMA can be used together to help traders identify the overall trend of the market and make more informed trading decisions.
1 Minute ATR Scalping Strategy:-
The script also includes a 1-minute ATR scalping strategy that can be used by traders looking for quick profits in the market. The strategy involves using the ATR levels calculated by the script as well as the EMA cloud and 200 EMA to identify potential buy and sell opportunities. For example, if the 1-minute ATR is above 11 in NIFTY and the EMA cloud is bullish , the strategy suggests buying the security. Similarly, if the 1-minute ATR is above 30 in BANKNIFTY and the EMA cloud is bullish , the strategy suggests buying the security.
Inside Candle:-
The Inside Candle is a price action pattern that occurs when the current candle's high and low are entirely within the range of the previous candle's high and low. This pattern indicates indecision or consolidation in the market and can be a potential sign of a trend reversal. When used in the 15-minute chart, traders can look for Inside Candle patterns that occur at key levels of support or resistance. If the Inside Candle pattern occurs at a key level and the price subsequently breaks out of the range of the Inside Candle, it can be a signal to enter a trade in the direction of the breakout. Traders can also use the Inside Candle pattern to trade in a tight range, or to reduce their exposure to a current trend.
Risk Management:-
As with any trading strategy, it is important to practice proper risk management when using the ATR Pivots script and the 1-minute ATR scalping strategy. This may include setting stop-loss orders, using appropriate position sizing, and diversifying your portfolio. It is also important to note that past performance is not indicative of future results and that the script and strategy provided are for educational purposes only.
In conclusion, the "ATR Pivots" script is a powerful tool that can help traders identify key levels of support and resistance , as well as trend direction. The additional metrics such as DTR , DTR%, ADR, PDH , and PDL provide a more comprehensive picture of the volatility and movement of the security, making it easier for traders to make better trading decisions. The inclusion of the EMA cloud and 200 EMA for trend identification, and the 1-minute ATR scalping strategy for quick profits can further enhance a trader's decision-making process. However, it is important to practice proper risk management and understand that past performance is not indicative of future results.
Special thanks to satymahajan for the idea of clubbing Average True Range with Fibonacci levels.

Strategy: Range BreakoutWhat?
In the price action, levels have a significant role to play. Based on the price moving above/below the levels - the underlying instrument shows some price-action in the direction of breakout/breakdown.
There are plenty of ways level can be determined. Levels are the decision point to take a trade or not. But if we make the level derivation complex, then the execution may get hamper.
This strategy script, developed in PineScript v5, is our attempt at solving this problem at the core by providing this simple, yet elegant solution to this problem.
It's essentially an attempt to Trade Simple by drawing logical (horizontal) lines in the chart and take actions, after multiple associated parameters confirmation, on the breakout / breakdown of the levels.
How?
Let us explain how we are drawing the levels.
We are depending on some of the parameters as described below:
Open Range : During intraday movement, often if prices move beyond a particular level, it exibits more movement in the same swing in same direction. We found out, through our back testing for Indian Indices like NSE:NIFTY , NSE:BANKNIFTY or NSE:CNXFINANCE the first 15m (i.e 09:15 AM to 09:30 AM, IST) is one of such range. For Indian stocks, it is 9:15 to 9:45. And for MCX MCX:CRUDEOIL1! it's 5:00 pm to 6:00 pm. There are our first levels.
PDHCL : Previous Day High, Close, Low. This is our next level
VWAP : The rolling VWAP (volume weighted average price)
In the breakout/breakdown of the Open Range and Previous Day High/Low, we are taking the trade decisions as follows using CEST principle:
C onditions :
If current bar's (say you are in 5m timeframe) closing is broken out the Open Range High or Previous Day High, taken a Buy/Long decision (let's say buying a Call Option CE or selling a Put Option PE or buying the future or cash).
If current bar's (say you are in 5m timeframe) closing is broken down the Open Range Low or Previous Day Low, taken a Sell/Short decision (let's say buying a Put Option CE or selling a Call Option PE or selling the future or cash).
Additionally, and optionally (default ON, one can turn off): we are checking various other associated multiple confirmations as follows:
1. Momentum : Checking 14-period RSI value is more than 50 or less than 50 (all parameters like period, OB, OS ranges are configurable through settings)
2. Current bar's volume is more than the last 20 bars volume average. How much more - that multiplier is also configurable. (default is 1)
3. The breakout candle is bullish (green) or bearish (red).
E ntry :
All of these happens only on the closing of the candle . Means: Non Repainting! .
Clearly in the chart we are showing as green up arrow BO (breakout for buy) and red down arrow BD (breakdown for sell) to take your decision process smooth.
So, on the closing of the decision BO/BD candle we are entering the trade (with a thumping heart and nail biting ...)
S top Loss :
We are relying on the time tasted (last 40 years) mechanism of Average True Range (ATR) of default 14 period. This default period is also configurable.
So for Long trades: the 14 period ATR low band is the SL.
For Short trades: the 14 period ATR high band is the SL.
T arget :
We are depending on the thump rule of 1:2 Risk Reward. It's simple and effective. No fancy thing. We are closing the trade on double the favorable price movement compared to the SL placed. Of course, this RR ratio is confiurable from the settings, as usual.
What's Unqiue in it?
The utter simplicity of this trading mechanism. No fancy things like complex chart pattern, OI data, multiple candlestick patterns, Order flow analysis etc.
Simple level determination,
Marking clearly in the chart.
Making each parameter configurable in Settings and showing tooltip adjacent to the parameter to make you understand it better for your customization,
Wait for the candle close, thus eliminating the chances of repainting menace (as much as possible)
Additional momentum and volume check to trade entry confirmation.
Works with normal candlestick (nothing special ones like HA ...)
Showing everything as a Summary Table (which, again can be turned off optionally) overlaying at the bottom-right corner of the chart,
Optionally the Summary Table can be configured to alert you back (say you get it notified in your email or SMS).
That way, a single, simple, effective trade setup will ease your journey as smooth sail as possible.
Mentions
There are plenty of friends from whom time to time we borrowed some of the ideas while working closely together over last one year.
From tradingview community, we took the spirit of @zzzcrypto123 awesome work done long back (in 2020) as the indicator "ORB - Opening Range Breakout". (We tried to reach him for his explicit consent, unable to catch hold of him).
Some other publicly available materials we have consulted to get the additional checks (like RSI, volume).
Lat word
Use it please and thank you for your constant patronage in following us in this awesome platform. Let's keep growing together.
Disclaimer :
This piece of software does not come up with any warrantee or any rights of not changing it over the future course of time.
We are not responsible for any trading/investment decision you are taking out of the outcome of this indicator.
