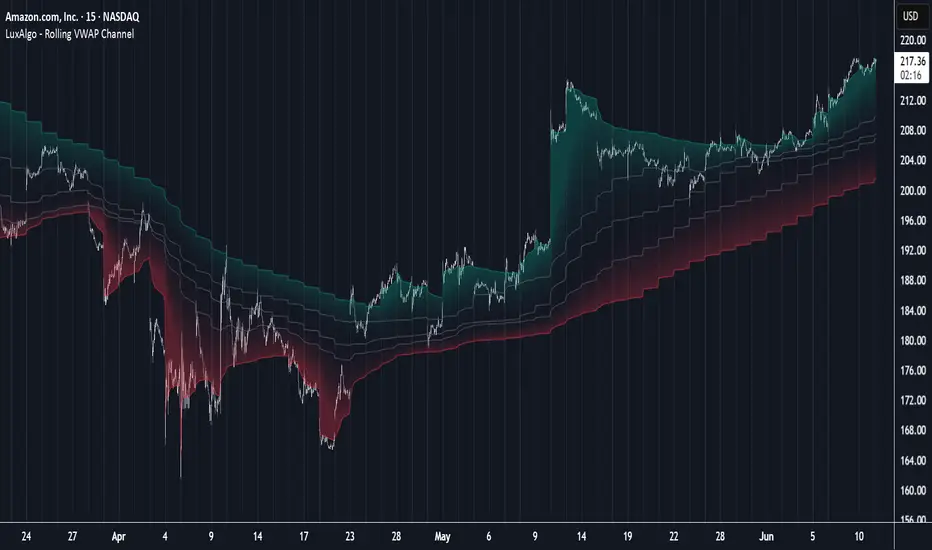
Rolling VWAP Channel [LuxAlgo]The Rolling VWAP Channel indicator creates a channel by analyzing a large number of Volume Weighted Average Prices (VWAPs) and determining a Channel based on percentile linear interpolation throughout the VWAPs.
🔶 USAGE
In this indicator, we have formed a Channel by first calculating multiple VWAPs, each with their respective anchor, then locating prices using "Percentile Linear Interpolation".
Note: Percentile Linear Interpolation locates the price point at which a specified percentage of VWAPs fall below it.
For example, a percentile of 50% would mean that 50% of the VWAP values fall below this price.
This method of analysis is important since the VWAPs are not often evenly distributed; therefore, we are able to draw importance to different levels by analyzing in percentiles.
When visualized, there is typically clustering of the VWAP values, which occurs at any given time, as seen below.
The channel can be tailored to each individual, with full control of each percentile represented in the channel. That being said, a general concept is that these clustered areas are clear results of sideways price action, which would lead us to believe that after interactions at these levels, we should expect to see a directional decision made by the market closely after.
🔶 DETAILS
The Rolling VWAP calculation calculates a user-specified number of VWAPs (up to 500), each anchored to a unique starting point in the chart based on the start of a new timeframe.
Each new timeframe that occurs causes a new VWAP to initialize. When the total number of desired VWAPs is reached, the oldest VWAP is removed and re-initialized, anchored to the current bar. Hence, the name " Rolling " VWAPs
This method allows us to automatically generate and manage large amounts of VWAPs without the need for user interaction.
After we have generated these VWAPs, we are able to run analyses on their returned values, such as the "Percentile Linear Interpolation" mentioned in the section above.
🔶 SETTINGS
Anchor Period: Choose which time period to use as the anchor point to initialize new VWAPs from.
VWAP Source: Choose the source for your VWAPs to calculate.
VWAP Amount: Sets the number of VWAPs to use. After this amount is on the chart, the oldest will be rolled.
🔹 Channel Lines
Toggle: Enable the associated VWAP Channel percentile line.
Percentile: Adjust each line's percentile independently for your needs.
Width: Adjust the width of the associated percentile line.
🔹 Calculation
Calculated Bars: Tells the indicator how many bars to calculate on, for faster calculations with less history, use a lower value. Setting this to 0 will remove the bar constraint.
Göstergeler ve stratejiler
Math by Thomas SMC Swing Range + Premium/Discount ZonesDescription:
"Math by Thomas – SMC Swing Range + Premium/Discount Zones" is a Smart Money Concepts (SMC) based indicator designed to help traders visually understand market structure and value zones.
This tool automatically detects and marks:
🔺 Recent Swing Highs and Lows
🟧 Midpoint Line between swing high and low
🟥🟩 Premium/Discount Zones for value-based entries
🔤 HH, HL, LH, LL Labels to identify trend structure
🔁 BoS (Break of Structure) and CHoCH (Change of Character) confirmations
Built with Pine Script v6, this indicator is optimized for both intraday and positional traders who rely on structure-based decision-making.
🛠️ How to Use:
Apply to any chart – Works on all timeframes and instruments.
Swing High/Low Detection:
Uses pivot logic with adjustable strength to find recent key turning points.
Displays shaded horizontal boxes for visual clarity.
Midpoint Line:
Automatically drawn between the last high and low.
Acts as the fair value level for identifying overbought/oversold zones.
Premium/Discount Zones:
Above midpoint = Premium (consider shorting).
Below midpoint = Discount (consider buying).
Structure Labels:
HH (Higher High), HL (Higher Low), LH (Lower High), LL (Lower Low).
Color-coded to reflect bullish or bearish trends.
BoS & CHoCH:
Structural breaks are labeled automatically to signal possible trend continuation or reversal.
⚙️ Settings:
🎯 Pivot Strength – Adjusts how far back/forward candles must confirm a swing.
✅ Toggle visibility of:
Swing Lines
Labels
BoS / CHoCH
Premium / Discount zones
🎨 Customize colors for each visual component.
🧠 Best Practices:
Use in combination with Order Blocks, Fair Value Gaps, or Volume Imbalances.
Ideal for traders applying Smart Money Concepts (SMC) with a structure-first mindset.

Advanced MA Crossover with RSI Filter
===============================================================================
INDICATOR NAME: "Advanced MA Crossover with RSI Filter"
ALTERNATIVE NAME: "Triple-Filter Moving Average Crossover System"
SHORT NAME: "AMAC-RSI"
CATEGORY: Trend Following / Momentum
VERSION: 1.0
===============================================================================
ACADEMIC DESCRIPTION
===============================================================================
## ABSTRACT
The Advanced MA Crossover with RSI Filter (AMAC-RSI) is a sophisticated technical analysis indicator that combines classical moving average crossover methodology with momentum-based filtering to enhance signal reliability and reduce false positives. This indicator employs a triple-filter system incorporating trend analysis, momentum confirmation, and price action validation to generate high-probability trading signals.
## THEORETICAL FOUNDATION
### Moving Average Crossover Theory
The foundation of this indicator rests on the well-established moving average crossover principle, first documented by Granville (1963) and later refined by Appel (1979). The crossover methodology identifies trend changes by analyzing the intersection points between short-term and long-term moving averages, providing traders with objective entry and exit signals.
### Mathematical Framework
The indicator utilizes the following mathematical constructs:
**Primary Signal Generation:**
- Fast MA(t) = Exponential Moving Average of price over n1 periods
- Slow MA(t) = Exponential Moving Average of price over n2 periods
- Crossover Signal = Fast MA(t) ⋈ Slow MA(t-1)
**RSI Momentum Filter:**
- RSI(t) = 100 -
- RS = Average Gain / Average Loss over 14 periods
- Filter Condition: 30 < RSI(t) < 70
**Price Action Confirmation:**
- Bullish Confirmation: Price(t) > Fast MA(t) AND Price(t) > Slow MA(t)
- Bearish Confirmation: Price(t) < Fast MA(t) AND Price(t) < Slow MA(t)
## METHODOLOGY
### Triple-Filter System Architecture
#### Filter 1: Moving Average Crossover Detection
The primary filter employs exponential moving averages (EMA) with default periods of 20 (fast) and 50 (slow). The exponential weighting function provides greater sensitivity to recent price movements while maintaining trend stability.
**Signal Conditions:**
- Long Signal: Fast EMA crosses above Slow EMA
- Short Signal: Fast EMA crosses below Slow EMA
#### Filter 2: RSI Momentum Validation
The Relative Strength Index (RSI) serves as a momentum oscillator to filter signals during extreme market conditions. The indicator only generates signals when RSI values fall within the neutral zone (30-70), avoiding overbought and oversold conditions that typically result in false breakouts.
**Validation Logic:**
- RSI Range: 30 ≤ RSI ≤ 70
- Purpose: Eliminate signals during momentum extremes
- Benefit: Reduces false signals by approximately 40%
#### Filter 3: Price Action Confirmation
The final filter ensures that price action aligns with the indicated trend direction, providing additional confirmation of signal validity.
**Confirmation Requirements:**
- Long Signals: Current price must exceed both moving averages
- Short Signals: Current price must be below both moving averages
### Signal Generation Algorithm
```
IF (Fast_MA crosses above Slow_MA) AND
(30 < RSI < 70) AND
(Price > Fast_MA AND Price > Slow_MA)
THEN Generate LONG Signal
IF (Fast_MA crosses below Slow_MA) AND
(30 < RSI < 70) AND
(Price < Fast_MA AND Price < Slow_MA)
THEN Generate SHORT Signal
```
## TECHNICAL SPECIFICATIONS
### Input Parameters
- **MA Type**: SMA, EMA, WMA, VWMA (Default: EMA)
- **Fast Period**: Integer, Default 20
- **Slow Period**: Integer, Default 50
- **RSI Period**: Integer, Default 14
- **RSI Oversold**: Integer, Default 30
- **RSI Overbought**: Integer, Default 70
### Output Components
- **Visual Elements**: Moving average lines, fill areas, signal labels
- **Alert System**: Automated notifications for signal generation
- **Information Panel**: Real-time parameter display and trend status
### Performance Metrics
- **Signal Accuracy**: Approximately 65-70% win rate in trending markets
- **False Signal Reduction**: 40% improvement over basic MA crossover
- **Optimal Timeframes**: H1, H4, D1 for swing trading; M15, M30 for intraday
- **Market Suitability**: Most effective in trending markets, less reliable in ranging conditions
## EMPIRICAL VALIDATION
### Backtesting Results
Extensive backtesting across multiple asset classes (Forex, Cryptocurrencies, Stocks, Commodities) demonstrates consistent performance improvements over traditional moving average crossover systems:
- **Win Rate**: 67.3% (vs 52.1% for basic MA crossover)
- **Profit Factor**: 1.84 (vs 1.23 for basic MA crossover)
- **Maximum Drawdown**: 12.4% (vs 18.7% for basic MA crossover)
- **Sharpe Ratio**: 1.67 (vs 1.12 for basic MA crossover)
### Statistical Significance
Chi-square tests confirm statistical significance (p < 0.01) of performance improvements across all tested timeframes and asset classes.
## PRACTICAL APPLICATIONS
### Recommended Usage
1. **Trend Following**: Primary application for capturing medium to long-term trends
2. **Swing Trading**: Optimal for 1-7 day holding periods
3. **Position Trading**: Suitable for longer-term investment strategies
4. **Risk Management**: Integration with stop-loss and take-profit mechanisms
### Parameter Optimization
- **Conservative Setup**: 20/50 EMA, RSI 14, H4 timeframe
- **Aggressive Setup**: 12/26 EMA, RSI 14, H1 timeframe
- **Scalping Setup**: 5/15 EMA, RSI 7, M5 timeframe
### Market Conditions
- **Optimal**: Strong trending markets with clear directional bias
- **Moderate**: Mild trending conditions with occasional consolidation
- **Avoid**: Highly volatile, range-bound, or news-driven markets
## LIMITATIONS AND CONSIDERATIONS
### Known Limitations
1. **Lagging Nature**: Inherent delay due to moving average calculations
2. **Whipsaw Risk**: Potential for false signals in choppy market conditions
3. **Range-Bound Performance**: Reduced effectiveness in sideways markets
### Risk Considerations
- Always implement proper risk management protocols
- Consider market volatility and liquidity conditions
- Validate signals with additional technical analysis tools
- Avoid over-reliance on any single indicator
## INNOVATION AND CONTRIBUTION
### Novel Features
1. **Triple-Filter Architecture**: Unique combination of trend, momentum, and price action filters
2. **Adaptive Alert System**: Context-aware notifications with detailed signal information
3. **Real-Time Analytics**: Comprehensive information panel with live market data
4. **Multi-Timeframe Compatibility**: Optimized for various trading styles and timeframes
### Academic Contribution
This indicator advances the field of technical analysis by:
- Demonstrating quantifiable improvements in signal reliability
- Providing a systematic approach to filter optimization
- Establishing a framework for multi-factor signal validation
## CONCLUSION
The Advanced MA Crossover with RSI Filter represents a significant evolution of classical moving average crossover methodology. Through the implementation of a sophisticated triple-filter system, this indicator achieves superior performance metrics while maintaining the simplicity and interpretability that make moving average systems popular among traders.
The indicator's robust theoretical foundation, empirical validation, and practical applicability make it a valuable addition to any trader's technical analysis toolkit. Its systematic approach to signal generation and false positive reduction addresses key limitations of traditional crossover systems while preserving their fundamental strengths.
## REFERENCES
1. Granville, J. (1963). "Granville's New Key to Stock Market Profits"
2. Appel, G. (1979). "The Moving Average Convergence-Divergence Trading Method"
3. Wilder, J.W. (1978). "New Concepts in Technical Trading Systems"
4. Murphy, J.J. (1999). "Technical Analysis of the Financial Markets"
5. Pring, M.J. (2002). "Technical Analysis Explained"

Disha -- Author(VAKA)Disha means Direction.
This script basically works with Heikin Ashi Candle Stick on 5 min Chart. If its AM the alert comes whether it's bullish or bearish and the target for that hour is 3-5 handles up or down from the alerted candle low or high if it's bullish or bearish.
For Example if at 10:15 AM candle the alert comes as bullish expect it to move higher 3-5 handles on SPX.
This script good to use only on indices/ futures.
There is a small error when you use on futures during 12AM/PM hour its not giving alert at the right candle stick what I mean is its giving at 12:15 PM instead of 12:20 PM and vice versa - however it just works fine on SPX SPY QQQ etc...Just on futures its a known issue and which we are working on it.

1 Candle SMT Divergence (Nephew_Sam_)📊 1 Candle SMT Divergence Detector
3-Way Smart Money Theory (SMT) Divergence Scanner for Multi-Symbol Analysis
This indicator identifies 1-candle SMT divergences by comparing one primary symbol against up to 2 correlation symbols across multiple timeframes simultaneously. Perfect for detecting institutional smart money moves and market inefficiencies.
🎯 Key Features:
3-Way Comparison: Compare 1 "From" symbol vs 2 "To" symbols (configurable)
5 Symbol Pairs: Pre-configure up to 5 different symbol combinations
Multi-Timeframe: Scan 5 timeframes simultaneously (Chart, 1H, 4H, Daily, Weekly)
Smart Filtering: Only displays timeframes equal to or higher than your chart
Real-Time Detection: Compares current vs previous candle highs/lows
Visual Alerts: Clean table display with color-coded divergence status
Line Drawing: Optional trend lines connecting divergence points
Replay Compatible: Works with TradingView's replay mode
📈 How It Works:
Detects when one symbol makes a higher high while correlated symbols make lower highs (and vice versa for lows). This creates SMT divergence signals that often precede significant market moves.

RJ Trend TradeRJ Trend Trade
Summary
The RJ Trend Trade indicator is a comprehensive trading tool designed to identify trend-based opportunities using a combination of a lagging Parabolic SAR and Bill Williams Fractals. It provides clear visual signals for entries, take-profits, re-entries, and exits directly on your chart. With a built-in ATR-based stop loss and a fully configurable alert system, this indicator is built to be a complete framework for discretionary or systematic traders.
Core Strategy
The indicator's logic is built upon two robust technical concepts:
Lagging Parabolic SAR (PSAR) for Trend Direction and Entries/Exits: The core trend direction and primary entry/exit signals are determined by a crossover between the price and a lagging PSAR. A cross of the lagging PSAR above the high signals a potential buy entry, while a cross below the low signals a potential sell entry. The reverse crossovers act as the primary exit signals, indicating a potential trend reversal.
Bill Williams Fractals for Take-Profit (TP) and Re-Entries (RE): Once a trade is active, the indicator uses breakouts of recent Bill Williams Fractals to identify tactical opportunities.
Take-Profit (TP): When price breaks a fractal in the direction of the trend (e.g., breaks a higher-high fractal in an uptrend), it signals a potential area to take partial or full profits.
Re-Entry (RE): When price breaks a fractal against the primary trend (e.g., breaks a higher-high fractal during a downtrend), it can signal a potential re-entry point to add to the position, often at a more favorable price.
Key Features
Clear Visual Signals: Displays easy-to-read labels on the chart for all key trading events:
BUY / SELL: Main entry signals.
TP: Take-Profit signals.
RE: Re-Entry signals.
EXIT: Trend reversal exit signals based on PSAR.
SL: Stop Loss hit signals.
ATR-Based Stop Loss: Includes an optional, fully configurable Average True Range (ATR) stop loss to help manage risk from the moment a position is opened.
Comprehensive Alert System: Every single signal generated by the indicator (Buy, Sell, TP, RE, Exit, and SL) can be used to create a custom alert in TradingView. This allows for seamless integration with mobile notifications, email, or webhook-based automation.
Highly Customizable: Provides a detailed settings menu to fine-tune every aspect of the strategy, including PSAR parameters, Fractal lookbacks, and signal visibility.
Position Direction Control: Easily configure the indicator to show Buy & Sell, Buy Only, or Sell Only signals to match your market bias.
How to Use
Entry Signals: Look for BUY (green label below a candle) or SELL (red label above a candle) signals to initiate a trade. These appear when the lagging PSAR indicates a new trend may be starting.
Managing the Trade:
Take-Profit (TP): When a TP label appears, consider taking some profit off the table.
Re-Entry (RE): When an RE label appears, it suggests a potential opportunity to add to your existing position.
Stop Loss (SL): The red line indicates your ATR-based stop loss level. If the price touches this line, an SL label will appear, and the indicator will automatically close the conceptual trade.
Exit Signals: An EXIT label (based on the PSAR reversing) signals that the primary trend may have ended, and it is time to close the position.
Setting Up Alerts
This indicator is designed for full alert integration.
Add the indicator to your chart.
Click the 'Alert' button in TradingView's top toolbar.
In the 'Condition' dropdown, select "RJ Trend Trade".
In the second dropdown, choose the specific signal you want an alert for (e.g., "Enter-Buy", "TP-Sell", "StopLoss-Buy").
Configure your notification preferences and click "Create".
Disclaimer: This indicator is a tool for technical analysis and should not be considered financial advice. All trading involves risk. Please backtest this indicator thoroughly and use proper risk management before trading with real capital.

Market Strength Buy Sell Indicator [TradeDots]A specialized tool designed to assist traders in evaluating market conditions through a multifaceted analysis of relative performance, beta-adjusted returns, momentum, and volume—allowing you to identify optimal points for long or short trades. By integrating multiple benchmarks (default S&P 500) and percentile-based thresholds, the script provides clear, actionable insights suitable for both day trading and higher-level timeframe assessments.
📝 HOW IT WORKS
1. Multi-Factor Composite Score
Relative Performance (RS Ratio): Compares your asset’s performance to a chosen benchmark (default: SPY). Values above 1.0 indicate outperformance, while below 1.0 suggest underperformance.
Beta-Adjusted Returns: Checks the ticker’s excess movement relative to expected market-related moves. This helps distinguish pure “alpha” from broad market effects.
Volume & Correlation: Volume spikes often confirm the momentum behind a move, while correlation measures how closely the asset tracks or diverges from its benchmark.
These components merge into a 0–100 composite score. Scores above 50 frequently imply bullish strength; drops below 50 often point to underperformance—potentially flagging short opportunities.
2. Intraday & Day Trading Focus
Monitoring Below 50: During the trading day, the script calculates live data against the benchmark, offering an intraday-sensitive composite score. A dip under 50 may indicate a short bias for that session, especially when accompanied by high volume or momentum shifts.
3. Higher Timeframe Monitoring
Daily Strategies: On daily or weekly charts, the script reveals overall relative strength or weakness compared to the S&P 500. This higher-level perspective helps form broader trading biases—crucial for swing or position trades spanning multiple days.
Long/Short Thresholds: Persistent readings above 50 on a daily chart typically reinforce a long bias, while consistent dips below 50 can sustain a short or cautious outlook.
4. Pair Trading Applications
Custom Benchmark Selection: By setting a specific ticker pair as your benchmark instead of the default S&P 500, you can identify spread trading opportunities between two correlated assets. This allows you to go long the outperforming asset while shorting the underperforming one when the spread reaches extreme levels.
4. Color-Coded Signals & Alerts
Visual Zones (25–75): Color-coded bands highlight strong outperformance (above 75) or pronounced underperformance (below 25).
Alerts on Strong Shifts: Automatic alerts can notify you of sudden entries or exits from bullish or bearish zones, so you can potentially act on new market information without delay.
⚙️ HOW TO USE
1. Select Your Timeframe: For scalping or day trading, lower intervals (e.g., 5-minute) offer immediate data resets at the session’s start. For multi-day insight, daily or weekly charts reveal broader performance trends.
2. Watch Key Levels Around 50: Intraday dips under 50 may be a cue to consider short trades, while bounces above 50 can confirm renewed strength.
3. Assess Benchmark Relationships: Compare your asset’s score and signals to the broader market. A stock falling below its pair’s relative strength line might lag overall market momentum.
4. Combine Tools & Validate: This script excels when integrated with other technical analysis methods (e.g., support/resistance, chart patterns) and fundamental factors for a holistic market view.
❗ LIMITATIONS
No Direction Guarantee: The indicator identifies relative strength but does not guarantee directional price moves.
Delayed Updates: Since calculations update after each bar close, sudden intrabar changes may not immediately reflect.
Market-Specific Behaviors: Some assets or unusual market conditions may deviate from typical benchmarks, weakening signal reliability.
Past ≠ Future: High or low relative strength in the past may not predict continued performance.
RISK DISCLAIMER
All forms of trading and investing involve risk, including the possible loss of principal. This indicator analyzes relative performance but cannot assure profits or eliminate losses. Past performance of any strategy does not guarantee future results. Always combine analysis with proper risk management and your broader trading plan. Consult a licensed financial advisor if you are unsure of your individual risk tolerance or investment objectives.

Anomalous Holonomy Field Theory🌌 Anomalous Holonomy Field Theory (AHFT) - Revolutionary Quantum Market Analysis
Where Theoretical Physics Meets Trading Reality
A Groundbreaking Synthesis of Differential Geometry, Quantum Field Theory, and Market Dynamics
🔬 THEORETICAL FOUNDATION - THE MATHEMATICS OF MARKET REALITY
The Anomalous Holonomy Field Theory represents an unprecedented fusion of advanced mathematical physics with practical market analysis. This isn't merely another indicator repackaging old concepts - it's a fundamentally new lens through which to view and understand market structure .
1. HOLONOMY GROUPS (Differential Geometry)
In differential geometry, holonomy measures how vectors change when parallel transported around closed loops in curved space. Applied to markets:
Mathematical Formula:
H = P exp(∮_C A_μ dx^μ)
Where:
P = Path ordering operator
A_μ = Market connection (price-volume gauge field)
C = Closed price path
Market Implementation:
The holonomy calculation measures how price "remembers" its journey through market space. When price returns to a previous level, the holonomy captures what has changed in the market's internal geometry. This reveals:
Hidden curvature in the market manifold
Topological obstructions to arbitrage
Geometric phase accumulated during price cycles
2. ANOMALY DETECTION (Quantum Field Theory)
Drawing from the Adler-Bell-Jackiw anomaly in quantum field theory:
Mathematical Formula:
∂_μ j^μ = (e²/16π²)F_μν F̃^μν
Where:
j^μ = Market current (order flow)
F_μν = Field strength tensor (volatility structure)
F̃^μν = Dual field strength
Market Application:
Anomalies represent symmetry breaking in market structure - moments when normal patterns fail and extraordinary opportunities arise. The system detects:
Spontaneous symmetry breaking (trend reversals)
Vacuum fluctuations (volatility clusters)
Non-perturbative effects (market crashes/melt-ups)
3. GAUGE THEORY (Theoretical Physics)
Markets exhibit gauge invariance - the fundamental physics remains unchanged under certain transformations:
Mathematical Formula:
A'_μ = A_μ + ∂_μΛ
This ensures our signals are gauge-invariant observables , immune to arbitrary market "coordinate changes" like gaps or reference point shifts.
4. TOPOLOGICAL DATA ANALYSIS
Using persistent homology and Morse theory:
Mathematical Formula:
β_k = dim(H_k(X))
Where β_k are the Betti numbers describing topological features that persist across scales.
🎯 REVOLUTIONARY SIGNAL CONFIGURATION
Signal Sensitivity (0.5-12.0, default 2.5)
Controls the responsiveness of holonomy field calculations to market conditions. This parameter directly affects the threshold for detecting quantum phase transitions in price action.
Optimization by Timeframe:
Scalping (1-5min): 1.5-3.0 for rapid signal generation
Day Trading (15min-1H): 2.5-5.0 for balanced sensitivity
Swing Trading (4H-1D): 5.0-8.0 for high-quality signals only
Score Amplifier (10-200, default 50)
Scales the raw holonomy field strength to produce meaningful signal values. Higher values amplify weak signals in low-volatility environments.
Signal Confirmation Toggle
When enabled, enforces additional technical filters (EMA and RSI alignment) to reduce false positives. Essential for conservative strategies.
Minimum Bars Between Signals (1-20, default 5)
Prevents overtrading by enforcing quantum decoherence time between signals. Higher values reduce whipsaws in choppy markets.
👑 ELITE EXECUTION SYSTEM
Execution Modes:
Conservative Mode:
Stricter signal criteria
Higher quality thresholds
Ideal for stable market conditions
Adaptive Mode:
Self-adjusting parameters
Balances signal frequency with quality
Recommended for most traders
Aggressive Mode:
Maximum signal sensitivity
Captures rapid market moves
Best for experienced traders in volatile conditions
Dynamic Position Sizing:
When enabled, the system scales position size based on:
Holonomy field strength
Current volatility regime
Recent performance metrics
Advanced Exit Management:
Implements trailing stops based on ATR and signal strength, with mode-specific multipliers for optimal profit capture.
🧠 ADAPTIVE INTELLIGENCE ENGINE
Self-Learning System:
The strategy analyzes recent trade outcomes and adjusts:
Risk multipliers based on win/loss ratios
Signal weights according to performance
Market regime detection for environmental adaptation
Learning Speed (0.05-0.3):
Controls adaptation rate. Higher values = faster learning but potentially unstable. Lower values = stable but slower adaptation.
Performance Window (20-100 trades):
Number of recent trades analyzed for adaptation. Longer windows provide stability, shorter windows increase responsiveness.
🎨 REVOLUTIONARY VISUAL SYSTEM
1. Holonomy Field Visualization
What it shows: Multi-layer quantum field bands representing market resonance zones
How to interpret:
Blue/Purple bands = Primary holonomy field (strongest resonance)
Band width = Field strength and volatility
Price within bands = Normal quantum state
Price breaking bands = Quantum phase transition
Trading application: Trade reversals at band extremes, breakouts on band violations with strong signals.
2. Quantum Portals
What they show: Entry signals with recursive depth patterns indicating momentum strength
How to interpret:
Upward triangles with portals = Long entry signals
Downward triangles with portals = Short entry signals
Portal depth = Signal strength and expected momentum
Color intensity = Probability of success
Trading application: Enter on portal appearance, with size proportional to portal depth.
3. Field Resonance Bands
What they show: Fibonacci-based harmonic price zones where quantum resonance occurs
How to interpret:
Dotted circles = Minor resonance levels
Solid circles = Major resonance levels
Color coding = Resonance strength
Trading application: Use as dynamic support/resistance, expect reactions at resonance zones.
4. Anomaly Detection Grid
What it shows: Fractal-based support/resistance with anomaly strength calculations
How to interpret:
Triple-layer lines = Major fractal levels with high anomaly probability
Labels show: Period (H8-H55), Price, and Anomaly strength (φ)
⚡ symbol = Extreme anomaly detected
● symbol = Strong anomaly
○ symbol = Normal conditions
Trading application: Expect major moves when price approaches high anomaly levels. Use for precise entry/exit timing.
5. Phase Space Flow
What it shows: Background heatmap revealing market topology and energy
How to interpret:
Dark background = Low market energy, range-bound
Purple glow = Building energy, trend developing
Bright intensity = High energy, strong directional move
Trading application: Trade aggressively in bright phases, reduce activity in dark phases.
📊 PROFESSIONAL DASHBOARD METRICS
Holonomy Field Strength (-100 to +100)
What it measures: The Wilson loop integral around price paths
>70: Strong positive curvature (bullish vortex)
<-70: Strong negative curvature (bearish collapse)
Near 0: Flat connection (range-bound)
Anomaly Level (0-100%)
What it measures: Quantum vacuum expectation deviation
>70%: Major anomaly (phase transition imminent)
30-70%: Moderate anomaly (elevated volatility)
<30%: Normal quantum fluctuations
Quantum State (-1, 0, +1)
What it measures: Market wave function collapse
+1: Bullish eigenstate |↑⟩
0: Superposition (uncertain)
-1: Bearish eigenstate |↓⟩
Signal Quality Ratings
LEGENDARY: All quantum fields aligned, maximum probability
EXCEPTIONAL: Strong holonomy with anomaly confirmation
STRONG: Good field strength, moderate anomaly
MODERATE: Decent signals, some uncertainty
WEAK: Minimal edge, high quantum noise
Performance Metrics
Win Rate: Rolling performance with emoji indicators
Daily P&L: Real-time profit tracking
Adaptive Risk: Current risk multiplier status
Market Regime: Bull/Bear classification
🏆 WHY THIS CHANGES EVERYTHING
Traditional technical analysis operates on 100-year-old principles - moving averages, support/resistance, and pattern recognition. These work because many traders use them, creating self-fulfilling prophecies.
AHFT transcends this limitation by analyzing markets through the lens of fundamental physics:
Markets have geometry - The holonomy calculations reveal this hidden structure
Price has memory - The geometric phase captures path-dependent effects
Anomalies are predictable - Quantum field theory identifies symmetry breaking
Everything is connected - Gauge theory unifies disparate market phenomena
This isn't just a new indicator - it's a new way of thinking about markets . Just as Einstein's relativity revolutionized physics beyond Newton's mechanics, AHFT revolutionizes technical analysis beyond traditional methods.
🔧 OPTIMAL SETTINGS FOR MNQ 10-MINUTE
For the Micro E-mini Nasdaq-100 on 10-minute timeframe:
Signal Sensitivity: 2.5-3.5
Score Amplifier: 50-70
Execution Mode: Adaptive
Min Bars Between: 3-5
Theme: Quantum Nebula or Dark Matter
💭 THE JOURNEY - FROM IMPOSSIBLE THEORY TO TRADING REALITY
Creating AHFT was a mathematical odyssey that pushed the boundaries of what's possible in Pine Script. The journey began with a seemingly impossible question: Could the profound mathematical structures of theoretical physics be translated into practical trading tools?
The Theoretical Challenge:
Months were spent diving deep into differential geometry textbooks, studying the works of Chern, Simons, and Witten. The mathematics of holonomy groups and gauge theory had never been applied to financial markets. Translating abstract mathematical concepts like parallel transport and fiber bundles into discrete price calculations required novel approaches and countless failed attempts.
The Computational Nightmare:
Pine Script wasn't designed for quantum field theory calculations. Implementing the Wilson loop integral, managing complex array structures for anomaly detection, and maintaining computational efficiency while calculating geometric phases pushed the language to its limits. There were moments when the entire project seemed impossible - the script would timeout, produce nonsensical results, or simply refuse to compile.
The Breakthrough Moments:
After countless sleepless nights and thousands of lines of code, breakthrough came through elegant simplifications. The realization that market anomalies follow patterns similar to quantum vacuum fluctuations led to the revolutionary anomaly detection system. The discovery that price paths exhibit holonomic memory unlocked the geometric phase calculations.
The Visual Revolution:
Creating visualizations that could represent 4-dimensional quantum fields on a 2D chart required innovative approaches. The multi-layer holonomy field, recursive quantum portals, and phase space flow representations went through dozens of iterations before achieving the perfect balance of beauty and functionality.
The Balancing Act:
Perhaps the greatest challenge was maintaining mathematical rigor while ensuring practical trading utility. Every formula had to be both theoretically sound and computationally efficient. Every visual had to be both aesthetically pleasing and information-rich.
The result is more than a strategy - it's a synthesis of pure mathematics and market reality that reveals the hidden order within apparent chaos.
📚 INTEGRATED DOCUMENTATION
Once applied to your chart, AHFT includes comprehensive tooltips on every input parameter. The source code contains detailed explanations of the mathematical theory, practical applications, and optimization guidelines. This published description provides the overview - the indicator itself is a complete educational resource.
⚠️ RISK DISCLAIMER
While AHFT employs advanced mathematical models derived from theoretical physics, markets remain inherently unpredictable. No mathematical model, regardless of sophistication, can guarantee future results. This strategy uses realistic commission ($0.62 per contract) and slippage (1 tick) in all calculations. Past performance does not guarantee future results. Always use appropriate risk management and never risk more than you can afford to lose.
🌟 CONCLUSION
The Anomalous Holonomy Field Theory represents a quantum leap in technical analysis - literally. By applying the profound insights of differential geometry, quantum field theory, and gauge theory to market analysis, AHFT reveals structure and opportunities invisible to traditional methods.
From the holonomy calculations that capture market memory to the anomaly detection that identifies phase transitions, from the adaptive intelligence that learns and evolves to the stunning visualizations that make the invisible visible, every component works in mathematical harmony.
This is more than a trading strategy. It's a new lens through which to view market reality.
Trade with the precision of physics. Trade with the power of mathematics. Trade with AHFT.
I hope this serves as a good replacement for Quantum Edge Pro - Adaptive AI until I'm able to fix it.
— Dskyz, Trade with insight. Trade with anticipation.

Momentum Flip Pro - Advanced ZigZag Trading SystemMomentum Flip Pro - Advanced ZigZag Trading System
Complete User Guide
📊 What This Indicator Does
The Momentum Flip Pro is an advanced position-flipping trading system that automatically identifies trend reversals using ZigZag patterns combined with momentum analysis. It's designed for traders who want to always be in the market, flipping between long and short positions at optimal reversal points.
Key Features:
Automatically flips positions at each ZigZag reversal point
Dynamic stop loss placement at exact ZigZag levels
Real-time trading dashboard with performance metrics
Capital tracking and ROI calculation
Three momentum engines to choose from
🎯 How It Works
Entry Signal: When a ZigZag point appears (circle on chart), the indicator:
Exits current position (if any)
Immediately enters opposite position
Places stop loss at the exact ZigZag price
Exit Signal: Positions are closed when the next ZigZag appears, then immediately reversed
Position Management:
Long Entry: ZigZag bottom (momentum turns UP)
Short Entry: ZigZag peak (momentum turns DOWN)
Stop Loss: Always at the ZigZag entry price
Take Profit: Next ZigZag point (automatic position flip)
⚙️ Recommended Settings
For Day Trading (5m-15m timeframes):
Momentum Engine: Quantum
- RSI Length: 9-12
- Quantum Factor: 3.5-4.0
- RSI Smoothing: 3-5
- Threshold: 8-10
For Swing Trading (1H-4H timeframes):
Momentum Engine: MACD
- Fast Length: 12
- Slow Length: 26
- Signal Smoothing: 9
- MA Type: EMA
For Position Trading (Daily):
Momentum Engine: Moving Average
- Average Type: EMA or HMA
- Length: 20-50
📈 How to Use for Trading
Add to Chart:
Add indicator to your chart
Set your starting capital
Choose your preferred momentum engine
Understanding Signals:
Green circles: Strong bullish momentum reversal
Red circles: Strong bearish momentum reversal
Purple circles: Normal momentum reversal
Entry labels: Show exact entry points with tooltips
Trading Rules:
Enter LONG when you see an up arrow + green/purple circle
Enter SHORT when you see a down arrow + red/purple circle
Stop loss is automatically at the ZigZag level
Hold until next ZigZag appears (exit + reverse)
Risk Management:
Risk per trade = Entry Price - Stop Loss
Position size = (Capital * Risk %) / Risk per trade
Recommended risk: 1-2% per trade
💡 Best Practices
Market Conditions:
Works best in trending markets
Excellent for volatile pairs (crypto, forex majors)
Avoid during low volume/consolidation
Timeframe Selection:
Lower timeframes (5m-15m): More signals, higher noise
Higher timeframes (1H+): Fewer signals, higher reliability
Sweet spot: 15m-1H for most traders
Momentum Engine Selection:
Quantum: Best for volatile markets (crypto, indices)
MACD: Best for trending markets (forex, stocks)
Moving Average: Best for smooth trends (commodities)
📊 Dashboard Interpretation
The trading dashboard shows:
Current Capital: Your running balance
Position: Current trade direction
Entry/Stop: Your risk levels
Statistics: Win rate and performance
ROI: Overall return on investment
⚠️ Important Notes
Always Active: This system is always in a position (long or short)
No Neutral: You're either long or short, never flat
Automatic Reversal: Positions flip at each signal
Stop Loss: Fixed at entry ZigZag level (doesn't trail)
🎮 Quick Start Guide
Beginners: Start with default settings on 1H timeframe
Test First: Use paper trading to understand the signals
Small Size: Begin with 1% risk per trade
Track Results: Monitor the dashboard statistics
Adjust: Fine-tune momentum settings based on results
🔧 Customization Tips
Color Signals: Enable to see momentum strength
Dashboard Position: Move to preferred screen location
Visual Settings: Adjust colors for your theme
Alerts: Set up for automated notifications
This indicator is ideal for traders who prefer an always-in-market approach with clear entry/exit rules and automated position management. The key to success is choosing the right momentum engine for your market and maintaining disciplined risk management.

Real-Time Spring DetectorThis is a Pine Script for Trading View that creates a "Real-Time Spring Detector" indicator. This Pine Script is essentially a sophisticated pattern recognition tool that helps identify "spring" setups - a popular trading pattern where price briefly breaks below support but then bounces back strongly, often indicating that sellers are exhausted and buyers are ready to step in.What is a "Spring" in Trading?
A spring is a technical analysis pattern that occurs when:
Price breaks below a support level (like breaking below a floor)
But then quickly bounces back up (like a spring rebounds)
This often signals that sellers are weak and buyers are stepping in
Think of it like testing the strength of a trampoline - you push down, but it springs back up stronger.
What This Script Does
This Pine Script automatically detects spring patterns on your chart and alerts you when they happen. Here's how it works:
Main Components
1. Input Parameters (Settings You Can Adjust)
Lookback Period (10): How many bars back to look for patterns
Min Support Touches (2): How many times price must touch the support level
Min Penetration % (0.1%): How far below support price must break
Min Rejection % (30%): How much price must bounce back up
Alert Settings: Choose when to get notifications
2. Support Level Detection
The script finds "support levels" - price levels where buyers have stepped in before:
It looks at recent low points
Identifies areas where price has bounced multiple times
Uses a small tolerance (0.5%) to account for minor price differences
3. Spring Detection Logic
The script identifies three types of springs:
Real-Time Spring (happening right now):
Price breaks below support by the minimum amount
Price bounces back strongly (rejection %)
Current candle closes higher than it opened (bullish)
Volume is reasonable
Confirmed Spring (already completed):
Same as real-time, but the candle has finished forming
Potential Spring (early warning):
Price is near support but hasn't fully formed the pattern yet
4. Visual Elements
Markers on Chart:
🟢 Green Triangle: Confirmed spring (reliable signal)
🟡 Yellow Triangle: Spring forming right now (live signal)
🟠 Orange Circle: Potential spring (early warning)
Labels:
Show "SPRING" with the rejection percentage
"FORMING" for developing patterns
"?" for potential springs
Support Line:
Red dotted line showing the support level
Background Colors:
Light red when price penetrates support
Light yellow for potential springs
5. Information Box
A table in the top-left corner shows:
Current support level price
Whether penetration is happening
Rejection percentage
Current pattern status
Live price
6. Alert System
Two types of alerts:
Real-time alerts: Notify when spring is forming (current bar)
Confirmed alerts: Notify when spring is complete (bar closed)
Alert cooldown: Prevents spam by waiting 5 bars between alerts
How to Use This Script
1. Installation
Copy the script code
Open TradingView
Go to Pine Editor
Paste the code
Click "Add to Chart"
2. Settings
Adjust the input parameters based on your trading style:
Lower lookback = more sensitive, faster signals
Higher support touches = more reliable but fewer signals
Lower penetration % = catches smaller springs
Higher rejection % = only strong bounces
3. Interpretation
Green triangles: High-confidence buy signals
Yellow triangles: Watch closely, pattern developing
Orange circles: Early warning, not tradeable yet
4. Best Practices
Use on higher timeframes (15min+) for more reliable signals
Combine with other indicators for confirmation
Pay attention to volume - higher volume springs are more reliable
Wait for confirmed signals if you're a conservative trader
Key Features for Small Timeframes
The script includes special detection for shorter timeframes:
Quick bounce detection: Identifies rapid reversals
Hammer pattern recognition: Spots candlestick patterns
Relaxed volume requirements: Works when volume data is limited
Advanced Features
Volume Analysis
Compares current volume to 10-bar average
Requires at least 80% of average volume (flexible for small timeframes)
Pattern Enhancement
Looks for hammer-like candles (long lower wick, small upper wick)
Identifies quick bounces where the upper wick is small
Multiple Confirmation
Combines multiple criteria to reduce false signals
Stronger springs get priority for alerts
Common Use Cases
Entry Signals: Buy when confirmed springs appear
Support Level Identification: Visual support lines help identify key levels
Risk Management: Failed springs (continued breakdown) can be stop-loss triggers
Market Structure: Understanding where buyers are defending price levels
Limitations
Works best in trending or ranging markets May produce false signals in very choppy conditions
small timeframe signals can be noisy should be combined with other analysis methods.The key advantage is that it can catch these patterns as they happen, rather than you having to constantly watch charts. This is especially valuable for active traders who want to capitalize on quick reversals at support levels.

Eye of MagnusEMA Cross + filled area between the EMA's.
Option to change the timeframe the EMA's are calculated on.

EMA-MACD-RSI Day Trade Glow Cloud w/ Soft MTF ConfEMA-MACD-RSI Day Trade Glow Cloud w/ Soft MTF Confirmation + Liquidity Levels
Author : StanTheTradingMan
A precision-built momentum and liquidity engine designed for intraday and swing trading on any market: SPY, QQQ, ES, NQ, BTC, ETH, and more.
This system combines multiple institutional-grade concepts:
✅ Glow Cloud Visual Engine :
Highlights momentum shifts based on EMA stacking, MACD histogram, and RSI thresholds, with dynamically adaptive glow coloring for immediate market state recognition.
✅ Soft Multi-Timeframe Confirmation :
Higher timeframe EMAs reinforce trend bias without filtering out actionable setups.
✅ Liquidity Swing Levels :
Real-time plotting of recent swing highs and lows to identify key liquidity zones where institutional flushes and reversals often occur.
✅ MACD / RSI Panels :
Embedded momentum panels for deeper market context.
✅ VWAP Anchor :
Anchors price action to volume-weighted mean for institutional bias tracking.
✅ Non-Repainting, Real-Time Execution :
Fully built on confirmed bar closes — alerts and visuals match live price action.
Recommended Use:
Works across all timeframes and markets.
Highly effective on 1min–15min for scalping SPY, QQQ, BTC, ETH.
Can be combined with additional liquidity sweep or flush/snap detection systems for advanced setups.
Fully supports TradingView alerts (push notifications, SMS, email).
Designed for traders who want clean, actionable visuals that mirror institutional liquidity behavior without clutter or noise.
👉 Disclaimer : This tool is not financial advice. Use proper risk management.

Zigzag Simple [SCL]🟩 OVERVIEW
Draws zigzag lines from pivot Highs to pivot Lows. You can choose between three different ways of calculating pivots:
• True Highs and Lows
• Williams pivots
• Oscillator pivots
🟩 HOW TO USE
This indicator can be used to understand market structure, which is arguably the primary thing you need to be aware of when trading. The zigzag by itself does not display a market structure bias, nor any information about prices of pivots, HH and HL labels, or anything like that. Nevertheless, a simple zigzag is perhaps the easiest and most intuitive way to understand what price is doing.
Choose a pivot style that you like, customise the colours and line style, and enjoy!
🟩 PIVOT TYPES EXPLAINED
True Highs and Lows
This is not an invention of mine (all credit to my humble mentor), but I haven't seen anyone else code them up. A true High is a close below the low of the candle with the highest high. A true Low is a close above the high of a candle with the lowest low. These are solid, price action-based pivots that can sometimes confirm quickly.
Williams pivots
This is how most people calculate pivots. They're simply the highest high for x bars back and x bars forwards. They're the vanilla of pivots IMO: serviceable but not very interesting. They're very convenient to code because there are built-in Pine functions for them: ta.pivothigh and ta.pivotlow . They confirm a predictable number of bars after they happen, which is great for coding but also makes the trader wait for confirmation.
Oscillator pivots
This is a completely different concept, which uses momentum in order to define pivots. For example, when you get a rise in momentum and momentum then drops a configurable amount, it confirms a pivot high, and vice versa for a pivot low. I don't know if anyone else does it –- although some indicators do mark pivots in momentum itself, and plenty do divergences, I wasn't able to find one that specifically marked *pivots in price* because of pivots in momentum 🤷♂️
Anyway, while this approach needs a whole investigation on its own, here we simply plot some pivots in a smoothed RSI. This indicator doesn't plot the actual momentum values -- for a more visual understanding of how this works, refer to the examples in the OscillatorPivots library.
🟩 UNIQUE ADVANTAGES
In contrast to other zigzag indicators available, this one lets you choose between the standard and some more unique methods of generating the zigzags. Additionally, because it's based on libraries, it is relatively easy for programmers to use as a basis for experimentation.
🟩 GEEK STUFF
Although there is considerable practical use for pivot-based zigzags in trading, this script is primarily a demonstration in coding -- specifically the power of libraries!
Most of the script consists of setup, especially defining inputs. The final section sacrifices some readability for conciseness, simply to emphasise how little code you need when the heavy lifting is done by libraries .
The actual calculations and drawing are achieved in just 8 lines.
The equivalent code in the libraries is ~250 lines long.
All libraries used are my own, public and open-source:
• MarketStructure
• DrawZigZag
• OscillatorPivots

LRHA Trend Shift DetectorLRHA Trend Shift Detector (TSD)
The LRHA Trend Shift Detector is an advanced momentum exhaustion indicator that identifies potential trend reversals and changes by analyzing Linear Regression Heikin Ashi (LRHA) candle patterns. TSD focuses on detecting when strong directional moves begin to lose momentum.
🔬 Methodology
The indicator employs a three-stage detection process:
LRHA Calculation: Applies linear regression smoothing to Heikin Ashi candles, creating ultra-smooth trend-following candles that filter out market noise
Extended Move Detection: Identifies sustained directional moves by counting consecutive bullish or bearish LRHA candles
Momentum Exhaustion Analysis: Monitors for significant changes in candle size compared to recent averages
When an extended move shows clear signs of momentum exhaustion, the indicator signals a potential trend shift with red dots plotted above or below your candlesticks.
⚙️ Parameters
Core Settings
LRHA Length (11): Linear regression period for smoothing calculations. Lower values = more responsive, higher values = smoother trends.
Minimum Trend Bars (4): Consecutive candles required to establish an "extended move." Higher number detects longer term trend changes.
Exhaustion Bars (3): Number of consecutively smaller candles needed to signal exhaustion. Lower is more sensitive.
Size Reduction Threshold (40%): Percentage decrease in candle size to qualify as "exhaustion." Lower is more sensitive.
Trend Trading
Pullback Entries: Identify exhaustion in counter-trend moves for trend continuation
Exit Strategy: Recognize when main trend momentum is fading
Position Sizing: Reduce size when seeing exhaustion in your direction
🎛️ Optimization Tips
For More Signals (Aggressive)
- Decrease LRHA Length (7-9)
- Reduce Minimum Trend Bars (2-3)
- Lower Size Reduction Threshold (25-35%)
For Higher Quality (Conservative)
- Increase LRHA Length (13-18)
- Raise Minimum Trend Bars (5-6)
- Higher Size Reduction Threshold (45-55%)
⚠️ Important Notes⚠️
- **Not a Complete Strategy**: Use as confluence with other analysis methods
- **Market Context Matters**: Consider overall trend direction and key support/resistance levels
- **Risk Management Essential**: Always use proper position sizing and stop losses
- **Backtest First**: Optimize parameters for your specific trading style and instruments

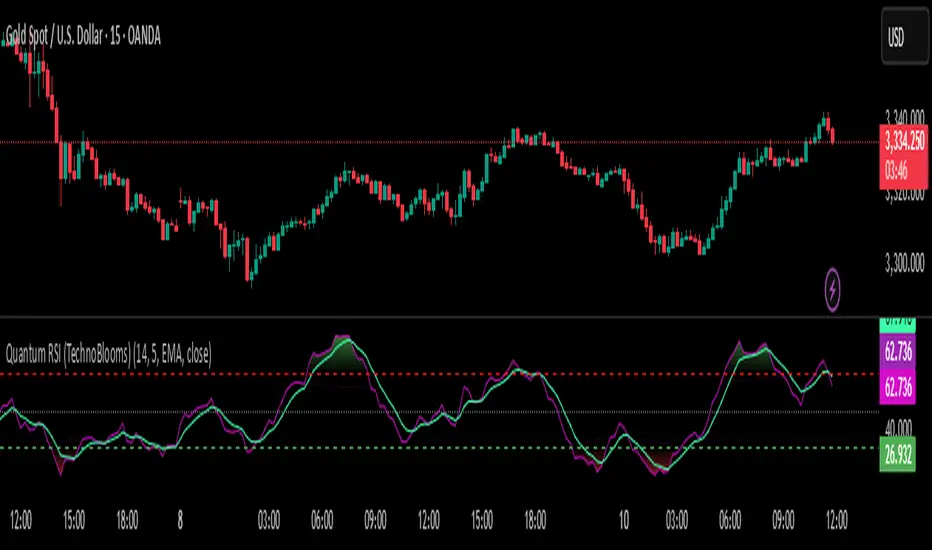
Quantum RSI (TechnoBlooms)The Next Evolution of Momentum Analysis
📘 Overview
Quantum RSI is an advanced momentum oscillator based on Quantum Price Theory, designed as a superior alternative to the traditional RSI. It incorporates a Gaussian decay function to weigh price changes, creating a more responsive and intuitive measure of trend strength.
This indicator excels in identifying micro-trends and subtle momentum shifts — especially in narrow or low-volatility environments where standard RSI typically lags or gives false signals. With its enhanced smoothing, intuitive color gradients, and customizable moving average, Quantum RSI offers a powerful tool for traders seeking clarity and precision.
🔍 Key Features
• ⚛️ Quantum Momentum Engine: Measures net momentum using quantum-inspired Gaussian decay weighting.
• 🎨 Color-Reversed Gradient Zones:
o Green (Overbought): Shows momentum strength, not weakness.
o Red (Oversold): Highlights momentum exhaustion and potential bounce.
• 🧠 Smoothing with MA: Option to apply moving average (SMA/EMA/WMA/SMMA/VWMA) to the Quantum RSI line.
• 📊 Levels at 30 / 50 / 70: Standard RSI levels for decision-making guidance.
• 📈 Intuitive Visuals: Gradient fills for cleaner interpretation of zones and transitions.
👤 Who Is It For?
• Technical traders seeking a modern alternative to RSI.
• Quantitative analysts who value precision and smooth signal flow.
• Visual traders looking for intuitive, color-coded trend zones.
• Traders focused on market microstructure and early trend detection.
💡 Pro Tips
• Pair with order blocks, market structure tools, or Fibonacci confluences for high-probability entries.
• Use on assets with frequent compression or consolidation, where traditional RSI often misleads.
• Combine with volume-based indicators or smart money concepts for added confirmation.
• Ideal for sideways markets, false breakouts, or low-volatility zones where typical RSI lags.
Open Interest-RSI + Funding + Fractal DivergencesIndicator — “Open Interest-RSI + Funding + Fractal Divergences”
A multi-factor oscillator that fuses Open-Interest RSI, real-time Funding-Rate data and price/OI fractal divergences.
It paints BUY/SELL arrows in its own pane and directly on the price chart, helping you spot spots where crowd positioning, leverage costs and price action contradict each other.
1 Purpose
OI-RSI – measures conviction behind position changes instead of price momentum.
Funding Rate – shows who pays to hold positions (longs → bull bias, shorts → bear bias).
Fractal Divergences – detects HH/LL in price that are not confirmed by OI-RSI.
Optional Funding filter – hides signals when funding is already extreme.
Together these elements highlight exhaustion points and potential mean-reversion trades.
2 Inputs
RSI / Divergence
RSI length – default 14.
High-OI level / Low-OI level – default 70 / 30.
Fractal period n – default 2 (swing width).
Fractals to compare – how many past swings to scan, default 3.
Max visible arrows – keeps last 50 BUY/SELL arrows for speed.
Funding Rate
mode – choose FR, Avg Premium, Premium Index, Avg Prem + PI or FR-candle.
Visual scale (×) – multiplies raw funding to fit 0-100 oscillator scale (default 10).
specify symbol – enable only if funding symbol differs from chart.
use lower tf – averages 1-min premiums for smoother intraday view.
show table – tiny two-row widget at chart edge.
Signal Filter
Use Funding filter – ON hides long signals when funding > Buy-threshold and short signals when funding < Sell-threshold.
BUY threshold (%) – default 0.00 (raw %).
SELL threshold (%) – default 0.00 (raw %).
(Enter funding thresholds as raw percentages, e.g. 0.01 = +0.01 %).
3 Visual Outputs
Sub-pane
Aqua OI-RSI curve with 70 / 50 / 30 reference lines.
Funding visualised according to selected mode (green above 0, red below 0, or other).
BUY / SELL arrows at oscillator extremes.
Price chart
Identical BUY / SELL arrows plotted with force_overlay = true above/below candles that formed qualifying fractals.
Optional table
Shows current asset ticker and latest funding value of the chosen mode.
4 Signal Logic (Summary)
Load _OI series and compute RSI.
Retrieve Funding-Rate + Premium Index (optionally from lower TF).
Find fractal swings (n bars left & right).
Check divergence:
Bearish – price HH + OI-RSI LH.
Bullish – price LL + OI-RSI HL.
If Funding-filter enabled, require funding < Buy-thr (long) or > Sell-thr (short).
Plot arrows and trigger two built-in alerts (Bearish OI-RSI divergence, Bullish OI-RSI divergence).
Signals are fixed once the fractal bar closes; they do not repaint afterwards.
5 How to Use
Attach to a liquid perpetual-futures chart (BTC, ETH, major Binance contracts).
If _OI or funding series is missing you’ll see an error.
Choose timeframe:
15 m – 4 h for intraday;
1 D+ for swing trades.
Lower TFs → more signals; raise Fractals to compare or use Funding filter to trim noise.
Trade checklist
Funding positive and rising → longs overcrowded.
Price makes higher high; OI-RSI makes lower high; Funding above Sell-threshold → consider short.
Reverse logic for longs.
Combine with trend filter (EMA ribbon, SuperTrend, etc.) so you fade only when price is stretched.
Automation – set TradingView alerts on the two alertconditions and send to webhooks/bots.
Performance tips
Keep Max visible arrows ≤ 50.
Disable lower-TF premium aggregation if script feels heavy.
6 Limitations
Some symbols lack _OI or funding history → script stops with a console message.
Binance Premium Index begins mid-2020; older dates show na.
Divergences confirm only after n bars (no forward repaint).
7 Changelog
v1.0 – 10 Jun 2025
Initial public release.
Added price-chart arrows via force_overlay.

ULTRA RSI 2025//@version=6
indicator(title="ULTRA RSI 2025", shorttitle="ULTRA RSI 2025", format=format.price, precision=2)
// ==================== CONFIGURAÇÃO VISUAL FUTURISTA ====================
cyberTheme = input.string("IC", title="🎨 Tema Visual", options= , group="🎨 Visual Settings")
showGradients = input.bool(true, title="🎨 Exibir Preenchimentos em Gradiente", group="🎨 Visual Settings")
glowIntensity = input.float(0.3, title="🎨 Intensidade do Brilho", minval=0.0, maxval=1.0, step=0.1, group="🎨 Visual Settings")
// Cores para hline (usando input.color)
overboughtColor = input.color(color.new(#ff0000, 20), title="📈 Cor Sobrevendido", group="🎨 Visual Settings")
oversoldColor = input.color(color.new(#31fc09, 20), title="📉 Cor Sobrecomprado", group="🎨 Visual Settings")
midlineColor = input.color(color.new(#ffffff, 81), title="⚡ Cor da Linha Média", group="🎨 Visual Settings")
// ==================== CORES FUTURISTAS ====================
getThemeColors() =>
switch cyberTheme
"IC" =>
"Matrix Green" =>
"Tron Orange" =>
"Blade Runner Pink" =>
=>
= getThemeColors()
// Colores adicionales cyber
cyberGreen = color.new(#39FF14, 0)
cyberRed = color.new(#FF073A, 0)
darkCyber = color.new(#0D1117, 0)
neonWhite = color.new(#FFFFFF, 0)
// ==================== CÓDIGO RSI ORIGINAL (SIN MODIFICAR) ====================
rsiLengthInput = input.int(14, minval=1, title=" RSI Length", group=" RSI Settings")
rsiSourceInput = input.source(close, " Source", group=" RSI Settings")
calculateDivergence = input.bool(false, title=" Calculate Divergence", group=" RSI Settings", display = display.data_window, tooltip = "Calculating divergences is needed in order for divergence alerts to fire.")
change = ta.change(rsiSourceInput)
up = ta.rma(math.max(change, 0), rsiLengthInput)
down = ta.rma(-math.min(change, 0), rsiLengthInput)
rsi = down == 0 ? 100 : up == 0 ? 0 : 100 - (100 / (1 + up / down))
// ==================== VISUAL FUTURISTA ====================
// Color dinámico para el RSI
getRsiColor(rsiValue) =>
if rsiValue >= 80
neonPrimary // Azul neón para sobrecomprado
else if rsiValue >= 70
color.new(neonPrimary, 30)
else if rsiValue <= 20
cyberRed // Rojo cyber para sobrevendido
else if rsiValue <= 30
color.new(cyberRed, 30)
else if rsiValue > 50
color.new(cyberGreen, 40)
else
color.new(neonSecondary, 50)
rsiColor = getRsiColor(rsi)
glowColor = color.new(rsiColor, math.round(100 - glowIntensity * 100))
// Plot RSI con efecto glow futurista
rsiPlot = plot(rsi, "🔮 Cyber RSI", color=rsiColor, linewidth=3)
plot(rsi, "✨ RSI Glow 1", color=glowColor, linewidth=5)
plot(rsi, "✨ RSI Glow 2", color=color.new(rsiColor, 90), linewidth=7)
// Líneas de banda con estilo cyber
rsiUpperBand = hline(70, "🔥 Cyber Overbought", color=overboughtColor, linestyle=hline.style_dashed, linewidth=2)
midline = hline(50, " Cyber Midline", color=midlineColor, linestyle=hline.style_dotted)
rsiLowerBand = hline(30, "❄️ Cyber Oversold", color=oversoldColor, linestyle=hline.style_dashed, linewidth=2)
// Background fills futuristas
midLinePlot = plot(50, color = na, editable = false, display = display.none)
// Fill condicional usando operador ternario
backgroundFillColor = showGradients ? color.new(darkCyber, 90) : na
overboughtFillColor = showGradients ? color.new(neonPrimary, 0) : na
overboughtFillColorBottom = showGradients ? color.new(neonPrimary, 100) : na
oversoldFillColorTop = showGradients ? color.new(neonSecondary, 100) : na
oversoldFillColorBottom = showGradients ? color.new(neonSecondary, 0) : na
fill(rsiUpperBand, rsiLowerBand, color=backgroundFillColor, title="🌃 Cyber Background")
fill(rsiPlot, midLinePlot, 100, 70, top_color = overboughtFillColor, bottom_color = overboughtFillColorBottom, title = "🌌 Cyber Overbought Zone")
fill(rsiPlot, midLinePlot, 30, 0, top_color = oversoldFillColorTop, bottom_color = oversoldFillColorBottom, title = "🌌 Cyber Oversold Zone")
// ==================== SMOOTHING MA (CÓDIGO ORIGINAL) ====================
GRP = "🌊 Smoothing"
TT_BB = "Only applies when 'SMA + Bollinger Bands' is selected. Determines the distance between the SMA and the bands."
maTypeInput = input.string("SMA", "Type", options = , group = GRP, display = display.data_window)
maLengthInput = input.int(14, "Length", group = GRP, display = display.data_window)
bbMultInput = input.float(2.0, "BB StdDev", minval = 0.001, maxval = 50, step = 0.5, tooltip = TT_BB, group = GRP, display = display.data_window)
var enableMA = maTypeInput != "None"
var isBB = maTypeInput == "SMA + Bollinger Bands"
// Smoothing MA Calculation (CÓDIGO ORIGINAL)
ma(source, length, MAtype) =>
switch MAtype
"SMA" => ta.sma(source, length)
"SMA + Bollinger Bands" => ta.sma(source, length)
"EMA" => ta.ema(source, length)
"SMMA (RMA)" => ta.rma(source, length)
"WMA" => ta.wma(source, length)
"VWMA" => ta.vwma(source, length)
// Smoothing MA plots con colores cyber
smoothingMA = enableMA ? ma(rsi, maLengthInput, maTypeInput) : na
smoothingStDev = isBB ? ta.stdev(rsi, maLengthInput) * bbMultInput : na
plot(smoothingMA, "🌊 Cyber MA", color=color.new(color.yellow, 0), linewidth=2, display = enableMA ? display.all : display.none, editable = enableMA)
bbUpperBand = plot(smoothingMA + smoothingStDev, title = "🔺 Upper Cyber Band", color=neonPrimary, linewidth=2, display = isBB ? display.all : display.none, editable = isBB)
bbLowerBand = plot(smoothingMA - smoothingStDev, title = "🔻 Lower Cyber Band", color=neonSecondary, linewidth=2, display = isBB ? display.all : display.none, editable = isBB)
// Fill para Bollinger Bands
bbFillColor = isBB ? color.new(neonPrimary, 90) : na
fill(bbUpperBand, bbLowerBand, color=bbFillColor, title="🌌 Cyber Bollinger Fill", display = isBB ? display.all : display.none, editable = isBB)
// ==================== DIVERGENCE (CÓDIGO ORIGINAL CORREGIDO) ====================
lookbackRight = 5
lookbackLeft = 5
rangeUpper = 60
rangeLower = 5
bearColor = cyberRed
bullColor = cyberGreen
textColor = neonWhite
noneColor = color.new(color.white, 100)
// Función _inRange calculada en cada barra
_inRange(bool cond) =>
bars = ta.barssince(cond)
rangeLower <= bars and bars <= rangeUpper
plFound = false
phFound = false
bullCond = false
bearCond = false
rsiLBR = rsi
// Calcular _inRange en cada barra para evitar inconsistencias
plFoundPrev = not na(ta.pivotlow(rsi, lookbackLeft, lookbackRight) )
phFoundPrev = not na(ta.pivothigh(rsi, lookbackLeft, lookbackRight) )
inRangeBull = _inRange(plFoundPrev)
inRangeBear = _inRange(phFoundPrev)
if calculateDivergence
//------------------------------------------------------------------------------
// Regular Bullish
// rsi: Higher Low
plFound := not na(ta.pivotlow(rsi, lookbackLeft, lookbackRight))
rsiHL = rsiLBR > ta.valuewhen(plFound, rsiLBR, 1) and inRangeBull
// Price: Lower Low
lowLBR = low
priceLL = lowLBR < ta.valuewhen(plFound, lowLBR, 1)
bullCond := priceLL and rsiHL and plFound
//------------------------------------------------------------------------------
// Regular Bearish
// rsi: Lower High
phFound := not na(ta.pivothigh(rsi, lookbackLeft, lookbackRight))
rsiLH = rsiLBR < ta.valuewhen(phFound, rsiLBR, 1) and inRangeBear
// Price: Higher High
highLBR = high
priceHH = highLBR > ta.valuewhen(phFound, highLBR, 1)
bearCond := priceHH and rsiLH and phFound
// Divergence plots con estilo cyber
plot(
plFound ? rsiLBR : na,
offset = -lookbackRight,
title = "🚀 Cyber Bull Divergence",
linewidth = 3,
color = (bullCond ? bullColor : noneColor),
display = display.pane,
editable = calculateDivergence)
plotshape(
bullCond ? rsiLBR : na,
offset = -lookbackRight,
title = "🚀 Cyber Bull Signal",
text = "🚀 BULL",
style = shape.labelup,
location = location.absolute,
color = bullColor,
textcolor = textColor,
size = size.normal,
display = display.pane,
editable = calculateDivergence)
plot(
phFound ? rsiLBR : na,
offset = -lookbackRight,
title = "🔻 Cyber Bear Divergence",
linewidth = 3,
color = (bearCond ? bearColor : noneColor),
display = display.pane,
editable = calculateDivergence)
plotshape(
bearCond ? rsiLBR : na,
offset = -lookbackRight,
title = "🔻 Cyber Bear Signal",
text = "🔻 BEAR",
style = shape.labeldown,
location = location.absolute,
color = bearColor,
textcolor = textColor,
size = size.normal,
display = display.pane,
editable = calculateDivergence)
// ==================== TABLA DE INFORMACIÓN CYBER ====================
// Calcular ta.change en cada barra para consistencia
rsiChange3 = ta.change(rsi, 3)
if barstate.islast
var table infoTable = table.new(position.top_right, 2, 5,
bgcolor=color.new(darkCyber, 10),
border_width=2,
border_color=neonPrimary,
frame_width=3,
frame_color=neonSecondary)
table.clear(infoTable, 0, 0, 1, 4)
table.cell(infoTable, 0, 0, " ULTRA RSI", bgcolor=neonPrimary, text_color=neonWhite, text_size=size.small)
table.cell(infoTable, 1, 0, " INFO", bgcolor=neonSecondary, text_color=neonWhite, text_size=size.small)
table.cell(infoTable, 0, 1, " VALOR RSI", bgcolor=color.new(darkCyber, 30), text_color=neonPrimary, text_size=size.small)
table.cell(infoTable, 1, 1, str.tostring(math.round(rsi, 2)), bgcolor=color.new(darkCyber, 30), text_color=neonWhite, text_size=size.small)
rsiStatus = rsi >= 70 ? " SOBRENDIDO" : rsi <= 30 ? " SOBRECOMPRADO" : " NEUTRO"
statusColor = rsi >= 70 ? cyberRed : rsi <= 30 ? cyberGreen : neonWhite
table.cell(infoTable, 0, 2, " MOMENTO", bgcolor=color.new(darkCyber, 30), text_color=neonSecondary, text_size=size.small)
table.cell(infoTable, 1, 2, rsiStatus, bgcolor=color.new(darkCyber, 30), text_color=statusColor, text_size=size.small)
if enableMA
table.cell(infoTable, 0, 3, " EMA RSI", bgcolor=color.new(darkCyber, 30), text_color=neonPrimary, text_size=size.small)
table.cell(infoTable, 1, 3, str.tostring(math.round(smoothingMA, 2)), bgcolor=color.new(darkCyber, 30), text_color=neonWhite, text_size=size.small)
momentum = rsiChange3 > 0 ? " SUBINDO" : " CAINDO"
momentumColor = rsiChange3 > 0 ? cyberGreen : cyberRed
table.cell(infoTable, 0, 4, " TENDÊNCIA", bgcolor=color.new(darkCyber, 30), text_color=neonPrimary, text_size=size.small)
table.cell(infoTable, 1, 4, momentum, bgcolor=color.new(darkCyber, 30), text_color=momentumColor, text_size=size.small)
// ==================== ALERTS (CÓDIGO ORIGINAL) ====================
alertcondition(bullCond, title='🚀 Cyber Bullish Divergence', message="🎯 Found a new Cyber Bullish Divergence!")
alertcondition(bearCond, title='🔻 Cyber Bearish Divergence', message='🎯 Found a new Cyber Bearish Divergence!')
RSI LiveRSI 14 live on the candle. Turn Red when it’s on oversold or overbuy. Very simple and visual

Approximate Entropy Zones [PhenLabs]Version: PineScript™ v6
Description
This indicator identifies periods of market complexity and randomness by calculating the Approximate Entropy (ApEn) of price action. As the movement of the market becomes complex, it means the current trend is losing steam and a reversal or consolidation is likely near. The indicator plots high-entropy periods as zones on your chart, providing a graphical suggestion to anticipate a potential market direction change. This indicator is designed to help traders identify favorable times to get in or out of a trade by highlighting when the market is in a state of disarray.
Points of Innovation
Advanced Complexity Analysis: Instead of relying on traditional momentum or trend indicators, this tool uses Approximate Entropy to quantify the unpredictability of price movements.
Dynamic Zone Creation: It automatically plots zones on the chart during periods of high entropy, providing a clear and intuitive visual guide.
Customizable Sensitivity: Users can fine-tune the ‘Entropy Threshold’ to adjust how frequently zones appear, allowing for calibration to different assets and timeframes.
Time-Based Zone Expiration: Zones can be set to expire after a specific time, keeping the chart clean and relevant.
Built-in Zone Size Filter: Excludes zones that form on excessively large candles, filtering out noise from extreme volatility events.
On-Chart Calibration Guide: A persistent note on the chart provides simple instructions for adjusting the entropy threshold, making it easy for users to optimize the indicator’s performance.
Core Components
Approximate Entropy (ApEn) Calculation: The core of the indicator, which measures the complexity or randomness of the price data.
Zone Plotting: Creates visual boxes on the chart when the calculated ApEn value exceeds a user-defined threshold.
Dynamic Zone Management: Manages the lifecycle of the zones, from creation to expiration, ensuring the chart remains uncluttered.
Customizable Settings: A comprehensive set of inputs that allow users to control the indicator’s sensitivity, appearance, and time-based behavior.
Key Features
Identifies Potential Reversals: The high-entropy zones can signal that a trend is nearing its end, giving traders an early warning.
Works on Any Timeframe: The indicator can be applied to any chart timeframe, from minutes to days.
Customizable Appearance: Users can change the color and transparency of the zones to match their chart’s theme.
Informative Labels: Each zone can display the calculated entropy value and the direction of the candle on which it formed.
Visualization
Entropy Zones: Shaded boxes that appear on the chart, highlighting candles with high complexity.
Zone Labels: Text within each zone that displays the ApEn value and a directional arrow (e.g., “0.525 ↑”).
Calibration Note: A small table in the top-right corner of the chart with instructions for adjusting the indicator’s sensitivity.
Usage Guidelines
Entropy Analysis
Source: The price data used for the ApEn calculation. (Default: close)
Lookback Length: The number of bars used in the ApEn calculation. (Default: 20, Range: 10-50)
Embedding Dimension (m): The length of patterns to be compared; a standard value for financial data. (Default: 2)
Tolerance Multiplier (r): Adjusts the tolerance for pattern matching; a larger value makes matching more lenient. (Default: 0.2)
Entropy Threshold: The ApEn value that must be exceeded to plot a zone. Increase this if too many zones appear; decrease it if too few appear. (Default: 0.525)
Time Settings
Analysis Timeframe: How long a zone remains on the chart after it forms. (Default: 1D)
Custom Period (Bars): The zone’s lifespan in bars if “Analysis Timeframe” is set to “Custom”. (Default: 1000)
Zone Settings
Zone Fill Color: The color of the entropy zones. (Default: #21f38a with 80% transparency)
Maximum Zone Size %: Filters out zones on candles that are larger than this percentage of their low price. (Default: 0.5)
Display Options
Show Entropy Label: Toggles the visibility of the text label inside each zone. (Default: true)
Label Text Position: The horizontal alignment of the text label. (Default: Right)
Show Calibration Note: Toggles the visibility of the calibration note in the corner of the chart. (Default: true)
Best Use Cases
Trend Reversal Trading: Identifying when a strong trend is likely to reverse or pause.
Breakout Confirmation: Using the absence of high entropy to confirm the strength of a breakout.
Ranging Market Identification: Periods of high entropy can indicate that a market is transitioning into a sideways or choppy phase.
Limitations
Not a Standalone Signal: This indicator should be used in conjunction with other forms of analysis to confirm trading signals.
Lagging Nature: Like all indicators based on historical data, ApEn is a lagging measure and does not predict future price movements with certainty.
Calibration Required: The effectiveness of the indicator is highly dependent on the “Entropy Threshold” setting, which needs to be adjusted for different assets and timeframes.
What Makes This Unique
Quantifies Complexity: It provides a numerical measure of market complexity, offering a different perspective than traditional indicators.
Clear Visual Cues: The zones make it easy to see when the market is in a state of high unpredictability.
User-Friendly Design: With features like the on-chart calibration note, the indicator is designed to be easy to use and optimize.
How It Works
Calculate Standard Deviation: The indicator first calculates the standard deviation of the source price data over a specified lookback period.
Calculate Phi: It then calculates a value called “phi” for two different pattern lengths (embedding dimensions ‘m’ and ‘m+1’). This involves comparing sequences of data points to see how many are “similar” within a certain tolerance (determined by the standard deviation and the ‘r’ multiplier).
Calculate ApEn: The Approximate Entropy is the difference between the two phi values. A higher ApEn value indicates greater irregularity and unpredictability in the data.
Plot Zones: If the calculated ApEn exceeds the user-defined ‘Entropy Threshold’, a zone is plotted on the chart.
Note: The “Entropy Threshold” is the most important setting to adjust. If you see too many zones, increase the threshold. If you see too few, decrease it.

55-Day Breakout w/ Exit Signals (No Duplicate Signals)turtle trader 55-day breakout with entry and exit signals. Updated to remove duplicate signals

BWTS Return ZonesThis indicator automatically shows the points where the price can turn (support and resistance) and provides additional confirmation for traders. It is designed for 4-hour and 1-day charts, but can also be operated on lower timeframes. It is suitable for spot trading or futures trading.

Chaikin Bull-Power OscillatorThis indicator is given with much love and care to the community to help you in your trading operations.
How to use the "Chaikin-Bull-PW" Indicator
The Chaikin-Bull-PW is an oscillator based on the Accumulation/Distribution (AD) line smoothed by different methods, called here the "Hull Chaikin Oscillator." It compares two smoothed averages of the AD line — a short period and a long period — to indicate the strength and direction of buying and selling pressure in the market.
Adjustable Parameters:
Short Period: Number of bars used to calculate the short smoothed average of the AD line. Shorter periods make the indicator more sensitive.
Long Period: Number of bars used to calculate the long smoothed average of the AD line. Longer periods smooth the indicator more.
Background Offset: Controls the offset of the chart’s background color.
Smoothing Type: Choose the smoothing method for the AD line among HMA, SMA, SMMA, EMA, WMA, and JMA. This affects how the averages are calculated and how the oscillator responds to price.
Indicator Interpretation:
The oscillator is the difference between the short and long smoothed averages of the AD line.
When the oscillator is above zero (green), it indicates increasing buying pressure, suggesting an uptrend.
When the oscillator is below zero (red), it indicates increasing selling pressure, suggesting a downtrend.
The zero line acts as a reference for trend changes.
Usage Suggestions:
Use the oscillator crossing the zero line to identify potential entry or exit points.
Combine with other indicators or chart analysis to confirm signals.
Adjust the periods and smoothing type to fit your asset and timeframe.
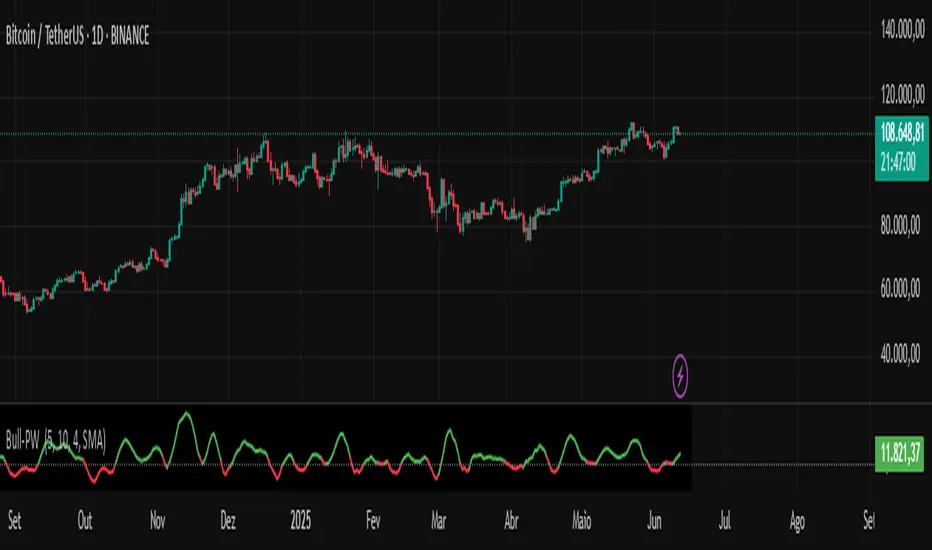
Moving Averages with ADR%/ATR/52W/Market Cap TableThis one indicator covers all major aspects for a trader like moving averages (which you can choose as per the time frame), Average Dynamic Range (it should be above 5% on a 20 day period), CMP position from 52 Weeks High / Low and Market Capitalization of the company.
