Smoothed CMF-ROC Trend (Auto TF Adjust)This Trend is adjusted for multi time frame. It measure CMF and its rate of change. Changes colors if crosses the zero line
Göstergeler ve stratejiler

RFM Strategy - High QualityI trade high-probability resistance fades using a systematic 4-pillar approach that has delivered a proven 60%+ win rate with 2.5+ profit factor."
📊 Core Strategy Elements:
1. VRF Resistance Identification:
Multiple resistance level confluence (minimum 2 levels)
Dynamic resistance zones using 20-period high/low ranges
Only trade when price approaches clustered resistance
2. Volume Weakness Confirmation:
Volume ROC must be ≤ -30% (weak buying pressure)
Identifies exhaustion rallies with poor participation
Confirms institutional selling vs retail buying
3. Momentum Divergence:
SMI ≥ 60 (extreme overbought) OR 25-point momentum collapse
Multi-timeframe confirmation for higher reliability
Catches momentum exhaustion at key levels
4. Price Rejection Patterns:
Long upper wicks (2x body size) at resistance
Doji formations showing indecision
Failed breakout patterns with immediate rejection
⚡ Execution:
Entry: Only when ALL 4 conditions align simultaneously
Risk Management: 6-point stops, 12-point targets (2:1 R/R minimum)
Timeframe: 5-minute charts for precise entries
Selectivity: Quality over quantity - average 5 trades per period
🏆 Performance:
60% win rate (matches manual trading performance)
2.59 Profit Factor (highly profitable)
Systematic approach eliminates emotional decisions
"This strategy automates the discretionary resistance fade setups that institutional traders use, with strict filters ensuring only the highest-probability opportunities."

Multi-Timeframe Horizontal LinesThis Pine Script indicator plots horizontal lines at the high and low prices of the most recent 1-hour and 15-minute candles. Users can customize the color and width of the lines for each timeframe. The lines are updated dynamically, with previous lines removed to keep the chart clean.

Advanced Day Separator with Future ProjectionsThe general indicator works on historical data, meaning they develop after the fact. The same is for indicators that show day separation. I was always forced to manually draw in vertical lines for the upcoming week. This indicator I built solves that issue by projecting vertical day separations for the upcoming week. Enjoy! :-)

Volatility Strategy 01a quantitative volatility strategy (especially effective in trend direction on the 15min chart on the s&p-index)
the strategy is a rule-based setup, which dynamically adapts to the implied volatility structure (vx1!–vx2!)
context-dependent mean reversion strategy based on multiple timeframes in the vix index
a signal is provided under following conditions:
1. the vvix/vix spread has deviated significantly beyond one standard deviation
2. the vix is positioned above or below 3 moving averages on 3 minor timeframes
3. the trade direction is derived from the projected volatility regime, measured via vx1! and vx2! (cboe)

Price Density Strategy ScoreBased on the rules we defined, a composite score (-3 to +3) is calculated and displayed as colored bars below the chart:
Dark green (+3): Strong buy signal
Light green (+1, +2): Mildly bullish
Gray (0): Neutral
Light red (-1, -2): Mildly bearish
Dark red (-3): Strong sell signal
根据我们定义的规则,计算一个综合分数(-3 到 +3),并在图表下方用不同颜色的柱状图显示出来:
深绿色 (+3):强力买入信号
浅绿色 (+1, +2):温和看涨
灰色 (0):中性
浅红色 (-1, -2):温和看跌
深红色 (-3):强力卖出信号

Steez's Timeframe TableSimple timeframe indicator which can assist with daily bias or draw on liquidity.
Shows all timeframes from 1 minute to 1 day.
Shows close time and if the candle is currently bearish or bullish.

Next Day Key Levels [Auto-Pivot Suite] RobustNext Day Key Levels
Automatically plot key levels (Floor Pivots) for the next U.S. trading day, with smart session detection.
What does this script do?
Automatically detects the most recent completed U.S. regular trading session (9:30 AM–4:00 PM Eastern) and plots all classic Floor Pivot levels for the next trading day.
Handles Mondays and holidays: Always uses the most recent session’s data, so Friday’s values are shown on Monday, and holidays are skipped seamlessly.
Works in both pre-market and after-hours—levels appear for the next session at the right time.
Levels plotted:
Previous Session High (H)
Previous Session Low (L)
Previous Session Close (C)
Pivot (P)
Resistance 1, 2, 3 (R1, R2, R3)
Support 1, 2, 3 (S1, S2, S3)
How it works
Monitors each bar and tracks session highs/lows/close only during regular market hours.
At the close of each session (4:00 PM ET), saves these values.
In pre-market (before 9:30 AM ET) and after-hours (after 4:00 PM ET), automatically plots levels based on the last completed session—always the correct session, even on Mondays and after holidays.
Why is it better?
No clutter: Only one set of levels per day, drawn cleanly.
Accurate pivots for every next U.S. session.
Zero manual setup: Add to any U.S. ticker, on any intraday timeframe.
Features
Works across all U.S. stocks and ETFs.
Plots and labels all levels with color coding for quick reference.
Designed for intraday and short-term trading strategies.
Handles time zone and market session edge cases automatically.
How to use
Add the indicator to any U.S. equity or ETF chart (15m–1h timeframes recommended).
Levels will appear automatically in pre-market or after the market closes, always for the next session.
Trade with confidence using automatic, accurate pivots and support/resistance levels.
Developed by .
For questions or feedback, leave a comment below!

TRAPPER Volume Trigger + SMAs + Buy/Sell SplitThe TRAPPER TRIGGER is a precision-based volume spike indicator designed for intraday traders, scalpers, and swing traders who rely on key volume activity to anticipate sharp market movements. It operates on volume delta logic, detecting disproportionate buying or selling activity that signifies potential market reversals or breakouts.
How It Works:
Volume Spike Logic (Delta-Based)
The script calculates a dynamic volume threshold using a moving average of historical volume data.
It identifies a delta spike by comparing current volume against this threshold—when volume exceeds it significantly, it suggests abnormal activity.
If the candle closes higher than it opens (bullish), the script registers it as a Buy Spike ⚖️.
If the candle closes lower than it opens (bearish), it marks a Sell Spike 🏁.
These are not based on the candle’s body size but the volume differential (delta) between buy/sell pressure inferred from candle direction.
Trigger Labels
Only the most recent buy/sell spike is labeled for clarity, avoiding clutter.
Labels are color-coded to match the candle body (e.g., bright green for bullish, magenta for bearish).
Label style: ⚖️ for Buy Spikes, 🏁 for Sell Spikes.
SMA Suite (Fully Customizable):
Six SMAs: 5 (yellow), 10 (blue), 20 (green), 50 (orange), 100 (red), 200 (white).
Each can be toggled and customized in the script settings for visibility and styling.
Key Benefits
Clean, minimalistic charting — focuses only on high-probability events.
Provides delta-driven insights without requiring access to full L2 order book data.
Works across any timeframe — logic recalculates and resets zones per timeframe switch.
Designed for sniper-style entries—ideal for traders who prefer minimal noise and maximum signal clarity.
Easily extendable with SR zones, AVWAP, liquidity levels, or alerts if desired in future updates.
Who It’s For
Scalpers and intraday traders looking for clean triggers.
Swing traders wanting confirmation of institutional moves.
Volume profile enthusiasts who need a trigger alert system.
Developers who want a base volume framework to build more advanced tools on.
Disclaimer
This script is provided as-is and is intended for educational and informational purposes only. It does not constitute financial advice, investment recommendations, or a solicitation to buy or sell any security or asset.
All trading involves risk. Users should perform their own due diligence and consult with a qualified financial advisor before making any trading decisions. The author of this script assumes no liability for any losses or damages arising from the use or reliance on this tool.
By using this script, you acknowledge and agree that you are solely responsible for your own trading decisions and outcomes.

Squeeze Breakout Pro🔥 What This Script Does
This is a Breakout Strength Scanner with Squeeze + Pattern Range + Volume Confirmation + Risk Management + Take Profits.
✅ Core Functions:
Squeeze Detector:
Finds low volatility zones using Bollinger Band width compression.
Marks them with a “Squeeze” label — this signals that a big move is likely coming soon.
Pattern Range Detection:
Automatically identifies recent pivot highs (resistance) and pivot lows (support) using the pivotLen.
Draws the current consolidation range visually with horizontal lines.
Breakout Confirmation:
Requires:
✅ A break above resistance or below support.
✅ Confirmed with above-average volume.
✅ Must occur while in a volatility squeeze.
Plots arrows:
🔼 Green Up Arrow = Confirmed Bullish Breakout.
🔽 Red Down Arrow = Confirmed Bearish Breakout.
Trade Management Built-In:
Stop Loss: Just beyond the opposite side of the pattern range.
Take Profits:
✅ TP1 = 1.5x risk.
✅ TP2 = 2x risk.
Position Size Calculator:
Based on your input account size (accountBal) and risk percentage (riskPct).
Shows how many contracts, shares, or units to buy/sell to risk exactly that % of your account.
Higher Timeframe Trend Filter:
Default is 4-hour trend filter (can be changed).
✅ Only shows if the higher timeframe trend is Bullish (EMA50 > EMA200) or Bearish.
Displayed on the dashboard.
📊 How to Use It Step-By-Step
🟧 1. Look for a Squeeze:
A “Squeeze” label will appear.
This means price is coiled tight — a breakout is likely.
🟩 2. Wait for a Breakout Arrow:
🔼 Green Arrow: Bullish breakout (price breaks resistance + volume confirms + squeeze active).
🔽 Red Arrow: Bearish breakout (price breaks support + volume confirms + squeeze active).
🟥 3. Check the Dashboard:
✅ Trend Bias: Should ideally match your breakout.
If the higher timeframe is Bullish, long breakouts have better odds.
If Bearish, short breakouts are higher probability.
✅ Vol Confirm: Will say “Yes” if the volume condition is met.
🏹 4. Manage the Trade (Auto Levels):
The script draws:
🔴 Stop Loss Line (below range for longs, above for shorts).
🟢 Take Profit 1 (1.5x risk).
🟢 Take Profit 2 (2x risk).
Use these as guidelines for exits.
💰 5. Use Position Size Display:
Check the TP and SL distances and the suggested position size based on your account balance and risk percentage.
🚀 Pro Tips for Maximum Success
✅ Use Trend Confluence:
Only trade long breakouts when the higher timeframe trend is Bullish (EMA50 > EMA200).
Only trade short breakouts when the higher timeframe trend is Bearish.
✅ Avoid Fakeouts:
If a breakout arrow forms but the candle closes far away from the pattern breakout — wait for a retest or confirmation.
Higher volume + clean breakout works better than low-volume squeezes.
✅ Best Timeframes:
4H to Daily: For swing trades.
15m to 1H: For intraday trades (adjust htf to "240" for 4H trend confirmation even on lower charts).
✅ Increase Win Rate:
Use this script with key support/resistance zones, weekly ranges, or fib retracements.
Breakouts that happen near macro key levels have the highest follow-through.
✅ Set Alerts:
Right-click the breakout arrow or use alertcondition() events in the script.
Set alerts for:
📈 Breakout UP
📉 Breakout DOWN
🏹 Squeeze Active (prep for breakout)
✅ Walk Away Once In:
Let TP1 or TP2 hit.
Or move stop to breakeven after TP1 hits for free runners.
🔥 What Makes This Script Powerful:
Combines price action (pattern range) + volatility squeeze + volume confirmation + trend bias + risk management.
Most traders use these individually. This does it all in one clean tool.
💎 Professional Edge:
This is the type of script that turns reactive trading into systematic trading. No guessing. Clean rules. Repeatable.

Opening Candle Indicator V4
Details of this release:
1. Add an alert with two conditions:
- Price breaks the highest candlestick opening and closing above it.
- Price breaks the VWAP indicator value.
2. Integrate the VWAP indicator and the 200 EMA with the main indicator.
3. Display buy and sell signals based on specific conditions related to the VWAP breakout.
4. Increase target lines to five.
5. Most importantly, I added custom windows in the settings to apply the indicator to other markets based on adding the opening and closing times for any market with a daily opening and closing time.
Important note: The second buy signal, which comes after a sell signal appears, is based on two conditions: a close above the high of the previous sell signal and a close above VWAP
Warning - Buy or sell signals are only warning signals and the user is responsible for evaluating and studying this signal.
**Fixed some errors in the previous script
تفاصيل هذا الإصدار:
1-أضفت تنبيه يحتوي على شرطين
-إختراق السعر الأعلى لشمعة الإفتتاح والإغلاق فوقها.
-إختراق السعر لقيمة مؤشر vwap.
2-دمج مؤشر vwap والمتوسط الأسي 200 مع المؤشرالرئيسي
3- إظهار إشارات الشراء والبيع بشروط معينة مرتبطة بإختراق vwap
4-زيادة خطوط الأهداف إلى خمس.
5- وهي الأهم أضفت نوافذ مخصصة في الاعدادت لتطبيق المؤشر على الأسواق الأخرى بناء على إضافة وقت الإفتتاح والإغلاق لأي سوق له وقت إفتتاح ووقت إغلاق يومي.
ملاحظة مهمة:إشارة الشراء الثانية والتي تأتي بعد ظهور إشارة بيع وضعت بناء على شرطين وهما الاغلاق فوق الاعلى لإشارة البيع السابقة والاغلاق فوق مؤشر VWAP
تحذير-إشارات الشراء أو البيع ليست إلا إشارات تحذيرية والمستخدم هو المسئول عن تقييم ودراسة هذه الإشارة
**اصلاح بعض الاخطاء في السكربت الماضي

SNIPERKILLS-IB-HIGH-LOW+Exp-Move[D/W/M]Script Feature Checklist (Updated):
Initial Balance (IB) Calculation
Tracks IB High and IB Low during a user-defined session (default 9:30–10:30)
Plots IB High (blue), IB Low (red), and IB Midpoint (orange)
Expected Movement (EM) Calculation Using VIX
Calculates expected price move range based on VIX volatility index and previous close
Plots EM upper (EM+) and lower (EM-) levels (purple lines)
Optional rounding of levels to nearest multiple (spread input)
Displays two deviation levels (% deviations from EM):
First deviation (default 68%, orange dashed lines)
Second deviation (default 90%, blue dashed lines)
Labels for EM levels and deviations on chart
Summary table with Period, EM, VIX, Previous Close
Measured Move Targets Based on IB Range
Defines 3 long targets above IB High (multiples 1x, 2x, 3x)
Defines 3 short targets below IB Low (multiples 1x, 2x, 3x)
Plots these targets in green (long) and red (short)
Liquidity Sweeps Detection
Detects when price breaks/sweeps below IB Low or above IB High (liquidity grab)
Plots triangle shapes on bars showing IB Low Sweep (red) or IB High Sweep (blue)
Market Structure Shift (MSS) Detection
Detects bearish MSS (higher high + close lower) above IB High
Detects bullish MSS (lower low + close higher) below IB Low
Marks MSS signals with crosses: orange (bearish), green (bullish)
Trade Entry Markers Based on MSS
Short entry trigger if bearish MSS confirmed and close below previous low
Long entry trigger if bullish MSS confirmed and close above previous high
Plots labeled arrows: "AMD SHORT" (black label down), "AMD LONG" (lime label up)
Fair Value Gap (FVG) Detection
Detects potential Fair Value Gaps up and down
Plots small squares: green below bars (FVG Up), red above bars (FVG Down)
Simple Risk/Reward Levels
Defines take profit (TP) and stop loss (SL) levels for short and long entries based on fixed pip multiples
Plots TP and SL with colored circles on the chart
Alerts for Key Events
Alerts for IB Low Sweep and IB High Sweep
Alerts for MSS Bearish and MSS Bullish
Alerts for Short and Long entries
Order Block (OB) / CISD Candle Highlight
Detects large bearish displacement candle following bullish candle (CISD)
Highlights the previous candle (order block candle) in purple
Allows traders to anticipate potential reversals by visually identifying these order blocks

CMF Tilson Scalper (1m Optimized)This indicator tracks CMF based on Tilson MA with buy zone above zero and Sell zone below zero

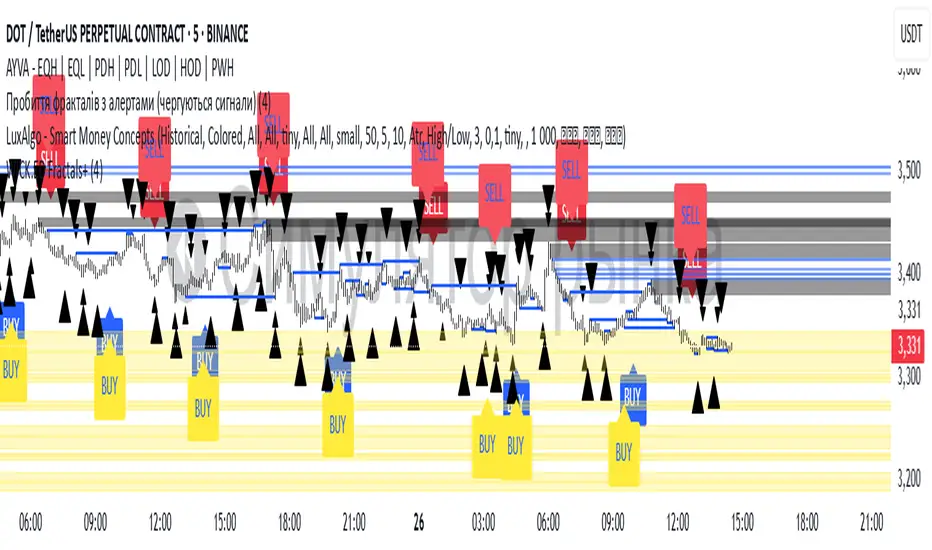
Williams Fractals with Buy/Sell Signals🧠 Concept:
This indicator is based on the concept of fractal swing highs and lows, commonly used in Bill Williams’ trading methods. A fractal forms when a candle’s high or low is higher/lower than a set number of candles on both sides. This structure helps identify local market turning points.
⚙️ Inputs:
Fractal Sensitivity (swingSensitivity):
Number of candles required on each side of the central bar to validate a fractal.
For example, if set to 2, a swing high is detected when a bar’s high is higher than the previous 2 bars and the next 2 bars.
✅ Features:
Fractal Detection:
Plots white triangles above swing highs (down fractals).
Plots white triangles below swing lows (up fractals).
Buy/Sell Signals:
Buy Signal: Triggered when the candle closes above the most recent down fractal.
Sell Signal: Triggered when the candle closes below the most recent up fractal.
Signals alternate — a Buy must follow a Sell and vice versa to reduce noise.
Signal Labels:
"BUY" label appears below the candle in green.
"SELL" label appears above the candle in red.
Alerts:
Real-time alerts are available for both Buy and Sell signals via alertcondition().
📌 Use Case:
This indicator can help you:
Detect short-term reversals.
Confirm breakouts or structure shifts.
Time entries with clear logic based on price action.
V8 On-Chart Signals + CrossEMA Distance
8/21 Cross
B/S for initial change in signal
b/s yellow for price action second confirm.
x shows 8/21 trend break

Relative Strength IndexRelative Strength Index (mikolajan)
This is a modified built-in Relative Strength Index (RSI) indicator with two lines added to it to add an internal range.

📈 Linearity (ER 0–1) + ADRMAX % Table
This indicator combines two powerful concepts to help traders assess trend efficiency and intraday thrust strength:
🔹 1. Linearity (Kaufman Efficiency Ratio)
Measures how efficiently price has trended over a selected lookback period.
Values range from 0 to 1, where:
1.0 = perfectly trending market (no noise)
0.0 = completely choppy market (all noise)
Optional method: New High Persistence (fraction of bars in the period that hit a new high).
🔹 2. ADRMAX % (Average Daily Range Max as %)
Calculates the average of top % biggest green daily candles (measured as % range: (high - low) / low × 100) over a given lookback.
Projects this ADRMAX % above current lows as a thrust-level expectation.
Marks candles exceeding this dynamic threshold, helping identify unusual momentum.
📊 On-Chart Table Display
Real-time display of:
Linearity (0–1 scale)
ADRMAX %
Table is color-coded and position-customizable.
🛠️ Use Cases:
Trend-following filters: only act when ER > 0.75.
Thrust detection: breakout days with range > ADRMAX.
Adaptive entries: combine both for better timing.


Metaplanet MSW Strike LevelsMetaplanet Moving Strike Warrant (MSW) Price Tracker
This indicator displays Metaplanet's actual Moving Strike Warrant pricing schedule with real-time strike price visualization. It shows the exact strike prices that determine warrant exercise values based on Metaplanet's official MSW terms.
Key Features:
Current Period: Strike locked at ¥1,649 from June 24th through July 1st, 2025
Automatic Updates: Starting July 2nd, strike prices re-evaluate every 3 trading days using 3-day SMA of closing prices
Visual Strike Lines: Yellow horizontal lines show active MSW strike prices for each period
Background Signals: Light green when price is above strike (favorable), light red when below
Information Panel: Orange table displays current strike price and next evaluation date
Evaluation Markers: Orange/yellow dots mark re-evaluation dates
How It Works:
The indicator follows Metaplanet's official MSW schedule, automatically calculating new strike prices every 3 trading days based on the 3-day simple moving average of previous closing prices. This helps warrant holders track exercise opportunities and understand the dynamic pricing mechanism.

📈 DhanOne3 | RSI Colored Bars📈 DhanOne3 | RSI Colored Bars
This indicator visually highlights price bars based on RSI conditions. Green bars indicate overbought levels (RSI > 70), and red bars indicate oversold levels (RSI < 30). It helps traders quickly spot momentum shifts and potential reversal zones directly on the chart without opening a separate RSI panel.

ORB NormanORB with adjustable times for up to 3 ORB's.
High and Low for each defined timeframe with adjustable lenghts for each day.

FS JIMENEZ)FS JIMENEZ is a tactical breakout-retest strategy optimized for volatile price action and disciplined entries. It features:
• Swing structure validation
• Smart cooldown and price spacing logic
• SL compression after 3 bars
• Dynamic TP targeting based on candle strength and ATR
• Optional trailing SL via buffer multiplier
Built for traders seeking precision and controlled exposure across volati

EMA/ATR/RSIThis indicator overlays three key technical measures—Exponential Moving Average (EMA), Average True Range (ATR), and a custom-scaled Relative Strength Index (RSI)—on your price chart, all using the same lookback period.
Features
• EMA (Exponential Moving Average): Smooths price action to highlight trend direction.
• ATR (Average True Range): Measures market volatility via an RMA-smoothed True Range.
• RSI (Modified): Scales the standard RSI by subtracting 35 and multiplying by 2, shifting the baseline for clearer momentum signals.
Inputs
• period (integer): Lookback length for EMA, ATR, and RSI calculations (default: 14).
How to Use
1. Adjust period to suit your preferred timeframe (e.g., 14 for daily charts, 7 for intraday).
2. Use the EMA line to identify trend direction and dynamic support/resistance.
3. Monitor ATR to gauge changing volatility—wider bands signal stronger moves.
4. Watch the modified RSI crossovers around zero:
• Above 0: Bullish momentum
• Below 0: Bearish momentum
Combine these three overlays to refine entries, exits, and stop-loss placement based on trend strength, volatility, and momentum all in one view.
