FNGAdataOpenOpen prices for FNGA ETF (Dec 2018–May 2025)
The FNGA ETF (originally launched under the FNGU ticker before being renamed in March 2025) tracked the MicroSectors FANG+™ Index with 3x daily leverage and was designed to give traders magnified exposure to a concentrated basket of large-cap technology and tech-enabled companies. The fund’s price history contains multiple phases due to ticker changes, corporate actions, and its eventual redemption in mid-2025.
When looking specifically at Open prices from December 2018 through May 2025, this dataset provides the daily opening values for FNGA across its entire lifecycle. The opening price is the first traded price at the start of each regular U.S. market session (9:30 a.m. Eastern Time). It is an important measure for traders and analysts because it reflects overnight sentiment, pre-market positioning, and often sets the tone for intraday volatility.
Göstergeler ve stratejiler

OC Mean +/- Std Dev (last N bars) - v6tells you the value of the current close-open value to the past n bars. helpful to determine if current bar is more than 1 std dev off the average close-open


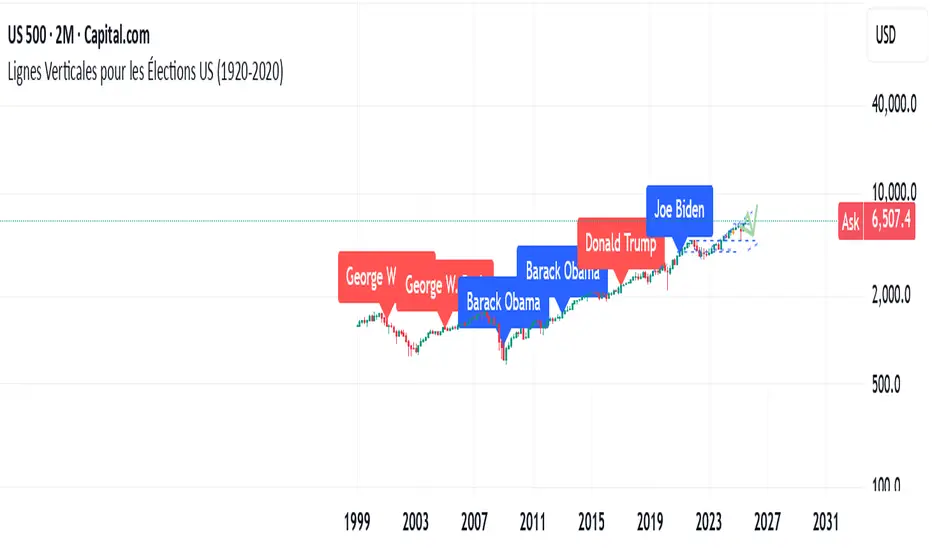
US Elections Democrate-Republicain (1920-2025)This script shows the different U.S. presidents and indicates whether each was Democratic or Republican. It allows users to analyze the market based on the president in office.
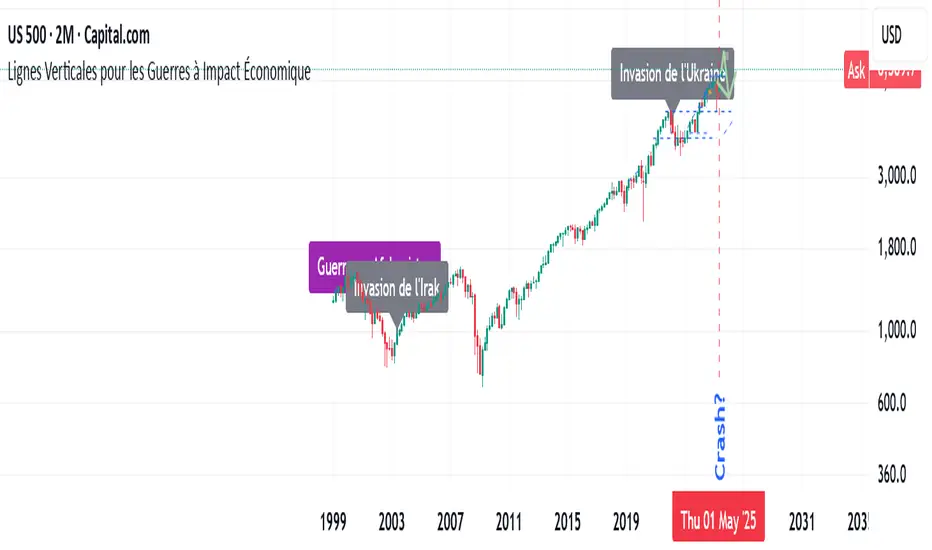
Major Wars with a signifiant economic impactThis indicator highlights major wars that have had a significant economic impact worldwide. It allows users to easily see their effects on the charts.
buy sell ultra systemWhat it is
EMA-POC Momentum System Ultra combines a proven trend stack (EMA 20/50/238), a price-of-control layer (POC via Bar-POC or VWAP alternative), and a momentum trigger (RSI) to surface higher-quality entries only when multiple, independent conditions align. This is not a cosmetic mashup; each component gates the others.
How components work together
Trend (EMA 20/50/238): Defines short/medium/long bias and filters counter-trend signals.
POC (Bar-POC or Alt-POC/VWAP): Locates the most-traded/weighted price area; a neutral band around POC helps avoid chop.
Control background: Above POC → buyers likely in control; below → sellers.
Momentum (RSI): Entry arrows print only when RSI confirms with trend and price location vs POC; optional “cross 50” requirement reduces noise.
Optional HTF trend: Confluence with a higher-timeframe EMA stack for stricter filtering.
Why it’s original/useful
Signals require confluence of (1) EMA trend stack, (2) POC location and neutral-zone filtering, (3) momentum confirmation, (4) optional slope and distance-to-POC checks, and (5) optional HTF trend. This reduces false positives compared with using any layer in isolation.
How to use
Markets/TFs: Built for XAUUSD (Gold) and US30. Works 1m–1h for intraday; 2h–4h for swing.
Entries:
Long: EMA stack bullish, price above POC, not in neutral band, RSI condition true → “Buy” arrow.
Short: Opposite conditions → “Sell” arrow.
Stops/Targets (suggested):
Initial stop beyond POC/neutral band or recent swing.
First target around 1R; trail with EMA20/50 or structure breaks.
Settings to tune:
POC Mode: Bar-POC (highest-volume bar’s close over lookback) or Alt-POC (VWAP).
Neutral Band %: 0.10–0.35 typical intraday.
Min distance from POC: 0.10–0.50% helps avoid low-RR entries right at POC.
RSI: Choose “cross 50” for stricter triggers or simple >/< 50 for more signals.
HTF trend: Turn on for extra confluence.
Alerts:
Buy Signal and Sell Signal (separate), or one Combined Buy/Sell alert.
Set to “Once per bar close” if you want only confirmed arrows.
Repainting / limitations
Shapes can move until bar close (standard Pine behavior) when using intrabar conditions; final confirmation at close. No system guarantees profitability—forward test and adapt to your market/instrument.
Clean chart
The published chart contains only this script so outputs are easy to identify.
Versions / updates
Use Publish → Update for minor changes; do not create new publications for small tweaks. If you fork to preserve older behavior, explain why and how your fork differs.
Changelog
v1.1 – Tuning for Gold/US30, neutral-band & distance filters, optional HTF trend, combined alert.
v1.0 – Initial public release (EMA stack + POC modes + RSI + alerts).
License & credits
Open-source for learning and improvement. Please credit on forks and explain modifications in your description.

EMA 24/50/70/99 聚合指标(raysun)Key Features
Multiple EMAs in One Script: Displays EMA 24, EMA 50, EMA 70, and EMA 99 simultaneously.
Customizable Visibility: You can turn each EMA line on or off in the indicator settings.
Color-Coded Lines: Each EMA is assigned a unique color (orange, blue, green, red) for easier visual distinction.
Overlay on Price Chart: Plots directly on the candlestick chart to help identify market trends and momentum shifts.
Usage
Trend Identification:
Shorter EMAs (like EMA 24) are more sensitive to price action, while longer EMAs (like EMA 99) represent broader trends.
Crossovers:
Watching how EMAs cross each other can help spot potential bullish or bearish signals. For example:
EMA 24 crossing above EMA 50/70/99 may suggest an uptrend.
EMA 24 crossing below EMA 50/70/99 may indicate a downtrend.
Support and Resistance:
EMAs often act as dynamic support and resistance levels, especially in trending markets.
Ideal For
Traders who prefer using EMA clusters for decision-making.
Swing traders and intraday traders who monitor multiple timeframes.
Anyone wanting a cleaner setup without cluttering the chart with multiple separate EMA indicators.

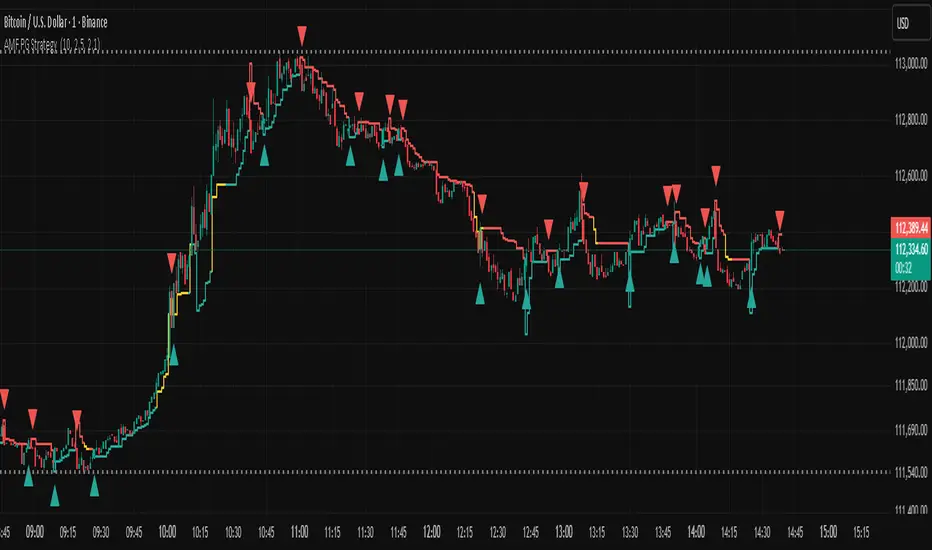
AMF PG Strategy AMF Command Center Strategy (Praetorian Guard)
The AMF PG Strategy (Praetorian Guard) is an advanced trading system built to adapt seamlessly across market conditions. Its unique structure balances precision entries with intelligent protection, giving traders confidence in both trending and volatile environments.
Key highlights include:
Adaptive Core (AMF Engine) – A dynamic framework that automatically adjusts and generates a powerful tracking line for clearer long and short opportunities.
Praetorian Guard – A built-in protective shield that activates in extreme conditions, helping stabilize performance when markets become turbulent.
Versatility – Effective across multiple timeframes, from scalping to swing trading, without constant parameter adjustments.
Clarity – Clean visual signals and color-coded tracking for instant decision-making.
This strategy was designed for traders who want more than just entries and exits — it offers a command center for disciplined, adaptive, and resilient trading.
Pivot and Wick Boxes with Break Signals v2█ OVERVIEW
The "Pivot and Wick Boxes with Break Signals v2" is an advanced Pine Script® technical analysis tool that identifies pivot points (highs and lows) on the chart and draws customizable boxes based on the wicks of pivot candles. It is ideal for traders using price action strategies, helping to identify key support and resistance levels and potential breakout trading opportunities. With flexible settings, a volume filter, and label grouping, the indicator ensures clarity and precision on the chart.
█ CONCEPTS
The indicator modifies how zones are drawn, displaying boxes on the latest candle rather than extending from the zones based on pivot candle wicks. This approach prevents visual clutter on the chart, allowing simultaneous use of other indicators without sacrificing clarity.
Why are wicks important?Wicks of pivot candles indicate significant market reactions in key areas. Depending on the context, they may signal rejection, testing, or absorption of support or resistance levels. Long wicks often appear where large players are active, and the marked zones are frequently retested. The indicator enables quick identification and observation of their impact on future price movements.
█ FEATURES
Pivot Detection: Identifies pivot points (highs and lows) based on a user-defined lookback period (Pivot Length), with options to display boxes for high and low pivot candle wicks separately.
Customizable Boxes: Draws boxes based on pivot candle wicks with adjustable border colors, background gradients, border styles (solid, dashed, dotted), and border widths.
Breakout Signals: Generates buy (green upward triangle) and sell (red downward triangle) signals when the price breaks through a pivot and the candle closes on the opposite side, indicating potential trend continuation. If the price approaches a pivot zone but fails to break it, this may suggest a potential trend reversal or the end of a correction.
Volume Filter: Optional volume-based signal filter that requires breakouts to have a volume exceeding a user-defined multiplier of the average volume over a specified period. Note: the volume filter will not work on markets where volume data is unavailable.
Label Grouping: Automatically groups overlapping pivot labels to avoid chart clutter, displaying only key price levels.
█ HOW TO USE
Add to Chart: Apply the indicator to your TradingView chart via the Pine Editor or Indicators menu.
Configure Settings:
Pivot Settings: Adjust Pivot Length to change the sensitivity of pivot detection—the value represents the number of candles, which equals the delay in displaying the pivot. Larger values generate fewer pivots, but they are generally more significant. Set Max High Pivot Boxes and Max Low Pivot Boxes to control the number of displayed boxes.
Signal Settings: Enable Use Volume Filter for Signals to require higher volume for breakouts, and adjust Average Volume Multiplier and Average Volume Period. A volume multiplier of 1 means the filter allows pivots with a volume equal to or greater than the average volume over the specified period.
Box Styling: Configure border colors, background gradients, line thickness, and border styles for high and low pivot boxes.
Interpreting Signals:
Buy Signal: A green triangle below the bar indicates a breakout above a high pivot box, suggesting potential continuation of an uptrend.
Sell Signal: A red triangle above the bar indicates a breakout below a low pivot box, suggesting potential continuation of a downtrend.
Non-Breakout Zones: If the price approaches a pivot zone but fails to break it, it may indicate a potential trend reversal or the end of a correction (e.g., price rejection at a resistance level in a downtrend or a support level in an uptrend).
Overlapping Zones: If pivot zones overlap, it indicates the level has been tested multiple times, suggesting its significance in the market.
Use signals in conjunction with other technical analysis tools for confirmation.
Monitoring Levels: Use labeled pivot levels as potential support and resistance zones for trade planning.
█ APPLICATIONS
Price Action Trading: Use pivot levels as support and resistance zones. For example, in an uptrend, you can look for buying opportunities near low pivot zones (support), where price often bounces after testing the wick of a pivot candle. Combining with other indicators, such as Fibonacci levels, enhances the significance of pivot zones—if they align with Fibonacci levels and are accompanied by high volume, the zone is considered stronger.
Breakout Strategies: Trade based on breakout signals from key pivot zones. A buy signal after a breakout from a high pivot with confirmed volume may indicate continued upward movement. Using the indicator with other tools, such as moving averages or RSI, can help confirm the strength of the breakout.
Practical Approach:
The more frequently a zone is tested in a short period, the higher the risk of a breakout, as supply or demand may be exhausted.
The longer a zone holds without breaking, the more significant it becomes for the market, both psychologically and technically.
As the saying goes: “A zone is strong until it breaks—when it does, a strong move often follows.”
How to observe?
Strong bounces from a zone indicate that demand or supply remains active.
Weaker bounces or price lingering near the level may suggest the market is preparing for a breakout.
█ NOTES
Test the indicator across different timeframes and markets (stocks, forex, crypto) to optimize settings for your trading style.
The volume filter will not work on markets where volume data is unavailable. In such cases, disable the volume filter in the settings.
For best results, use on high-liquidity markets when the volume filter is enabled.

ICT FVG Buy/Sell SignalsThis bot is built on ICT (Inner Circle Trader) concepts such as:
Fair Value Gaps (FVGs) – imbalance zones between candles.
Consequent Encroachment (CE) – the midpoint of a gap.
Premium / Discount Arrays – dealing ranges split into premium (sell-side) and discount (buy-side) zones.
Displacement candles – strong impulsive moves that confirm intent.
The bot scans for FVGs, marks CE levels, and waits for price to return to these levels.
When price revisits a valid FVG zone with displacement confirmation and in the correct PD array, the bot generates a BUY or SELL signal.
✅ Signal Rules
Buy Signal
Price trades back into a Bullish FVG.
Current bar shows bullish displacement (large bullish body relative to ATR).
Price is in discount territory of the current dealing range (if PD filter is enabled).
Close is above the CE line of the FVG.
Sell Signal
Price trades back into a Bearish FVG.
Current bar shows bearish displacement.
Price is in premium territory of the current dealing range.
Close is below the CE line of the FVG.
🎯 What You’ll See on the Chart
Green “BUY” labels below candles when long signals trigger.
Red “SELL” labels above candles when short signals trigger.
Shaded background:
Red = Premium zone (sell side).
Teal = Discount zone (buy side).
Yellow line = dealing range midpoint (equilibrium).
Dots on CE lines = midpoints of the latest bullish/bearish FVG.
🔔 Alerts
ICT Buy → Triggers when a bullish setup confirms.
ICT Sell → Triggers when a bearish setup confirms.
You can connect these alerts to:
TradingView notifications.
Webhooks (for brokers or bots like MetaTrader, NinjaTrader, or Discord).
⚙️ Settings
Swing length – how many bars to use when detecting swing highs/lows for the dealing range.
Use PD filter – toggle ON/OFF for requiring discount/premium alignment.
Displacement ATR multiple – how strong the candle body must be compared to ATR to count as a displacement.
ATR length – used for displacement filter.
📈 Supported Markets
Works on all symbols and timeframes.
Commonly applied to:
NASDAQ (NQ, QQQ)
S&P500 (ES, SPX, SPY)
Forex pairs
Crypto (BTC, ETH, etc.)
⚠️ Disclaimer
This bot is for educational purposes only. It does not guarantee profits and should be tested on demo accounts first.
Always apply proper risk management before trading live.


Momentum Index [BigBeluga]The Momentum Index is an innovative indicator designed to measure the momentum of price action by analyzing the distribution of positive and negative momentum values over a defined period. By incorporating delta-based calculations and smoothing techniques, it provides traders with a clear and actionable representation of market momentum dynamics.
🔵 Key Features:
Delta-Based Momentum Analysis:
Calculates the momentum of price by comparing its current state to its value from a defined number of bars back.
Inside a loop, it evaluates whether momentum values are above or below zero, producing a delta value that reflects the net momentum direction and intensity.
Double EMA Smoothing:
Smooths the raw delta-based momentum values with a double EMA filter, reducing noise and providing a clearer trend signal.
tmi(len) =>
sum = 0.0
sum1 = 0.0
above = 0.0
below = 0.0
src_ = src - src
for i = 0 to len
sum := sum + (src_ > nz(src_ ) ? 1 : -1)
sum1 := sum1 + (sum > 0 ? 1 : -1)
sum1 := emaEma(sum1, 10)
for i = 1 to len
above := above + (sum1 > 0 ? 1 : 0)
below := below + (sum1 > 0 ? 0 : 1)
Directional Momentum Signals:
Generates momentum shift signals and displays them on both the oscillator and the main chart:
- △ Aqua Triangles: Represent upward momentum shifts.
- ▽ Red Triangles: Represent downward momentum shifts.
Dynamic Gradient Display:
Highlights momentum zones with gradient fills:
- Aqua shades for positive momentum (above zero).
- Red shades for negative momentum (below zero).
Dashboard Display:
A dashboard summarizing the count of momentum values above and below zero for the defined period (Sentiment Length e.g. 100), helping traders assess market sentiment at a glance.
🔵 How It Works:
The indicator takes price momentum as its source and evaluates the number of momentum values above and below zero within a defined period.
The delta calculation aggregates this information, providing a net representation of the prevailing market momentum.
A double EMA filter is applied to the delta values, smoothing the momentum line and enhancing signal clarity.
Momentum shifts are highlighted with visual signals on the oscillator and price chart, while the gradient display provides a visual representation of intensity.
🔵 Use Cases:
Momentum Tracking: Identify whether market momentum is predominantly bullish or bearish.
Signal Confirmation: Use chart-based signals to confirm potential trend reversals or continuation.
Analyze Market Strength: Leverage the dashboard to quickly assess the distribution of momentum over the chosen period.
Overbought/Oversold Conditions: Utilize gradient zones to detect areas of momentum extremes and possible price exhaustion.
Momentum Index offers a refined approach to analyzing momentum dynamics, combining delta-based calculations with smoothing techniques and intuitive visuals, making it an essential tool for traders looking to anticipate market movements effectively.

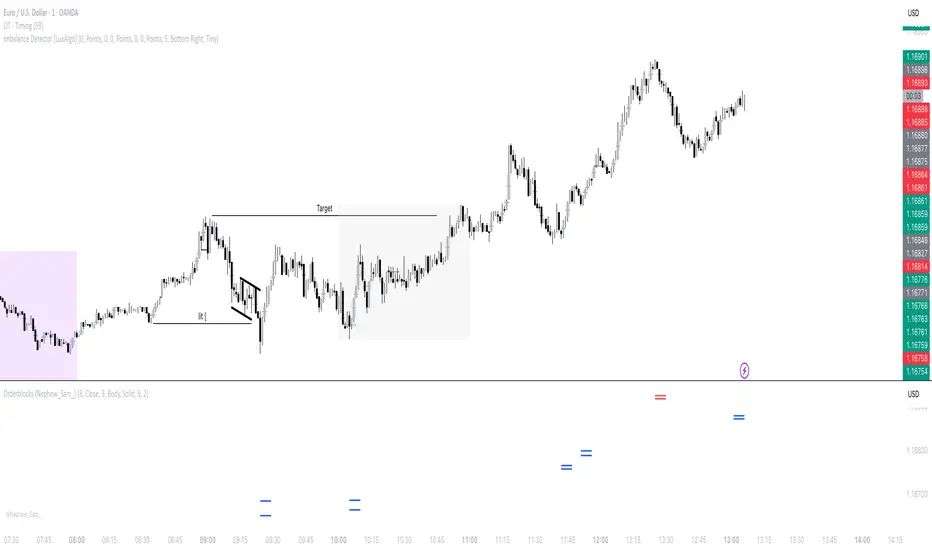
OB i work onorderblock i am working on (Mihai Pintilie)
in this i am aiming to make it such that it shows the orderblock after a MSS even if it's just a wick close not just a body close
Dow Theory Indicator## 🎯 Key Features of the Indicator
### 📈 Complete Implementation of Dow Theory
- Three-tier trend structure: primary trend (50 periods), secondary trend (20 periods), and minor trend (10 periods).
- Swing point analysis: automatically detects critical swing highs and lows.
- Trend confirmation mechanism: strict confirmation logic based on consecutive higher highs/higher lows or lower highs/lower lows.
- Volume confirmation: ensures price moves are supported by trading volume.
### 🕐 Flexible Timeframe Parameters
All key parameters are adjustable, making it especially suitable for U.S. equities:
Trend analysis parameters:
- Primary trend period: 20–200 (default 50; recommended 50–100 for U.S. stocks).
- Secondary trend period: 10–100 (default 20; recommended 15–30 for U.S. stocks).
- Minor trend period: 5–50 (default 10; recommended 5–15 for U.S. stocks).
Dow Theory parameters:
- Swing high/low lookback: 5–50 (default 10).
- Trend confirmation bar count: 1–10 (default 3).
- Volume confirmation period: 10–100 (default 20).
### 🇺🇸 U.S. Market Optimizations
- Session awareness: distinguishes Regular Trading Hours (9:30–16:00 EST) from pre-market and after-hours.
- Pre/post-market weighting: adjustable weighting factor for signals during extended hours.
- Earnings season filter: automatically adjusts sensitivity during earnings periods.
- U.S.-optimized default parameters.
## 🎨 Visualization
1. Trend lines: three differently colored trend lines.
2. Background fill: green (uptrend) / red (downtrend) / gray (neutral).
3. Signal markers: arrows, labels, and warning icons.
4. Swing point markers: small triangles at key turning points.
5. Info panel: real-time display of eight key metrics.
## 🚨 Alert System
- Trend turning to up/down.
- Strong bullish/bearish signals (dual confirmation).
- Volume divergence warning.
- New swing high/low formed.
## 📋 How to Use
1. Open the Pine Editor in TradingView.
2. Copy the contents of dow_theory_indicator.pine.
3. Paste and click “Add to chart.”
4. Adjust parameters based on trading style:
- Long-term investing: increase all period parameters.
- Swing trading: use the default parameters.
- Short-term trading: decrease all period parameters.
## 💡 Parameter Tips for U.S. Stocks
- Large-cap blue chips (AAPL, MSFT): primary 60–80, secondary 25–30.
- Mid-cap growth stocks: primary 40–60, secondary 18–25.
- Small-cap high-volatility stocks: primary 30–50, secondary 15–20.

Mikey’s Strategy (AutoEMA+)
⚙️ Core Idea:
A long-only EMA crossover strategy that automatically selects the optimal EMA length (5–25) based on historical performance using a custom scoring system.
🎯 Entry Conditions:
Price crosses above the selected EMA.
(Optional) Price is above HTF EMA200 (higher timeframe trend).
(Optional) ADX is above a minimum threshold.
(Optional) Volume is above average × multiplier.
A cooldown period has passed since the last exit.
❌ Exit Condition:
Price closes fully below the EMA (current candle: high, low, and close all below),
and the previous candle was above or touched the EMA.
🧠 Auto EMA Selection Logic:
Scans EMAs in the range (e.g., 8–21) every N bars.
Scores each EMA based on:
Time price spent above the EMA
Respect for EMA (touches)
Trend consistency
Distance from EMA (when above)
Picks the EMA with the highest valid score, and updates only if it’s significantly better.
🛡️ Risk Management:
No pyramiding (1 position max).
Cooldown period after exit.
No hard stop loss or take profit.
📊 Visuals & Alerts:
Plots the selected EMA and optional HTF EMA200.
Entry markers and info label on the chart.
Alerts for valid entries and filtered signals.

Keks Key Level Fx SessionsThis script is designed to automatically plot and manage key levels for the major FX trading sessions (London, New York, and Asia). It helps traders identify the most relevant price areas that often act as support, resistance, or breakout zones during active market hours.
Key features:
Marks session highs, lows, and midpoints
Visualizes key intraday levels for better market structure analysis
Highlights potential breakout and retest areas
Works across multiple timeframes for flexibility
Clean and minimal chart design to avoid clutter
This tool is especially useful for traders who rely on session-based strategies, such as breakout trading, retests, or range trading, by providing a clear visual guide to the most important price zones.

VSA Volume OverlaySimple. When the VSA volume is above the average volume the line will draw orange. When below average volume plot , it will draw white.


15m — numerotare candele într-o perioadă delimitată15m — numerotare candele într-o perioadă delimitată

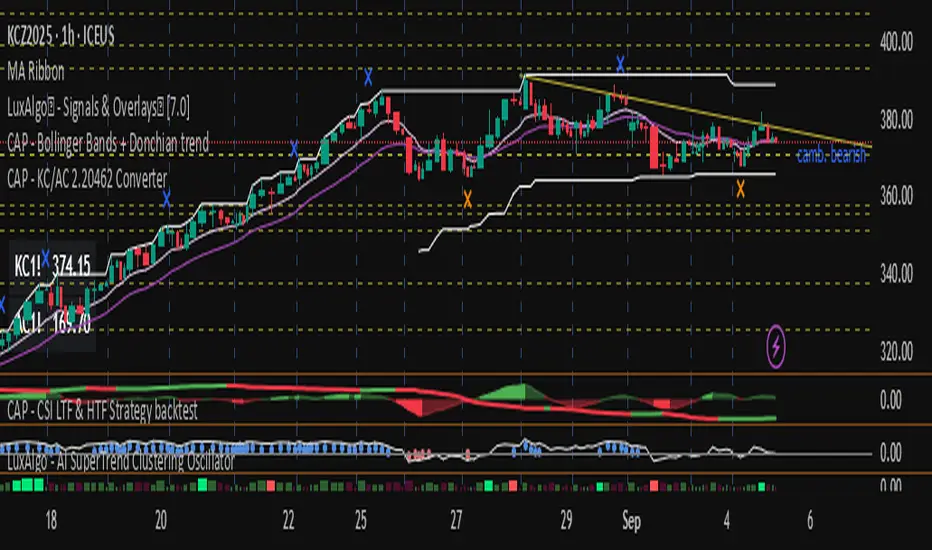
CAP - KC/AC 2.20462 Converter// ───────────────────────────────────────────────────────────────────────────────
// Purpose: Conversion Indicator for ICE “C” (KC) and “C Metric” (AC) Contracts
//
// Background:
// - The Intercontinental Exchange (ICE) is phasing out the legacy Coffee “C” contract (symbol: KC),
// which has been quoted in U.S. cents per pound, and replacing it with the new Coffee “C Metric” contract (symbol: AC),
// quoted in U.S. dollars per metric ton :contentReference {index=0}.
// - The final KC futures expire in March 2028; AC contracts begin trading in September 2025 and use modern specifications
// including pricing per metric ton and flexible bulk delivery formats :contentReference {index=1}.
//
// Why this script matters:
// - Traders are accustomed to the KC pricing format (¢/lb); the AC contract’s USD/MT may create confusion.
// - This indicator visually converts the current chart price—whether from KC or AC contracts—directly into its equivalent unit,
// helping traders quickly assess parity and compare trends across both contract types.
// - It simplifies head-to-head comparison during this transition period, improving clarity on chart price behavior.
//
// Usage instructions:
// - If the symbol starts with "KC", the script divides the price by 2.20462 to convert from ¢/lb to approximate ¢/kg.
// - If the symbol starts with "AC", the script multiplies the price by 2.20462 to reverse the conversion.
// - The results (converted values) are displayed in a table for immediate visual clarity.
// ───────────────────────────────────────────────────────────────────────────────
Artharjan ADXArtharjan ADX (AADX) by Rrahul Desai @Artharjan
📌 Overview
The Artharjan ADX (AADX) is an advanced implementation of the Average Directional Index (ADX) with customizable moving averages, momentum thresholds, and visually intuitive grading of bullish and bearish strength.
Unlike the standard ADX indicator that only shows trend strength, AADX adds graded bullish/bearish conditions, alerts, smoothed DI signals, histogram visualizations, and background color fills to help traders quickly interpret market conditions.
It is designed for traders who want early detection of trend strength, clean visual cues, and automated alert triggers for both bullish and bearish momentum setups.
⚙️ Key Features
🔹 Customizable Calculations
DI Length (default 13) – controls sensitivity of directional indicators.
+/- DI Smoothing – smooths DI signals with user-selected MA.
Multiple Moving Average Types – SMA, EMA, WMA, RMA, VWMA, ALMA, Hull, SWMA, SMMA, TMA.
ADX Smoothing – define how smooth/fast the ADX reacts.
🔹 Flexible Display
Toggle between line plots or histogram view.
Adjustable plot thickness.
Option to plot averages of ADX, +DI, -DI for confirmation.
Configurable background fills:
ADX above/below momentum threshold.
ADX rising/falling color shading.
Trend-grade based color intensity.
🔹 Momentum & Thresholds
Momentum Level (default 25) → defines “strong trend” zone.
Crossover Threshold (default 15) → helps detect early DI crossovers.
Color-coded histogram bars for +DI vs -DI difference:
Above/below zero.
Rising/falling momentum.
🔹 Bullish & Bearish Grading System
The indicator assigns grades from 1 to 5 for both bullish and bearish setups, based on DI and ADX conditions:
Bullish Grades
Grade 1 → Very Weak Bullish
Grade 2 → Weak Bullish
Grade 3 → Moderate Bullish
Grade 4 → Strong Bullish
Grade 5 → Very Strong Bullish
Bearish Grades
Grade 1 → Very Weak Bearish
Grade 2 → Weak Bearish
Grade 3 → Moderate Bearish
Grade 4 → Strong Bearish
Grade 5 → Very Strong Bearish
Labels are automatically plotted above bars to indicate the active grade.
🔹 Alerts
Bullish Alert → when +DI crosses above its average below the threshold OR bullish conditions are met.
Bearish Alert → when -DI crosses above its average below the threshold OR bearish conditions are met.
These alerts make it possible to automate trading signals for scalping, intraday, and swing trading.
📊 Use Cases
Trend Strength Measurement
Spot when markets shift from range-bound to trending.
Confirm the reliability of breakouts with strong ADX readings.
Bullish vs Bearish Control
Compare +DI vs -DI strength to gauge trend direction.
Identify trend reversals early with DI slope changes.
Momentum Confirmation
Use ADX rising + DI grades to validate trade entries.
Filter false breakouts with weak ADX.
Trade Grading System
Enter aggressively on Grade 4–5 signals.
Stay cautious on Grade 1–2 signals.
Automated Alerts & Screening
Combine AADX alerts with strategy rules.
Build scanners to highlight strong ADX setups across multiple stocks.
🎯 Trader’s Advantage
More powerful than standard ADX → Adds slope, grading, alerts, and visualization.
Adaptable to any style → Works for intraday scalping, swing trading, and positional analysis.
Visual clarity → Color fills, histograms, and labels simplify decision-making.
Customizable smoothing → Adjusts to fast or slow markets.
✅ Closing Note
The Artharjan ADX (AADX) transforms the traditional ADX into a complete trend and momentum analyzer. It helps traders detect, confirm, and act on directional strength with clarity and confidence.
With Thanks,
Rrahul Desai
@Artharjan

Buy vs Sell Volume EMA + Signals (fix: bgcolor scope)How to read it
Green EMA above Red EMA = sustained buying volume dominance.
Red EMA above Green EMA = sustained selling volume dominance.
Arrows mark shifts (crossovers).
Optional faint columns show the raw split of buy/sell volume if you enable “Show Raw Buy/Sell Volume Bars.”
