Göstergeler ve stratejiler

Risk Trading Strategy策略定义 :使用 strategy 函数定义一个名为 "Risk Trading Strategy" 的交易策略。
输入参数 :沿用原指标中的风险价格显示参数。
指标计算 :保留原指标中的风险值计算逻辑,包括计算 374 周期简单移动平均线、平均值、归一化风险值等。
交易信号定义 :根据归一化风险值定义交易信号:
买入开多 :当风险值低于 0.3 时,触发买入信号。
平多仓 :当风险值高于 0.6 或 0.7 时,触发平多信号。
卖出开空 :当风险值高于 0.7 时,触发卖出信号。
平空仓 :当风险值低于 0.4 时,触发平空信号。
交易执行 :使用 strategy.entry 函数执行买入和卖出操作,并设置止损点为 5 个点,使用 strategy.exit 函数实现止损和平仓功能。
标签绘制 :在图表上绘制买入、卖出和平仓信号的标签,帮助用户直观地识别交易机会。
使用说明
将代码复制到 TradingView :将上述代码复制并粘贴到 TradingView 的 Pine 编辑器中,点击 “添加到图表” 按钮将其加载到图表上。
调整参数 :可以根据个人需求调整相关参数。
观察信号 :在图表上观察策略生成的买入、卖出和平仓信号。
注意事项
参数优化 :在实际使用前,建议在历史数据上进行充分的回测和优化,以评估策略的有效性和适应性。
风险管理 :任何交易策略都存在风险,使用前请确保您了解其逻辑和潜在风险,并根据自己的风险承受能力进行调整。
Strategy Definition:
The strategy is defined using the strategy function and is named "Risk Trading Strategy".
Input Parameters:
The input parameter from the original indicator is carried over, which is the risk price display parameter.
Indicator Calculation:
The original indicator's logic for calculating risk values is retained. This includes computing the 374-period simple moving average, average values, and normalizing the risk value.
Trading Signal Definition:
Trading signals are defined based on the normalized risk value:
Buy Signal: Triggered when the risk value is below 0.3.
Exit Long Signal: Triggered when the risk value exceeds 0.6 or 0.7.
Sell Signal: Triggered when the risk value exceeds 0.7.
Exit Short Signal: Triggered when the risk value drops below 0.4.
Trade Execution:
The strategy.entry function is used to execute buy and sell operations, with a stop loss set at 5 points. The strategy.exit function is used to implement stop losses and exit trades.
Label Plotting:
Labels for buy, sell, and exit signals are plotted on the chart to help users visually identify trading opportunities.
Usage Instructions:
Add to TradingView: Copy and paste the code into TradingView's Pine Editor and load it onto the chart.
Parameter Adjustment: Parameters can be adjusted according to personal needs.
Signal Observation: Monitor the chart for buy, sell, and exit signals generated by the strategy.
Notes:
Parameter Optimization: Backtest and optimize the strategy on historical data before actual use to evaluate its effectiveness.
Risk Management: Understand the strategy's logic and risks, and adjust according to your risk tolerance.

Color HMA + 任意時間足ATRラインThis indicator uses QQE to show market movements. Red means down and blue means up.

color Moving AverageThis is an 11HMA indicator. It shows the market situation with a moving average line.

Daily Range + Trading sessionsIndicator that shows daily ranges on the chart.
Marks every trading session in a day.

Enhanced MA Cloud Guru ProEnhanced MA Cloud Guru Pro — Indicator Description
The Enhanced MA Cloud Guru Pro is a multi-layered trend and signal tool designed to visualize both short-term momentum and long-term trend context using six customizable moving averages.
🔹 Core Features:
MA Clouds:
Two distinct "clouds" are plotted:
MA Cloud 1–3 (short-term trend)
MA Cloud 4–6 (long-term trend)
Clouds are color-coded: bullish, bearish, or neutral, based on moving average alignment.
Contrarian Crossover Signals:
Buy signal: when MA1 crosses above MA3, but long-term cloud (MA4–6) is bearish or neutral — suggesting a potential reversal or early trend shift.
Sell signal: when MA1 crosses below MA3, while MA4–6 is bullish or neutral — indicating a possible breakdown or reversal.
Cloud-to-Cloud Entry Signals:
Bullish signal: when the short-term MA cloud enters upward into the long-term cloud from below.
Bearish signal: when the short-term MA cloud enters downward into the long-term cloud from above.
These mark potential trend transition zones or conflict between timeframes.
Cooldown Logic:
Adjustable cooldown bars prevent signal clustering and reduce noise.
🔹 Customization:
All MAs are independently adjustable in length and type (SMA, EMA, WMA, HMA).
Cloud transparency, colors, and signal timing can be tailored to user preference.
🧠 Use Case:
This indicator is ideal for:
Traders who want early trend reversal clues (contrarian logic)
Visualizing interaction between short- and long-term structure
Combining momentum shifts with long-term trend filters

4-EMA Signals 3.04-EMA Signals: Multi-Timeframe Trading Indicator
Overview
4-EMA Signals 3.0 is a trading indicator that combines exponential moving averages, volume analysis, and multi-timeframe trend assessment to provide high-probability entry and exit signals. Designed for both day traders and swing traders, it offers a comprehensive approach to market analysis.
Key Features:
EMA System
-- our Configurable EMAs: Fast (7), Medium-Short (25), Medium-Long (70), and Slow (200)
-- Preset Configurations: Choose between Custom, Conservative (9/20/50/200), Aggressive (5/10/20/50), or Fibonacci (8/21/55/144)
-- Visual Clarity: Color-coded EMAs for quick trend identification
-- Non-Repainting Signals: All signals use confirmed bars only, ensuring reliability for back-testing
-- Signal Generation
Six Crossover Combinations: Detects all possible crossovers between the four EMAs
-- Buy/Sell Visualization: Green triangles (buy) and red triangles (sell) clearly mark entry points
-- Volume Confirmation: Optional volume filter with adjustable sensitivity (0.1-3.0)
-- Alert System: Customizable alerts for all signal types
Multi-Timeframe Analysis
-- Three Timeframe Analysis: 5-minute, 1-hour, and 4-hour trend detection
-- Higher Timeframe Bias: Overall market direction assessment based on EMA alignment
--Visual Table Display: Color-coded table showing trend status across all timeframes
Trading Session Tracking
-- Major Sessions: London (08:00-17:00), New York (13:00-22:00), Asia (22:00-08:00), Sydney (22:00-07:00)
-- Session Indicators: Background colors distinguish active trading sessions
-- GMT+1 Timezone: Optimized for European trading schedule
Volume Analytics
-- Volume Filter: Compare current volume against 20-period SMA with adjustable sensitivity
-- Per Candle Volume: Real-time volume data for the current candle
-- Daily Volume: Track total daily volume in thousands
Trading Applications
-- Trend Following: Use EMA alignment to identify strong directional moves
-- Scalping: Fast EMA crosses provide quick entry and exit points
-- Swing Trading: Higher timeframe analysis helps identify broader market bias
-- Session Trading: Optimize entries based on specific market sessions
-- Risk Management: Volume filter helps avoid low-liquidity, high-risk trades
Technical Details
-- Pine Script Version: v5
-- Chart Compatibility: Works on all timeframes and markets
-- Performance Optimized: Efficient code with max_labels_count limit
-- Non-Repainting: Reliable signals that don't change after formation
The 4-EMA Signals indicator combines the simplicity of moving average crossovers with the depth of multi-timeframe analysis and volume confirmation, creating a powerful yet easy-to-use trading tool for traders of all experience levels.

TRIX with Directional Coloring and EMATrix colored based on direction and position in relation to 0 line.
It includes a customizable 5 period EMA

20 MA with ATRThis indicator overlays a Moving Average (SMA or EMA) on the chart, along with dynamic upper and lower bands based on the Average True Range (ATR). It's designed to help you track long-term trend direction and volatility zones with clarity — ideal for monthly or higher timeframe analysis.
What It Does ?
Plots a Simple or Exponential Moving Average (MA) of a chosen price (default is Low).
Adds two dynamic bands:
Upper Band = MA + ATR
Lower Band = MA - ATR
Uses ATR (Average True Range) to represent market volatility and distance from the moving average.
Why Use This?
This indicator blends trend and volatility awareness into a single view:
Use the MA as a long-term trend guide.
Use the ATR bands to identify:
Potential buy zones near lower band during uptrends.
Caution zones near upper band where price may be extended.
On monthly charts, this helps long-term investors spot deep-value or extended price levels based on both trend and volatility.
Customizable Inputs
MA Type: SMA or EMA
MA Length: Default is 20 periods (great for monthly swing cycles)
ATR Length: Default is 14 (standard volatility window)
Input Source: Use Low, Close, or any price point for flexibility
Suggested Use (Monthly Charts)
Track when price pulls back toward the lower ATR band for potential accumulation zones.
Monitor breakouts above the upper ATR band as signs of momentum continuation.
Spot trend exhaustion when price hugs an ATR band for too long.
Ideal For:
Long-term investors and swing traders
Value buyers looking for low-risk re-entries in trends
Portfolio positioning during market extremes

5 EMA (8/20/50/100/200)5 EMA's combined together. instead of adding them all and will be a personal one for my work.


Moving Averages with ADR%/ATR/52W TableRemoved Market Cap function from the indicator as it was facing problems with the Index Charts. Market Cap function is available with other indicator.

EMA Crossover with RSI FilterWhat this indicator does:
Plots two EMAs (default: 9 & 21).
Uses RSI to filter entries (avoids buy signals when RSI is overbought, sell signals when RSI is oversold).
Gives simple visual buy/sell signals when EMA crossovers occur and RSI confirms.
Light background color to visualize bullish/bearish conditions.

SSRO - OTHERS (Altcoins)This indicator is created based on the SSRO indicator made by EliCobra so credits to him
The original indicator is meant for BTC
I created one with AI for the OTHERS chart so we can measure if stablecoins have enough power to push the price of Altcoins higher.
I use Length: 25 on the weekly chart (175 on the Daily Chart)
The red zone means stablecoins have a difficult time pushing the price of altcoins higher (usually a good point to sell)
The green zone means stablecoins have a lot of room to push the price of altcoins higher (usually a good point to buy)
Credits to the youtuber No BS Crypto for inspiring me to create this indicator


Devrat Smart Confluence 55% long Strategy v3ema 30/50 and 100 55% win rate trades logic :
| Confluence Factor | Purpose |
| ------------------------------------------ | ------------------------------ |
| ✅ EMA 30/50/100 alignment | Trend confirmation |
| ✅ ADX > 20 | Strong momentum filter |
| ✅ Pullback to dynamic support (EMA30 zone) | Sniper entries, not chasing |
| ✅ Bullish engulfing *AND* volume spike | Confirm real buyer interest |
| ✅ Trade only during NY/London hours | Avoids fakeouts from Asia chop |

VVIX vs VIX ROC Gamma RegimeMeant to show +/- gamma environment based on VVIX outpacing VIX in a given time period

Sniper EMA Indicator (No Arrows, No Alerts)//@version=5
indicator("Sniper EMA Indicator (No Arrows, No Alerts)", overlay=true)
ema6 = input.int(6, title="EMA 6")
ema12 = input.int(12, title="EMA 12")
ema20 = input.int(20, title="EMA 20")
ema120 = input.int(120, title="EMA 120")
ema_6 = ta.ema(close, ema6)
ema_12 = ta.ema(close, ema12)
ema_20 = ta.ema(close, ema20)
ema_120 = ta.ema(close, ema120)
vwap_val = ta.vwap
plot(ema_6, color=color.orange, title="EMA 6")
plot(ema_12, color=color.teal, title="EMA 12")
plot(ema_20, color=color.blue, title="EMA 20")
plot(ema_120, color=color.yellow, title="EMA 120")
plot(vwap_val, color=color.fuchsia, title="VWAP")

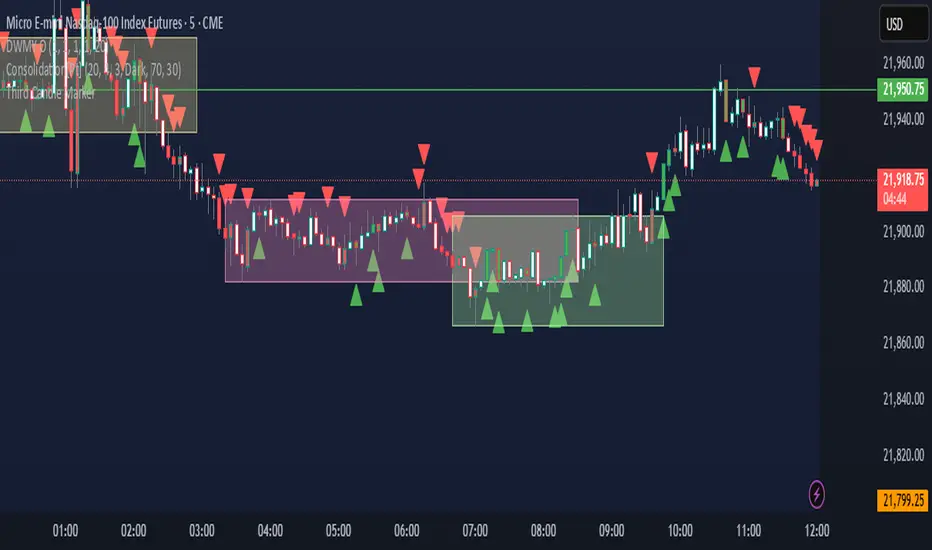
Third Candle MarkerTitel: Third Candle Marker – Highlights Trend Continuation
Beschreibung:
This script highlights potential trend continuation setups by marking the third candle after two consecutive candles of the same direction.
If the previous two candles were bullish (green), the third candle is colored green.
If the previous two candles were bearish (red), the third candle is colored red.
A white color indicates that no clear trend was detected in the previous two candles.
Additionally, the script plots small triangle markers:
Green upward triangle below the bar if the last two candles were bullish.
Red downward triangle above the bar if the last two candles were bearish.
Use this tool to visually identify potential continuation signals in trending markets. Suitable for all timeframes.
Note: This script does not generate buy/sell signals; it is meant to assist in visual trend recognition.
Pionex Signal Bot (Single/Multi Position)Guide: Integrating Your TradingView Strategy with a Signal Bot
This guide provides step-by-step instructions for connecting a TradingView strategy script with a compatible signal bot platform for automated execution, such as Pionex.
This script is based on DCA strategy execution, with the capability of customizable signal indicators by modifying the script section for modularity with minimal adjustments to adapt other source code. The default indicator is the moving average.
You will need an account on a compatible bot execution platform to execute the trades.
You will need a TradingView account with at least an Essential subscription for Alert and Webhook URL access.
A desktop browser is required to access the TradingView Pinescript Editor and the Signal bot configuration page on the execution platform.
1. Configuring the “Signal” on the Bot Execution Platform
Log in to your bot execution platform account (e.g., Pionex).
Navigate to the Futures → Futures Bot → Signal Bot section.
Click on the “Add signal” button and set the name and description for this signal, then click “Confirm.”
Once the signal has been created, directly click on the “I have completed the configuration” and “I have created the alert” buttons on the bot platform.
Signal setup on the bot execution platform has been completed.
2. Add a Strategy Script to the TradingView Chart
Log in to your TradingView account.
Choose the desired trading pair on your integrated exchange, and click the “ Launch chart “ button.
Click “Indicators”, select the Signal bot script you want to use.
Click the “Gear” icon to open the strategy settings, on the “Input” tab, copy the “Message” provided by your bot execution platform into the “Pionex Message” (or equivalent) textbox within the script's inputs.
On the “Properties” settings, refer to the recommended settings as follows:
• Initial capital: Keep this value at "100".
• Base currency: Keep this value at “Default”.
• Order size: 1 ~ 100 USDT. Keep the value within 1 to 100 USDT. 50 USDT may be translated as 50% fund utilization on the execution platform, such as Pionex .
• Pyramiding: 1 ~ any value. This value is for multi-position entry settings.
• Margin for long positions: Keep this value at "0".
• Margin for short positions: Keep this value at "0".
• Other parameters can be ignored as they do not impact the core configuration.
Strategy configuration in the TradingView chart has been completed.
3. Configuring the Strategy Alert on TradingView for Bot Connection
Log in to your TradingView account.
Click on the “Alarm” icon in the upper right corner, and click the “+” icon to create a new alert.
In the “Settings” tab, choose the desired strategy from the list.
Note: The latest configuration will typically be at the bottom of the list and may need to be updated every time there are changes to the strategy “Input” configuration.
In the “Message” tab, keep the value unchanged as the default content.
Note: This variable will produce the necessary JSON code for the trading instruction.
In the “Notification” tab, enable the “Webhook URL” and paste the Webhook URL obtained from your bot execution platform into the “Webhook URL” field in TradingView.
Click the “Create” button to complete the setup, and the alert will appear in the “Alert” list.
Strategy Alert configuration in the TradingView chart has been completed.
4. Creating the Signal Bot on the Execution Platform with the Linked Strategy
Log in to your bot execution platform account (e.g., Pionex).
Navigate to Futures → Futures Bot → Signal Bot.
On the “Signal Bot” page, click the “Automate signal” button to configure the bot settings, and then click the “Create the bot.”
The Signal bot creation on the execution platform has been completed.
5. Checking Signal Transmission Between TradingView and Bot Platform
Log in to your TradingView account.
Click on the “Alarm” icon in the upper right corner, and click the “Log” tab to check the alert history.
Log in to your bot execution platform account (e.g., Pionex).
Click on “Details” for your bot and then navigate to the “Signal Log” tab.
Compare the TradingView Alert log with the bot execution platform's Signal Log to ensure the signals are received properly.
To understand the raw Message content, manual interpretation or platform-specific tools may be required.
6. How to Add Other Indicator into the Strategy Script for the Signal Bot
Log in to your TradingView account.
Obtain the open-source indicator, such as “RSI”, into the TradingView chart, and copy its Pine Script™ source code.
Open the Signal bot strategy script in the Pine Script™ Editor. This script is typically optimized for integration with the bot execution platform.
Paste the custom indicator source code into the specific designated section for custom indicators within the Signal bot strategy script.
Define the conditions for “Long” (buy) and “Short” (sell) entries from your custom indicator into the pre-defined “longCondition” and “shortCondition” variables within the script.
Click the “Add to chart” or “Update on chart” button to complete the script configuration and apply changes to your chart.
Integrating a custom indicator into the strategy script has been completed.

Turtle God IndicatorThe Turtle God indicator displays a turtle icon 🐢 on the most recent candle only, helping traders track current candle behavior at a glance.
✅ Green Turtle above the candle if it’s bullish (close > open)
🔻 Red Turtle below the candle if it’s bearish (close < open)
📌 Only the latest candle is marked — no historical clutter
This tool is useful for:
Live price action observation
Real-time signal overlays
Clean chart setups with dynamic candle feedback

Market Strength Buy Sell Indicator [TradeDots]A specialized tool designed to assist traders in evaluating market conditions through a multifaceted analysis of relative performance, beta-adjusted returns, momentum, and volume—allowing you to identify optimal points for long or short trades. By integrating multiple benchmarks (default S&P 500) and percentile-based thresholds, the script provides clear, actionable insights suitable for both day trading and higher-level timeframe assessments.
📝 HOW IT WORKS
1. Multi-Factor Composite Score
Relative Performance (RS Ratio): Compares your asset’s performance to a chosen benchmark (default: SPY). Values above 1.0 indicate outperformance, while below 1.0 suggest underperformance.
Beta-Adjusted Returns: Checks the ticker’s excess movement relative to expected market-related moves. This helps distinguish pure “alpha” from broad market effects.
Volume & Correlation: Volume spikes often confirm the momentum behind a move, while correlation measures how closely the asset tracks or diverges from its benchmark.
These components merge into a 0–100 composite score. Scores above 50 frequently imply bullish strength; drops below 50 often point to underperformance—potentially flagging short opportunities.
2. Intraday & Day Trading Focus
Monitoring Below 50: During the trading day, the script calculates live data against the benchmark, offering an intraday-sensitive composite score. A dip under 50 may indicate a short bias for that session, especially when accompanied by high volume or momentum shifts.
3. Higher Timeframe Monitoring
Daily Strategies: On daily or weekly charts, the script reveals overall relative strength or weakness compared to the S&P 500. This higher-level perspective helps form broader trading biases—crucial for swing or position trades spanning multiple days.
Long/Short Thresholds: Persistent readings above 50 on a daily chart typically reinforce a long bias, while consistent dips below 50 can sustain a short or cautious outlook.
4. Pair Trading Applications
Custom Benchmark Selection: By setting a specific ticker pair as your benchmark instead of the default S&P 500, you can identify spread trading opportunities between two correlated assets. This allows you to go long the outperforming asset while shorting the underperforming one when the spread reaches extreme levels.
4. Color-Coded Signals & Alerts
Visual Zones (25–75): Color-coded bands highlight strong outperformance (above 75) or pronounced underperformance (below 25).
Alerts on Strong Shifts: Automatic alerts can notify you of sudden entries or exits from bullish or bearish zones, so you can potentially act on new market information without delay.
⚙️ HOW TO USE
1. Select Your Timeframe: For scalping or day trading, lower intervals (e.g., 5-minute) offer immediate data resets at the session’s start. For multi-day insight, daily or weekly charts reveal broader performance trends.
2. Watch Key Levels Around 50: Intraday dips under 50 may be a cue to consider short trades, while bounces above 50 can confirm renewed strength.
3. Assess Benchmark Relationships: Compare your asset’s score and signals to the broader market. A stock falling below its pair’s relative strength line might lag overall market momentum.
4. Combine Tools & Validate: This script excels when integrated with other technical analysis methods (e.g., support/resistance, chart patterns) and fundamental factors for a holistic market view.
❗ LIMITATIONS
No Direction Guarantee: The indicator identifies relative strength but does not guarantee directional price moves.
Delayed Updates: Since calculations update after each bar close, sudden intrabar changes may not immediately reflect.
Market-Specific Behaviors: Some assets or unusual market conditions may deviate from typical benchmarks, weakening signal reliability.
Past ≠ Future: High or low relative strength in the past may not predict continued performance.
RISK DISCLAIMER
All forms of trading and investing involve risk, including the possible loss of principal. This indicator analyzes relative performance but cannot assure profits or eliminate losses. Past performance of any strategy does not guarantee future results. Always combine analysis with proper risk management and your broader trading plan. Consult a licensed financial advisor if you are unsure of your individual risk tolerance or investment objectives.

