combinLibrary "combin"
Description:
The combin function is a the combination function
as it calculates the number of possible combinations for two given numbers.
This function takes two arguments: the number and the number_chosen.
For example, if the number is 5 and the number chosen is 1,
there are 5 combinations, giving 5 as a result.
Reference:
ideone.com
support.microsoft.com
combin(n, kin)
Returns the number of combinations for a given number of items. Use to determine the total possible number of groups for a given number of items.
Parameters:
n : int, The number of items.
kin : int, The number of items in each combination.
Returns: int.
Göstergeler ve stratejiler

norminvLibrary "norminv"
Description:
An inverse normal distribution is a way to work backwards
from a known probability to find an x-value. It is an informal term and
doesn't refer to a particular probability distribution. Returns the
value of the inverse normal distribution function for a specified value,
mean, and standard deviation.
Reference:
github.com
support.microsoft.com
norminv(x, mean, stdev)
Returns the value of the inverse normal distribution function for a specified value, mean, and standard deviation.
Parameters:
x : float, The input to the normal distribution function.
mean : float, The mean (mu) of the normal distribution function
stdev : float, The standard deviation (sigma) of the normal distribution function.
Returns: float.

cbndLibrary "cbnd"
Description:
A standalone Cumulative Bivariate Normal Distribution (CBND) functions that do not require any external libraries.
This includes 3 different CBND calculations: Drezner(1978), Drezner and Wesolowsky (1990), and Genz (2004)
Comments:
The standardized cumulative normal distribution function returns the probability that one random
variable is less than a and that a second random variable is less than b when the correlation
between the two variables is p. Since no closed-form solution exists for the bivariate cumulative
normal distribution, we present three approximations. The first one is the well-known
Drezner (1978) algorithm. The second one is the more efficient Drezner and Wesolowsky (1990)
algorithm. The third is the Genz (2004) algorithm, which is the most accurate one and therefore
our recommended algorithm. West (2005b) and Agca and Chance (2003) discuss the speed and
accuracy of bivariate normal distribution approximations for use in option pricing in
ore detail.
Reference:
The Complete Guide to Option Pricing Formulas, 2nd ed. (Espen Gaarder Haug)
CBND1(A, b, rho)
Returns the Cumulative Bivariate Normal Distribution (CBND) using Drezner 1978 Algorithm
Parameters:
A : float,
b : float,
rho : float,
Returns: float.
CBND2(A, b, rho)
Returns the Cumulative Bivariate Normal Distribution (CBND) using Drezner and Wesolowsky (1990) function
Parameters:
A : float,
b : float,
rho : float,
Returns: float.
CBND3(x, y, rho)
Returns the Cumulative Bivariate Normal Distribution (CBND) using Genz (2004) algorithm (this is the preferred method)
Parameters:
x : float,
y : float,
rho : float,
Returns: float.
cndLibrary "cnd"
Cumulative Normal Distribution
CND1(x)
Returns the Cumulative Normal Distribution (CND) using the Hart (1968) method. (preferred method, 14-18 decimal accuracy)
Parameters:
x : float,
Returns: float.
CND2(x)
Returns the Cumulative Normal Distribution (CND) using the Abromowitz and Stegun (1974) Polynomial Approximation.
Parameters:
x : float,
Returns: float.
CND3(x)
Returns the Cumulative Normal Distribution (CND) using Newton-Cotes method, Boole’s rule
Parameters:
x : float,
Returns: float.
chi2InvLibrary "chi2Inv"
chi2Inv(p, n)
Returns the inverse cumulative distribution function (icdf) of the chi-square distribution with degrees of freedom nu, evaluated at the probability values in p. Goldstein approximation
Parameters:
p : float, probability
n : float, degress of freedom source.
Returns: float.
TR_Base_LibLibrary "TR_Base_Lib"
TODO: add library description here
SetHighLowArray()
ChangeHighLowArray()
ShowLabel(_Text, _X, _Y, _Style, _Size, _Yloc, _Color)
TODO: Function to display labels
Parameters:
_Text : TODO: text (series string) Label text.
_X : TODO: x (series int) Bar index.
_Y : TODO: y (series int/float) Price of the label position.
_Style : TODO: style (series string) Label style.
_Size : TODO: size (series string) Label size.
_Yloc : TODO: yloc (series string) Possible values are yloc.price, yloc.abovebar, yloc.belowbar.
_Color : TODO: color (series color) Color of the label border and arrow
Returns: TODO: No return values
GetColor(_Index)
TODO: Function to take out 12 colors in order
Parameters:
_Index : TODO: color number.
Returns: TODO: color code
Tbl_position(_Pos)
TODO: Table display position function
Parameters:
_Pos : TODO: position.
Returns: TODO: Table position
Tbl_position_JP(_Pos)
TODO: テーブル表示位置 日本語表示位置を定数に変換
Parameters:
_Pos : TODO: 日本語表示位置
Returns: TODO: _result:表示位置の定数を返す
TfInMinutes(_Tf)
TODO: 足変換、TimeFrameを分に変換
Parameters:
_Tf : TODO: TimeFrame文字
Returns: TODO: _result:TimeFrameを分に変換した値、_chartTf:チャートのTimeFrameを分に変換した値
TfName_JP(_tf)
TODO: TimeFrameを日本語足名に変換して返す関数 引数がブランクの時はチャートの日本語足名を返す
Parameters:
_tf : TODO: TimeFrame文字
Returns: TODO: _result:日本語足名
DeleteLine()
TODO: Delete Line
Parameters:
: TODO: No parameter
Returns: TODO: No return value
DeleteLabel()
TODO: Delete Label
Parameters:
: TODO: No parameter
Returns: TODO: No return value
SetSessionTimesLibrary "SetSessionTimes"
Indian exchanage time session library, might be useful to code indicator or strategy necessary to call exchange trading sessions at NSE and MCX.
SetSessionTimes()

SetSessionTimesIndiaLibrary "SetSessionTimesIndia"
This library might be useful to code an indicator or strategy that requires to call Indian trading sessions at NSE and MCX.
SetSessionTimes()

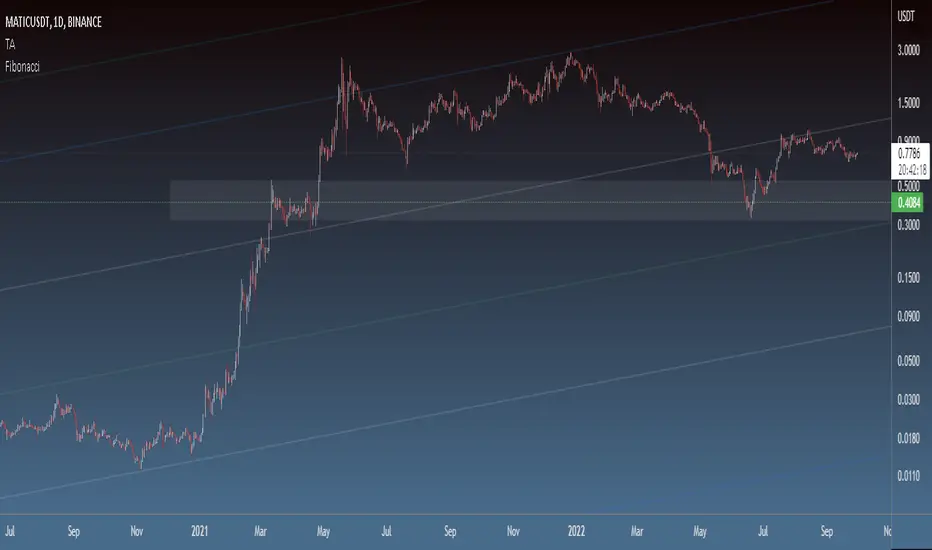
FibonacciLibrary "Fibonacci"
General Fibonacci functions. Get fib numbers, ratios, etc.
fib_precise(f, precision)
Get the precise Fibonacci ratio, to the specified number of decimal places
Parameters:
f : Fibonacci ratio (string, in form #.###)
precision : Number of decimal places (optional int, dft = 16, max = 32)
Returns: Precise Fibonacci ratio (float)
fib_n(n)
Calculate the Nth number in the Fibonacci sequence
Parameters:
n : Index/number in sequence (int)
Returns: Fibonacci number (int)
SupportResitanceAndTrendLibrary "SupportResitanceAndTrend"
Contains utilities for finding key levels of support, resistance and direction of trend.
superTrendPlus(multiple, h, l, atr, closeBars)
A more flexible version of SuperTrend that allows for supplying the series used and sensitivity adjustment by confirming close bars.
Parameters:
multiple : The multiple to apply to the average true range.
h : The high values.
l : The low values.
atr : The average true range values.
closeBars : The number of bars to confirm a change in trend.
Returns:
superTrend(multiple, period, mode, closeBars)
superTrendPlus with simplified parameters.
Parameters:
multiple : The multiple to apply to the average true range.
period : The number of bars to measure.
mode : The type of moving average to use with the true range.
closeBars : The number of bars to confirm a change in trend.
Returns:
superTrendCleaned(multiple, period, mode, closeBars, maxDeviation)
superTrendPlus with default compensation for extreme volatility.
Parameters:
multiple : The multiple to apply to the average true range.
period : The number of bars to measure.
mode : The type of moving average to use with the true range.
closeBars : The number of bars to confirm a change in trend.
maxDeviation : The optional standard deviation level to use when cleaning the series. The default is the value of the provided level.
Returns:
stochSR()
Identifies support and resistance levels by when a stochastic RSI reverses.
Returns:
stochAVWAP()
Identifies anchored VWAP levels by when a stochastic RSI reverses.
Returns:

MovingAveragesLibrary "MovingAverages"
vawma(len, src, volumeDefault)
VAWMA = VWMA and WMA combined. Simply put, this attempts to determine the average price per share over time weighted heavier for recent values. Uses a triangular algorithm to taper off values in the past (same as WMA does).
Parameters:
len : The number of bars to measure with.
src : The series to measure from. Default is 'hlc3'.
volumeDefault : The default value to use when a chart has no (N/A) volume.
Returns: The volume adjusted triangular weighted moving average of the series.
cma(n, D, C, compound)
Coefficient Moving Avereage (CMA) is a variation of a moving average that can simulate SMA or WMA with the advantage of previous data.
Parameters:
n : The number of bars to measure with.
D : The series to measure from. Default is 'close'.
C : The coefficient to use when averaging. 0 behaves like SMA, 1 behaves like WMA.
compound : When true (default is false) will use a compounding method for weighting the average.
ema(len, src)
Same as ta.ema(src,len) but properly ignores NA values.
Parameters:
len : The number of samples to derive the average from.
src : The series to measure from. Default is 'close'.
wma(len, src, startingWeight)
Same as ta.wma(src,len) but properly ignores NA values.
Parameters:
len : The number of samples to derive the average from.
src : The series to measure from. Default is 'close'.
startingWeight : The weight to begin with when calculating the average. Higher numbers will decrease the bias.
vwma(len, src, volumeDefault)
Same as ta.vwma(src,len) but properly ignores NA values.
Parameters:
len : The number of bars to measure with.
src : The series to measure from. Default is 'hlc3'.
volumeDefault : The default value to use when a chart has no (N/A) volume.
get(type, len, src)
Generates a moving average based upon a 'type'.
Parameters:
type : The type of moving average to generate. Values allowed are: SMA, EMA, WMA, VWMA and VAWMA.
len : The number of bars to measure with.
src : The series to measure from. Default is 'close'.
Returns: The moving average series requested.
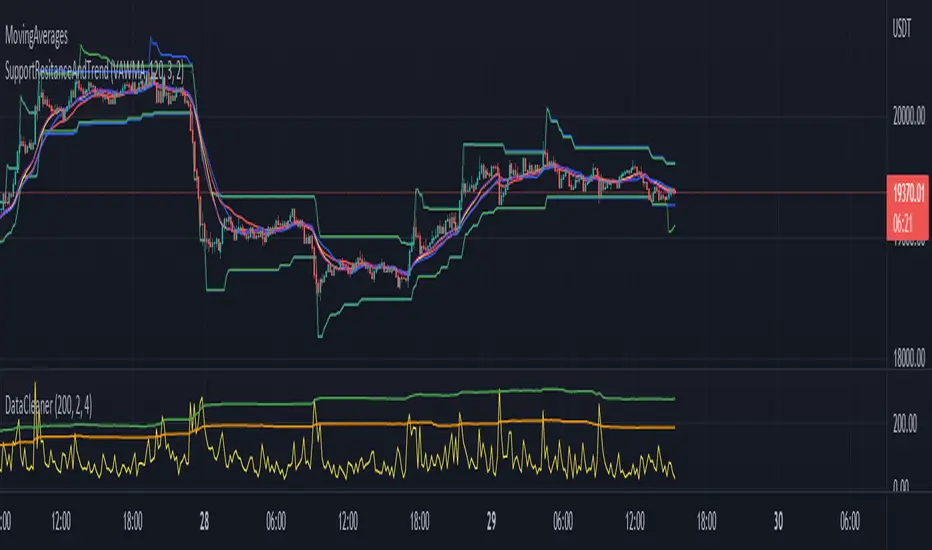
DataCleanerLibrary "DataCleaner"
outlierLevel(src, len, level)
Gets the (standard deviation) outlier level for a given series.
Parameters:
src : The series to average and add a multiple of the standard deviation to.
len : The The number of bars to measure.
level : The positive or negative multiple of the standard deviation to apply to the average. A positive number will be the upper boundary and a negative number will be the lower boundary.
Returns: The average of the series plus the multiple of the standard deviation.
naOutliers(src, len, maxDeviation)
Returns only values that are within the maximum deviation.
Parameters:
src : The series to filter results from.
len : The The number of bars to measure.
maxDeviation : The maximum deviation before considered an outlier.
normalize(src, len, maxDeviation, baseline)
Returns the source value adjusted by its standard deviation.
Parameters:
src : The series to measure.
len : The number of bars to measure the standard deviation.
maxDeviation : The maximum deviation before considered an outlier.
baseline : The value considered to be at center. Typically zero.
cleanUsing(src, result, len, maxDeviation)
Returns an array representing the result series with (outliers provided by the source) removed.
Parameters:
src : The source series to read from.
result : The result series.
len : The maximum size of the resultant array.
maxDeviation : The positive or negative multiple of the standard deviation to apply to the average. A positive number will be the upper boundary and a negative number will be the lower boundary.
Returns: An array containing the cleaned series.
clean(src, len, maxDeviation)
Returns an array representing the source series with outliers removed.
Parameters:
src : The source series to read from.
len : The maximum size of the resultant array.
maxDeviation : The positive or negative multiple of the standard deviation to apply to the average. A positive number will be the upper boundary and a negative number will be the lower boundary.
Returns: An array containing the cleaned series.
cleanArray(src, maxDeviation)
Returns an array representing the source array with outliers removed.
Parameters:
src : The source series to read from.
maxDeviation : The positive or negative multiple of the standard deviation to apply to the average. A positive number will be the upper boundary and a negative number will be the lower boundary.
Returns: An array containing the cleaned series.
naArrayOutliers(src, maxDeviation)
Returns an array representing the source array with outliers removed.
Parameters:
src : The array to set outliers to N/A.
maxDeviation : The maximum deviation before considered an outlier.
Returns: True if there were any outliers; otherwise false.
outlierLevelAdjusted(src, len, level, maxDeviation)
Gets the (standard deviation) outlier level for a given series after a single pass of removing any outliers.
Parameters:
src : The series to average and add a multiple of the standard deviation to.
len : The The number of bars to measure.
level : The positive or negative multiple of the standard deviation to apply to the average. A positive number will be the upper boundary and a negative number will be the lower boundary.
maxDeviation : The optional standard deviation level to use when cleaning the series. The default is the value of the provided level.
Returns: The average of the series plus the multiple of the standard deviation.

FrostyBotLibrary "FrostyBot"
JSON Alert Builder for FrostyBot.js Binance Futures and FTX orders
github.com
More Complete Version Soon.
TODO: Comment Functions and annotations from command reference ^^
TODO: Add additional whitelist and symbol mappings.
leverage()
buy()
sell()
cancelall()
closelong()
closeshort()
traillong()
trailshort()
long()
short()
takeprofit()
stoploss()

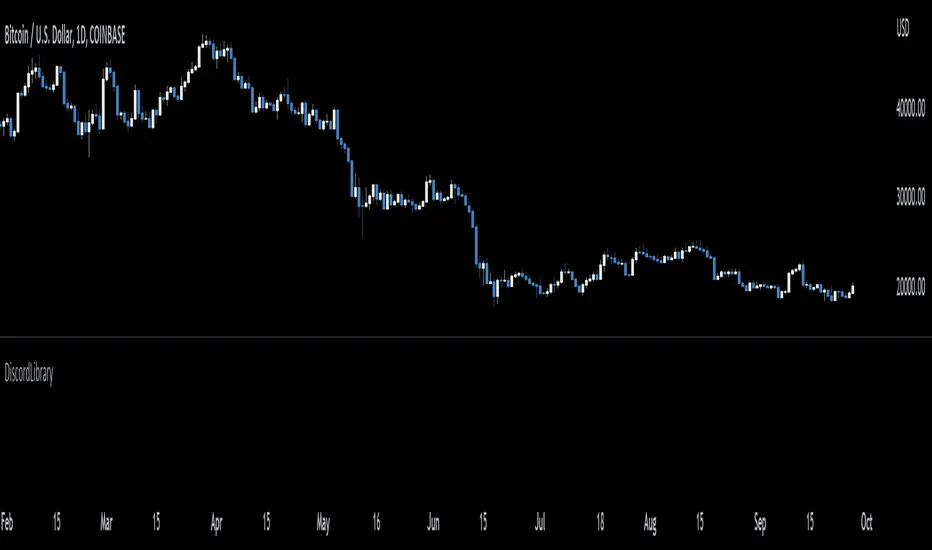
DiscordLibraryLibrary "DiscordLibrary"
BoldString()
Bold String in Discord Function
ItalicizeString()
Italicize String in Discord Function
StrikeThroughString()
Strikethrough a String in Discord Function
UnderlineString()
Underline a String in Discord Function
SpoilerString()
When you send the text, it will be shown as a black block, and only by clicking on it will you be able to see what is written below, in a way, unveiling the text or giving spoilers
HighlightString()
Highlight String Function
BoxedString()
Put String in a Box Function
NonEmbeddedURLString()
Format URL String so that it is not an embedded Image but just the Link
InvisibleString()
Send Inivisible Text
FormatTimePeriodForDiscord()
GetDiscordEmbedJSON()
Generate discord embed JSON
GetDiscordTextJSON()
Formats Content Only JSON Message
Truncate()
Custom function to truncate (cut) excess decimal places
FormatDiscordMessage()
format Content message
FormatCoin()
Format Ticker Symbol
PineHelperLibrary "PineHelper"
This library provides various functions to reduce your time.
recent_opentrade_entry_bar_index()
get a recent opentrade entry bar_index
Returns: (int) bar_index
recent_closedtrade_entry_bar_index()
get a recent closedtrade entry bar_index
Returns: (int) bar_index
recent_closedtrade_exit_bar_index()
get a recent closedtrade exit bar_index
Returns: (int) bar_index
all_opnetrades_roi()
get all aopentrades roi
Returns: (float) roi
bars_since_recent_opentrade_entry()
get bars since recent opentrade entry
Returns: (int) number of bars
bars_since_recent_closedtrade_entry()
get bars since recent closedtrade entry
Returns: (int) number of bars
bars_since_recent_closedtrade_exit()
get bars since recent closedtrade exit
Returns: (int) number of bars
recent_opentrade_entry_id()
get recent opentrade entry ID
Returns: (string) entry ID
recent_closedtrade_entry_id()
get recent closedtrade entry ID
Returns: (string) entry ID
recent_closedtrade_exit_id()
get recent closedtrade exit ID
Returns: (string) exit ID
recent_opentrade_entry_price()
get recent opentrade entry price
Returns: (float) price
recent_closedtrade_entry_price()
get recent closedtrade entry price
Returns: (float) price
recent_closedtrade_exit_price()
get recent closedtrade exit price
Returns: (float) price
recent_opentrade_entry_time()
get recent opentrade entry time
Returns: (int) time
recent_closedtrade_entry_time()
get recent closedtrade entry time
Returns: (int) time
recent_closedtrade_exit_time()
get recent closedtrade exit time
Returns: (int) time
time_since_recent_opentrade_entry()
get time since recent opentrade entry
Returns: (int) time
time_since_recent_closedtrade_entry()
get time since recent closedtrade entry
Returns: (int) time
time_since_recent_closedtrade_exit()
get time since recent closedtrade exit
Returns: (int) time
recent_opentrade_size()
get recent opentrade size
Returns: (float) size
recent_closedtrade_size()
get recent closedtrade size
Returns: (float) size
all_opentrades_size()
get all opentrades size
Returns: (float) size
recent_opentrade_profit()
get recent opentrade profit
Returns: (float) profit
all_opentrades_profit()
get all opentrades profit
Returns: (float) profit
recent_closedtrade_profit()
get recent closedtrade profit
Returns: (float) profit
recent_opentrade_max_runup()
get recent opentrade max runup
Returns: (float) runup
recent_closedtrade_max_runup()
get recent closedtrade max runup
Returns: (float) runup
recent_opentrade_max_drawdown()
get recent opentrade maxdrawdown
Returns: (float) mdd
recent_closedtrade_max_drawdown()
get recent closedtrade maxdrawdown
Returns: (float) mdd
max_open_trades_drawdown()
get max open trades drawdown
Returns: (float) mdd
recent_opentrade_commission()
get recent opentrade commission
Returns: (float) commission
recent_closedtrade_commission()
get recent closedtrade commission
Returns: (float) commission
qty_by_percent_of_equity(percent)
get qty by percent of equtiy
Parameters:
percent : (series float) percent that you want to set
Returns: (float) quantity
qty_by_percent_of_position_size(percent)
get size by percent of position size
Parameters:
percent : (series float) percent that you want to set
Returns: (float) size
is_day_change()
get bool change of day
Returns: (bool) day is change or not
is_in_trade()
get bool using number of bars
Returns: (bool) allowedToTrade
discord_message(name, message)
get json format discord message
Parameters:
name : (string) name of bot
message : (string) message that you want to send
Returns: (string) json format string
telegram_message(chat_id, message)
get json format telegram message
Parameters:
chat_id : (string) chatId of bot
message : (string) message that you want to send
Returns: (string) json format string

MetaWorldEngineFilterLibrary3Library "MetaWorldEngineFilterLibrary3"
GetCandleStickSize(Rule, Rule)
returns size of the candle
Parameters:
Rule : 1: (float) _src_high
Rule : 2: (float) _src_low
Returns: candlestick size
GetCandleStickBodySize(Rule, Rule)
returns size of the candle body
Parameters:
Rule : 1: (float) _src_open
Rule : 2: (float) _src_close
Returns: candlestick body size
FilterLongerLowerWickCandles(Rule, Rule, Rule)
Alters Candlestick Value to Magnify Candles with Long Wicks
Parameters:
Rule : 1: (float) open
Rule : 2: (float) close
Rule : 2: (float) low
Returns: Midpoint of the candle body less the lower wick. If value returned has a large delta from midpoint of the body, then it is short wick
IsBullish(Rule, Rule)
Determine if Candle is Bullish or Bearish
Parameters:
Rule : 1: (float) open
Rule : 2: (float) close
Returns: True is Bullish
IsDoji(Rule, Rule)
Determine if Candle is a Doji
Parameters:
Rule : 1: (int) Candle Index
Rule : 2: (float) Percentage of candle size. Larger the Number the less stringent the doji criterion
Returns: True if a Doji
MACD(Rule, Rule, Rule, Rule)
Computes MACD
Parameters:
Rule : 1: (float) _src
Rule : 2: (int) _fastLength input fast ema length
Rule : 2: (int) _slowLength input slow ema length
Rule : 3: (int) _signalLength input length of signal line (sma of MACD line)
Returns: Returns MACD and Signal Line
isFastSlowCrossed(Rule, Rule)
Computes if SeriesA crosses SeriesB
Parameters:
Rule : 1: (float) Series Input
Rule : 2: (float) Series Input
Returns: if SeriesA crosses SeriesB then true else false
isReversalUpTrend(Rule, Rule)
Computes if SeriesA crosses over SeriesB to determine reversal uptrend
Parameters:
Rule : 1: (float) Series Input
Rule : 2: (float) Series Input
Returns: if SeriesA crosses over SeriesB then true else false
isReversalDownTrend(Rule, Rule)
Computes if SeriesA crosses over SeriesB to determine reversal uptrend
Parameters:
Rule : 1: (float) Series Input
Rule : 2: (float) Series Input
Returns: if SeriesA crosses over SeriesB then true else false
SSMA(Rule, Rule)
Computes smoothed SMA
Parameters:
Rule : 1: (float) source
Rule : 2: (float) sma length
Returns: a single concatenated string for evaluation
GetTimeFrame()
Get Current timeframe in minutes
Returns: an integer value in minutes
getMA(float, int, string, float)
Gets a Moving Average based on type
Parameters:
float : _src The source data
int : length The MA period
string : maType The type of MA
float : sigma / smoothness of ALMA, else NA
Returns: A moving average with the given parameters
