Señal Cambio Dirección ADX con notificacióngiros abruptos de la tendencia diferenciando impulsos de retorcesos.
Göstergeler ve stratejiler

QQE with EMA Cross Strategy - GauravThis QQE and EMA Crossover based strategy is made to test on Index. Test and use wisely.

EMA 200 BUY SELLBu kod, belirli periyotlarda Üstel Hareketli Ortalama (EMA) çizgilerini hesaplar ve fiyatın bu çizgilerin üzerinde mi yoksa altında mı olduğunu belirler. Bu gösterge, yatırımcılara, fiyat hareketlerini analiz etmelerine ve trend değişimlerini belirlemelerine yardımcı olur.
EMA Hesaplama: Bu kod, 200 periyotluk EMA değerini hesaplar. EMA, belirli bir dönemdeki fiyat hareketlerinin ortalamasını alır ve daha yeni fiyatlara daha fazla ağırlık verir.
EMA Renk Ayarları: EMA çizgisinin rengi, fiyatın bu çizginin üstünde mi yoksa altında mı olduğuna göre belirlenir. Fiyat EMA'nın üzerindeyse çizgi yeşil, altında ise kırmızı renkte gösterilir.
Al ve Sat Sinyalleri: Fiyat, EMA çizgisinin üzerinden geçerse "Al" (Buy) sinyali, EMA çizgisinin altına düşerse "Sat" (Sell) sinyali oluşur. Bu sinyaller küçük üçgenler olarak grafikte gösterilir.
Bu gösterge, yatırımcıların grafik üzerinde alım ve satım noktalarını daha kolay belirlemelerine yardımcı olur ve bu sayede stratejilerini daha bilinçli bir şekilde oluşturabilirler.

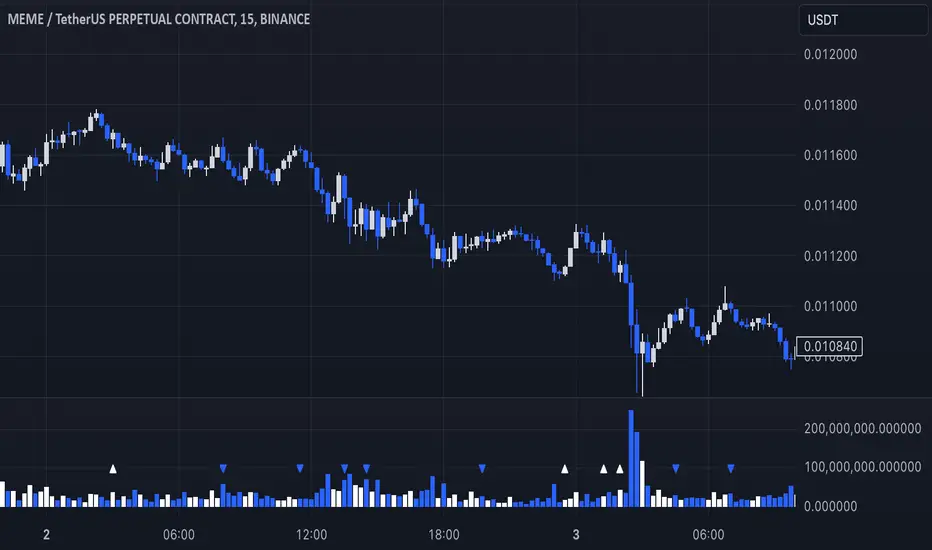
Custom Volume for scalping### **Indicator Summary: Custom Volume with Arrow Highlight**
#### **Purpose:**
This indicator visualizes volume bars in a chart, highlighting specific conditions based on volume trends. It displays arrows above the volume bars to indicate potential bullish or bearish market conditions.
#### **Key Features:**
1. **Volume Bars**:
- The indicator plots volume as columns on the chart.
- Volume bars are colored:
- **White** for bullish volume (when the closing price is higher than the opening price).
- **Blue** for bearish volume (when the closing price is lower than the opening price).
2. **Highlight Conditions**:
- The indicator identifies a sequence of three consecutive volume bars:
- The first two bars must be of the same direction (either both bullish or both bearish).
- The third bar must be of the opposite direction.
- Additionally, the third bar's volume must be greater than the previous bar's volume.
3. **Arrow Indicators**:
- When the highlight conditions are met:
- An **upward arrow** ("▲") is placed above the third volume bar for bullish conditions (when the third bar is bullish).
- A **downward arrow** ("▼") is placed above the third volume bar for bearish conditions (when the third bar is bearish).
- The arrows are colored to match the respective volume bar: white for bullish and blue for bearish.
4. **Adjustable Size**:
- The arrows are sized appropriately to ensure visibility without cluttering the chart.
#### **Use Cases:**
- This indicator can help traders identify potential reversals or continuation patterns based on volume behavior.
- It is particularly useful for traders focusing on volume analysis to confirm market trends and make informed trading decisions.
#### **Customization:**
- Users can modify the conditions and visual attributes according to their preferences, such as changing colors, sizes, and label positions.
### **Conclusion:**
The "Custom Volume with Arrow Highlight" indicator provides a straightforward and effective way to visualize volume trends and identify key market conditions, aiding traders in their decision-making processes. It combines the power of volume analysis with clear visual cues, making it a valuable tool for technical analysis in trading.
If you need any further modifications or details, let me know!
Delivery & Price Increase IndicatorThis indicator for TradingView identifies potential buying opportunities by plotting an arrow when two conditions are met: current day's delivery volume exceeds the average delivery volume of the last 5 days, and current day's price is higher than the previous day's price. The script calculates daily delivery volume as a proportion of trading volume, averages it over a user-defined period (default 5 days), and checks for price increases. When both conditions are true, an arrow is plotted, signaling a potential buy signal. The average delivery volume can also be plotted for visual reference. This indicator helps traders capitalize on increasing delivery volume and price momentum.

Long Short MomentumThis indicator is designed to visualize short-term and long-term momentum trends.The indicator calculates two momentum lines based on customizable lengths: a short momentum (Short Momentum) over a smaller period and a long momentum (Long Momentum) over a longer period. These lines are plotted relative to the chosen price source, typically the closing price.
The histogram, colored dynamically based on momentum direction, gives visual cues:
Green: Both short and long momentum are positive, indicating an upward trend.
Red: Both are negative, indicating a downward trend.
Gray: Mixed momentum, suggesting potential trend indecision.

Low Price VolatilityI highlighted periods of low price volatility in the Nikkei 225 futures trading.

ROCnRollThe ROCnRoll indicator can be used on any asset and aims to generate bullish or bearish signals based on market trends, assisting investors in making buy or sell decisions.
This technical indicator combines two well-known and complementary indicators:
The Rate of Change (ROC)
The Exponential Moving Average (EMA)
With these two tools, the ROCnRoll indicator accurately, precisely, and flexibly reflects the volatility of the analyzed asset prices.

Eddie Scanning AssistanceIt’s rare that I have time to watch Eddie’s live sweeps during the typhoon holiday. Inspired by netizens’ questions, I made this Eddie sweeps auxiliary indicator. I hope it can help beginners who are not familiar with sweeps.

Previous Day Breakout Strategy with Stochastic RSI ExitTake when the sell or buy signal is generated. Once taken watch Stoch RSI for K & to reach 80. ONce it reaches 80 .Exit the trade. put a stop low of previous candle high or low based on the trade side

Bollinger Bands & 9 EMA CrossIndicators used
BB - 20 MA
EMA - 9
The indicator gives a signal when EMA 9 crossed above or below to BB's 20 MA.

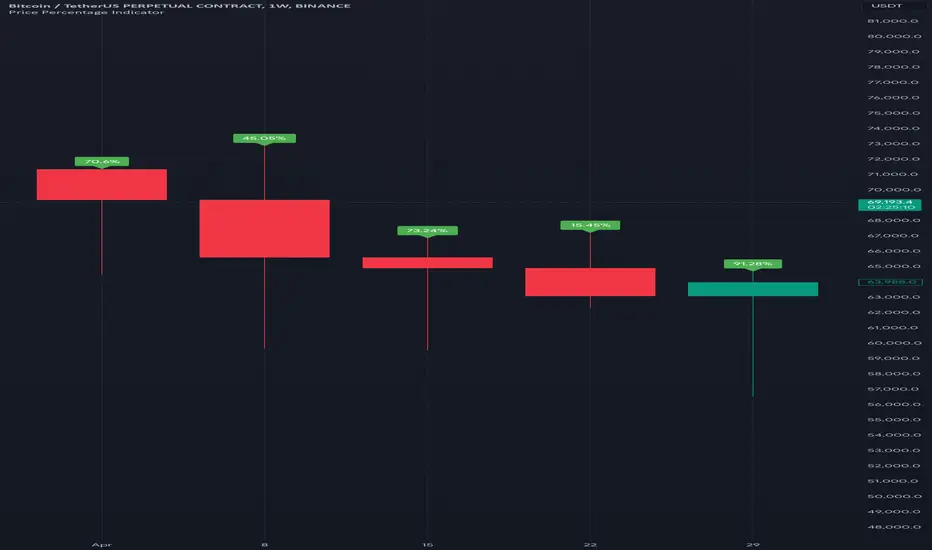
Price Percentage IndicatorPrice Percent for every candle. It shows percent above every candle. Shadows included
Trend Following Indicator MA NARESHMoving Averages: This script calculates a fast and a slow simple moving average (SMA).
Buy/Sell Signals: A buy signal is generated when the fast MA crosses above the slow MA, and a sell signal is created when it crosses below.
Visuals: The moving averages and signals are plotted on the chart, with buy signals marked below the bars and sell signals above.
Alerts: Alerts are set for both buy and sell signals.
You can adjust the fastLength and slowLength parameters to fit your trading strategy. Let me know if you need any modifications or additional features!

Ido strategy RSI Oversold with MACD Buy Signal Indicator
This indicator combines the Relative Strength Index (RSI) and the Moving Average Convergence Divergence (MACD) to help identify potential buy signals based on oversold conditions and trend reversals. This script is designed for traders looking to identify entry points when an asset is likely undervalued (oversold) and showing bullish momentum.
How It Works
RSI Oversold Detection: The RSI measures the speed and change of price movements. This indicator flags when the RSI falls below 30, signaling that the asset may be oversold. The user can customize the RSI lookback period and the timeframe within which oversold conditions are considered relevant.
MACD Crossover: The MACD line crossing above the Signal line often indicates a shift to bullish momentum. In this script, a buy signal is generated when a MACD bullish crossover occurs after an RSI oversold condition has been met within a user-defined lookback window.
Buy Signal: A green triangle appears below the price chart each time both conditions are met—when the RSI has recently been in oversold territory and the MACD line crosses above the Signal line. This signal suggests that the asset may be positioned for a potential upward trend, providing a visual cue for entry points.
Customizable Settings
RSI Settings: Adjust the RSI source and period length.
MACD Settings: Customize the fast, slow, and signal lengths of the MACD to suit different market conditions.
Lookback Period: Define how many bars back to check for an RSI oversold condition before confirming a MACD crossover.
Visual Elements
Oversold Background Color: The background on the price chart is shaded red whenever the RSI is below 30.
Buy Signal: A green triangle is displayed on the chart to indicate a potential entry point when both conditions are met.
Alerts
This indicator includes optional alerts, allowing traders to receive notifications whenever the conditions for a buy signal are met, making it easier to monitor multiple assets and stay informed of trading opportunities.
This indicator is ideal for traders using a combination of momentum and trend reversal strategies, especially in volatile markets where oversold conditions often precede a trend change.

EMA 20/50/100/150/200 BUY SELLBu kod, belirli periyotlarda Üstel Hareketli Ortalama (EMA) çizgilerini hesaplar ve fiyatın bu çizgilerin üzerinde mi yoksa altında mı olduğunu belirler.
Fiyat, EMA çizgisinin üzerindeyse, çizgi yeşi l renkte gösterilir; altındaysa, kırmızı renkte gösterilir.
Bu gösterge, yatırımcıların fiyat hareketlerini daha kolay analiz etmelerine yardımcı olur ve trend değişimlerini görsel olarak daha net bir şekilde belirlemelerini sağlar. Grafikte fiyatın EMA çizgilerinin üzerinde mi yoksa altında mı olduğunu hızlıca fark edebilirler.

Blue Sniper Binary Options Alerts**Description:**
The *Blue Sniper Strategy* is a trend-following trading script designed to help traders identify and act on high-confidence trade entries in trending markets. By combining the 50 and 200 Exponential Moving Averages (EMAs) with a custom configuration of UT Bot alerts, this script provides a structured approach to trend detection and precise entry timing. The strategy uses multiple layers of analysis to filter out false signals and aim for trades aligned with the prevailing market direction.
**Underlying Methodology and Concept:**
The *Blue Sniper Strategy* is specifically designed for markets with clear directional trends. To achieve this, it uses a two-part methodology: **trend filtering** through EMAs and **entry precision** through UT Bot alerts.
1. **EMA-Based Trend Filtering**
- The 50 and 200 EMAs are used as dynamic indicators of trend direction. The 50 EMA, being shorter-term, captures recent price movements, while the 200 EMA reflects longer-term market sentiment.
- Together, these EMAs establish a directional filter:
- When the 50 EMA is above the 200 EMA, it signals an uptrend.
- When the 50 EMA is below the 200 EMA, it signals a downtrend.
- This alignment helps the strategy confirm trend direction, avoiding entries in weak or choppy trends. Only when the price and EMAs confirm a strong trend does the strategy trigger signals.
2. **UT Bot Alert Precision**
- The UT Bot alerts are configured to detect price action within the established trend, identifying entry points based on momentum. The alerts monitor price for moments when it aligns with the trend’s direction and shows signs of continuation, helping to avoid entry during consolidation or excessive volatility.
- These alerts offer a “second layer” of confirmation, so only setups that satisfy both the EMA trend filter and UT Bot momentum criteria will generate signals, reducing the likelihood of false or poorly timed entries.
**Key Features and Benefits:**
1. **Trend-Focused Structure**
- This strategy is optimized for trending markets. By filtering for strong trends using EMAs, it reduces entry signals during range-bound or erratic conditions. It’s particularly suitable for assets like Forex pairs and other volatile markets where trends are often more pronounced.
2. **Precision Alerts for Entries**
- The UT Bot alerts are fine-tuned for entry precision within the trend. By scanning for momentum-driven price levels, they aim to provide timely entries in alignment with the larger trend. The alerts avoid periods of low volatility or extreme price swings, instead focusing on “sweet spots” where momentum is most likely to follow through.
3. **Versatility in Application**
- While initially designed for Forex pairs, the *Blue Sniper Strategy* adapts well to various markets, including commodities, indices, and crypto. It is also suitable for multiple trading styles:
- **Scalping**: The quick responsiveness of the UT Bot makes it practical for short-term trades within a trend.
- **Day Trading and Swing Trading**: The trend confirmation from the 50 and 200 EMAs supports longer-term entries in established trends.
**How to Use the *Blue Sniper Strategy*:**
1. **Assess Market Conditions Beforehand**
- This strategy is ideal for trending markets. Start by analyzing whether the asset is currently trending, as the script is not optimized for range-bound or highly volatile environments. Checking market structure beforehand helps ensure more reliable signals.
2. **Trend Confirmation with EMAs**
- Ensure alignment with the EMAs before considering an alert:
- **For Buy Signals**: Price should be above both the 50 and 200 EMAs, with the 50 EMA above the 200 EMA. This indicates a solid uptrend.
- **For Sell Signals**: Price should be below both EMAs, with the 50 EMA below the 200 EMA, confirming a downtrend.
- These conditions provide a foundational trend direction, reinforcing that any subsequent alert from the UT Bot aligns with a larger trend movement.
3. **Follow Alerts Mindfully**
- Each alert signals an optimal entry point within the trend, but traders should validate it with overall trend analysis and market conditions. The strategy is designed to highlight high-probability entries, but success will vary with changing market dynamics. Alerts are best used as guidance rather than guarantees.
**Realistic Expectations:**
While this strategy is structured to filter for high-confidence trade setups, it does not guarantee any specific win rate or future performance. Market conditions vary, and like any trading approach, results will depend on broader market factors, trader discretion, and effective risk management. This script does not claim to have a predetermined success rate but aims to improve decision-making by focusing on trends and precise entries.
**Originality and Unique Value:**
The *Blue Sniper Strategy* brings together trend and momentum indicators in a layered, cohesive approach rather than a simple indicator mashup. Each component—EMA trend filtering and UT Bot momentum alerts—serves a distinct purpose, working together to provide reliable signals in trending markets. The script is designed to streamline complex analysis, making it accessible for traders with varying levels of experience, especially those less familiar with Pine Script.
This strategy focuses on offering traders a structured approach that enhances trend and momentum alignment, making it a useful tool for precise, trend-following trades.

기간별 최고점/최저점/중간점 박스 표시 및 매수 신호코드 설명
기존 기능 유지:a
최고점, 최저점, 중간점을 라인으로 표시합니다.
박스를 사용하여 지정된 기간 동안의 최고점과 최저점을 시각화합니다.
매수 조건 추가:
wma120: 120일 가중 이동 평균선을 계산합니다.
macdLine: MACD 라인을 계산하여 0보다 큰지를 확인합니다.
cci: CCI(Commodity Channel Index)를 계산하여 100 이상인지 확인합니다.
rsi: RSI(Relative Strength Index)를 계산하여 50 이상인지 확인합니다.
매수 신호 박스:
buySignal 조건이 충족되면 buyBox라는 녹색 박스를 생성하여 매수 시점을 시각적으로 표시합니다.
plotshape를 사용하여 매수 신호가 발생한 곳에 "매수"라는 텍스트를 표시합니다.
이 코드를 사용하면 설정된 매수 조건을 만족할 때마다 차트에 녹색 박스와 함께 매수 신호가 표시됩니다.

Jackson Volume breaker Indication# Jackson Volume Breaker Beta
### Advanced Volume Analysis Indicator
## Description
The Jackson Volume Breaker Beta is a sophisticated volume analysis tool that helps traders identify buying and selling pressure by analyzing price action and volume distribution. This indicator separates and visualizes buying and selling volume based on where the price closes within each candle's range, providing clear insights into market participation and potential trend strength.
## Key Features
1. **Smart Volume Distribution**
- Automatically separates buying and selling volume
- Color-coded volume bars (Green for buying, Red for selling)
- Winning volume always displayed on top for quick visual reference
2. **Real-time Volume Analysis**
- Shows current candle's buy/sell ratio
- Displays total volume with smart number formatting (K, M, B)
- Percentage-based volume distribution
3. **Technical Overlays**
- 20-period Volume Moving Average
- Dynamic scaling relative to price action
- Clean, uncluttered visual design
## How to Use
### Installation
1. Add the indicator to your chart
2. Adjust the Volume Scale input based on your preference (default: 0.08)
3. Toggle the Moving Average display if desired
### Reading the Indicator
#### Volume Bars
- **Green Bars**: Represent buying volume
- **Red Bars**: Represent selling volume
- **Stacking**: The larger volume (winning side) is always displayed on top
- **Height**: Relative to the actual volume, scaled for chart visibility
#### Information Table
The top-right table shows three key pieces of information:
1. **Left Percentage**: Winning side's volume percentage
2. **Middle Percentage**: Losing side's volume percentage
3. **Right Number**: Total volume (abbreviated)
### Trading Applications
1. **Trend Confirmation**
- Strong buying volume in uptrends confirms bullish pressure
- High selling volume in downtrends confirms bearish pressure
- Volume divergence from price can signal potential reversals
2. **Support/Resistance Breaks**
- High volume on breakouts suggests stronger moves
- Low volume on breaks might indicate false breakouts
- Monitor volume distribution for break direction confirmation
3. **Reversal Identification**
- Volume shift from selling to buying can signal potential bottoms
- Shift from buying to selling can indicate potential tops
- Use with price action for better entry/exit points
## Input Parameters
1. **Volume Scale (0.01 to 1.0)**
- Controls the height of volume bars
- Default: 0.08
- Adjust based on your chart size and preference
2. **Show MA (True/False)**
- Toggles 20-period volume moving average
- Useful for identifying volume trends
- Default: True
3. **MA Length (1+)**
- Changes the moving average period
- Default: 20
- Higher values for longer-term volume trends
## Best Practices
1. **Multiple Timeframe Analysis**
- Compare volume patterns across different timeframes
- Look for volume convergence/divergence
- Use higher timeframes for major trend confirmation
2. **Combine with Other Indicators**
- Price action patterns
- Support/resistance levels
- Momentum indicators
- Trend indicators
3. **Volume Pattern Recognition**
- Monitor for unusual volume spikes
- Watch for volume climax patterns
- Identify volume dry-ups
## Tips for Optimization
1. Adjust the Volume Scale based on your chart size
2. Use smaller timeframes for detailed volume analysis
3. Compare current volume bars to historical patterns
4. Watch for volume/price divergences
5. Monitor volume distribution changes near key price levels
## Note
This indicator works best when combined with proper price action analysis and risk management strategies. It should not be used as a standalone trading system but rather as part of a comprehensive trading approach.
## Version History
- Beta Release: Initial public version
- Features buy/sell volume separation, moving average, and real-time analysis
- Optimized for both intraday and swing trading timeframes
## Credits
Developed by Jackson based on other script creators
Special thanks to the trading community for feedback and suggestions
*random37* Al-Sat İndikatörüAl-Sat noktalarının gösterildiği, karma indikatörlerden oluşan ve uyulduğunda %90 kazanç getiren özel bir indikatör kodlamasıdır.
It is a special indicator coding consisting of mixed indicators and making 90 %profit when followed. Buy and sell shows.

PDV CheckCheca a posição do preço em relação as medias de 21 e 120 exponenciais e 200 simples, mostrando se está acima ou abaixo delas no tempo gráfico selecionado

Blue Sniper Binary Options Alerts**Description:**
The *Blue Sniper Strategy* is a trend-following trading script designed to help traders identify and act on high-confidence trade entries in trending markets. By combining the 50 and 200 Exponential Moving Averages (EMAs) with a custom configuration of UT Bot alerts, this script provides a structured approach to trend detection and precise entry timing. The strategy uses multiple layers of analysis to filter out false signals and aim for trades aligned with the prevailing market direction.
**Underlying Methodology and Concept:**
The *Blue Sniper Strategy* is specifically designed for markets with clear directional trends. To achieve this, it uses a two-part methodology: **trend filtering** through EMAs and **entry precision** through UT Bot alerts.
1. **EMA-Based Trend Filtering**
- The 50 and 200 EMAs are used as dynamic indicators of trend direction. The 50 EMA, being shorter-term, captures recent price movements, while the 200 EMA reflects longer-term market sentiment.
- Together, these EMAs establish a directional filter:
- When the 50 EMA is above the 200 EMA, it signals an uptrend.
- When the 50 EMA is below the 200 EMA, it signals a downtrend.
- This alignment helps the strategy confirm trend direction, avoiding entries in weak or choppy trends. Only when the price and EMAs confirm a strong trend does the strategy trigger signals.
2. **UT Bot Alert Precision**
- The UT Bot alerts are configured to detect price action within the established trend, identifying entry points based on momentum. The alerts monitor price for moments when it aligns with the trend’s direction and shows signs of continuation, helping to avoid entry during consolidation or excessive volatility.
- These alerts offer a “second layer” of confirmation, so only setups that satisfy both the EMA trend filter and UT Bot momentum criteria will generate signals, reducing the likelihood of false or poorly timed entries.
**Key Features and Benefits:**
1. **Trend-Focused Structure**
- This strategy is optimized for trending markets. By filtering for strong trends using EMAs, it reduces entry signals during range-bound or erratic conditions. It’s particularly suitable for assets like Forex pairs and other volatile markets where trends are often more pronounced.
2. **Precision Alerts for Entries**
- The UT Bot alerts are fine-tuned for entry precision within the trend. By scanning for momentum-driven price levels, they aim to provide timely entries in alignment with the larger trend. The alerts avoid periods of low volatility or extreme price swings, instead focusing on “sweet spots” where momentum is most likely to follow through.
3. **Versatility in Application**
- While initially designed for Forex pairs, the *Blue Sniper Strategy* adapts well to various markets, including commodities, indices, and crypto. It is also suitable for multiple trading styles:
- **Scalping**: The quick responsiveness of the UT Bot makes it practical for short-term trades within a trend.
- **Day Trading and Swing Trading**: The trend confirmation from the 50 and 200 EMAs supports longer-term entries in established trends.
**How to Use the *Blue Sniper Strategy*:**
1. **Assess Market Conditions Beforehand**
- This strategy is ideal for trending markets. Start by analyzing whether the asset is currently trending, as the script is not optimized for range-bound or highly volatile environments. Checking market structure beforehand helps ensure more reliable signals.
2. **Trend Confirmation with EMAs**
- Ensure alignment with the EMAs before considering an alert:
- **For Buy Signals**: Price should be above both the 50 and 200 EMAs, with the 50 EMA above the 200 EMA. This indicates a solid uptrend.
- **For Sell Signals**: Price should be below both EMAs, with the 50 EMA below the 200 EMA, confirming a downtrend.
- These conditions provide a foundational trend direction, reinforcing that any subsequent alert from the UT Bot aligns with a larger trend movement.
3. **Follow Alerts Mindfully**
- Each alert signals an optimal entry point within the trend, but traders should validate it with overall trend analysis and market conditions. The strategy is designed to highlight high-probability entries, but success will vary with changing market dynamics. Alerts are best used as guidance rather than guarantees.
**Realistic Expectations:**
While this strategy is structured to filter for high-confidence trade setups, it does not guarantee any specific win rate or future performance. Market conditions vary, and like any trading approach, results will depend on broader market factors, trader discretion, and effective risk management. This script does not claim to have a predetermined success rate but aims to improve decision-making by focusing on trends and precise entries.
**Originality and Unique Value:**
The *Blue Sniper Strategy* brings together trend and momentum indicators in a layered, cohesive approach rather than a simple indicator mashup. Each component—EMA trend filtering and UT Bot momentum alerts—serves a distinct purpose, working together to provide reliable signals in trending markets. The script is designed to streamline complex analysis, making it accessible for traders with varying levels of experience, especially those less familiar with Pine Script.
This strategy focuses on offering traders a structured approach that enhances trend and momentum alignment, making it a useful tool for precise, trend-following trades.

BB + SMA120Custom Bollinger Band with SMA Alert Indicator
This script is a customized Bollinger Band indicator with added alerts based on specific conditions related to a 120-period Simple Moving Average (SMA). This indicator is designed for traders who want to receive alerts when certain interactions occur between the Bollinger Bands and the SMA levels, providing potentially valuable signals in trend-following or mean-reversion strategies.
Key Features:
Bollinger Bands Calculation:
The script calculates a standard 25-period Bollinger Band using a customizable standard deviation. The bands consist of an upper, middle (basis), and lower line, allowing traders to observe volatility and potential support/resistance levels.
120 SMA High and Low Levels:
A 120-period SMA of high and low prices is added to the chart, providing a reference for longer-term trend direction and creating a range within which the Bollinger Bands can be evaluated.
Conditional Alerts:
Scenario 1: An alert is triggered when the Bollinger Bands remain above the 120 SMA high and low, and the price taps the lower Bollinger Band. This can be useful for spotting potential buy entries in an uptrend when prices retrace to the lower band.
Scenario 2: An alert is triggered when the Bollinger Bands remain below the 120 SMA high and low, and the price taps the upper Bollinger Band. This may help identify potential sell entries in a downtrend when prices retrace to the upper band.
Visual Aids:
The 120 SMA high and low lines are plotted on the chart with color fills, making it easy to visualize the trend and range boundaries.
Color-coded Bollinger Bands help highlight potential areas of interest based on volatility.
How to Use:
Add this indicator to your chart, configure the Bollinger Band length, and set your alert preferences. Alerts can be managed through TradingView's alert panel, where you can select the scenarios based on price interaction with the bands.
Recommended Use:
This indicator can be helpful for price action traders and mean-reversion strategies in Forex, stocks, and other markets where Bollinger Bands and moving averages are used.
Alerts may provide early signals for potential trade setups, although further confirmation and analysis are advised before entry.

only 200-40ema.....Gotta just check the resultsGoing long when the price crosses 200ema and close when the price goes below 40 ema.Just to test the outcomes.
