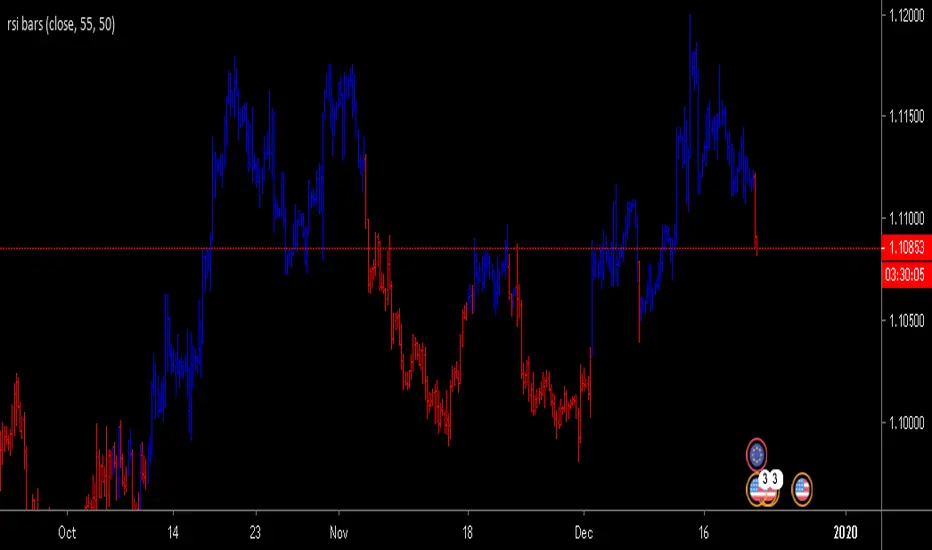
RSI bars chartShows RSI over-bought /over-sold conditions with specific bar-color on main chart.
All inputs such as color, RSI value & level are modifiable by users.
Overbought
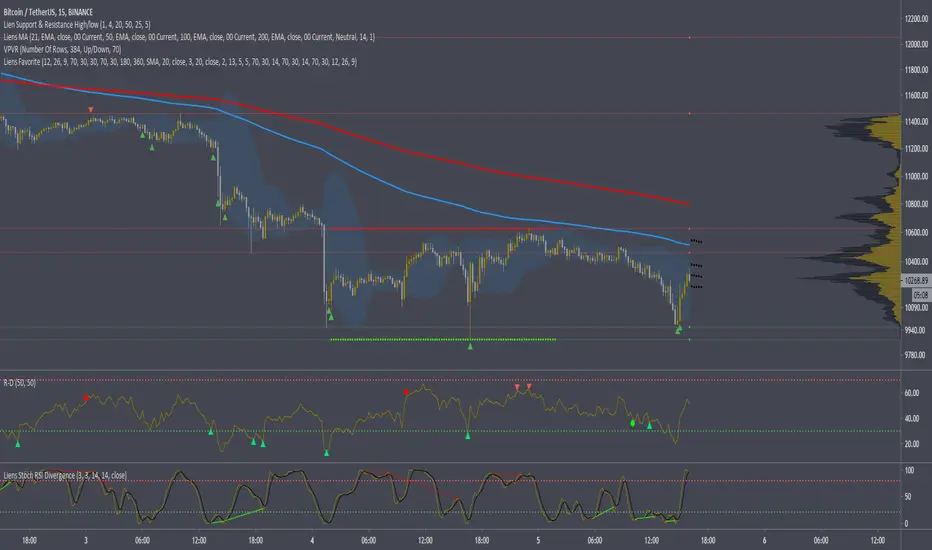
Liens FavoriteMy favorite scripts togheter.
1. Long / M/S-R.Trend changing direction. This is best on higher tf, but can be used on lower aswell. It gives signals when stochastic is overbought/oversold and the macd is crossing the 0 line.
2. This script got 2 ema lines ( Buy/Sell crosses )
3. MA line that changes color. Options - SMA", "EMA", "WMA", "VWMA", "SMMA", "DEMA", "TEMA", "HullMA", "ZEMA", "TMA", "SSMA". Sometimes i use this(ma) insdead of the bb center line.
4. Standar Bollinger bands with buy and sell signals - also added a function so buy and sell signals only show when stochastic is overbought/oversold for less false signals.
5. Stochastic Oversold/overbought on chart.
6. Macd Bearish and bullish crosses on chart.
Alerts for all functions.
[astropark] Super Stochastic RSI [alarms]Dear Followers,
today a new Scalper Tool , which works great on 3 minutes and 5 minutes timeframes !
I called it " Super Stochastic RSI ", as it is based on StochRSI and inherits some basic functionality from it.
If you check its settings, you will see that you can have 3 different buy-sell sources (first two are active by default):
STRONG BUY/SELL : buy when green area deeply falls into oversold zone and sell when red area gets into overbought zone (you can set and edit at which level oversold and overbought zones start);
K/D CROSSES : buy when k-line cross above d-line and sell viceversa (you can set and edit specific cross ranges for both buy and sell);
WEAK BUY/SELL : buy when green area at least go below 50 level and sell when red area at least goes above 50 level (you can edit both levels); these conditions are highlighted as background color and are very useful for taking (at least partial) profits in trades.
By default the script will be placed as overlay on the chart, but
> you can activate the oscillator plot by disabling the "hide all plot" option
> and place it in a below pane by clicking on the black arrow at then end on the indicator name in chart and selecting "move to -> a new pane below"
This strategy can trigger till 10 buy or 10 sell signals in a row before reverting, so use a proper money management .
Strategy results are calculated on 20 trading days using 1000$ as initial capital and working at 10x leverage.
The user who wants to use this strategy, especially via an automated bot, must always set a stoploss at 3-5% from entry point or use a proper risk management strategy .
This is not the "Holy Grail", so use it with caution.
This script will let you set all notifications you may need in order to be alerted on each triggered signals.
The backtesting script version of this indicator, which will let you backtest this script and find best settings for your preferred market, can be found here below:
This is a premium indicator , so send me a private message in order to get access to this script .

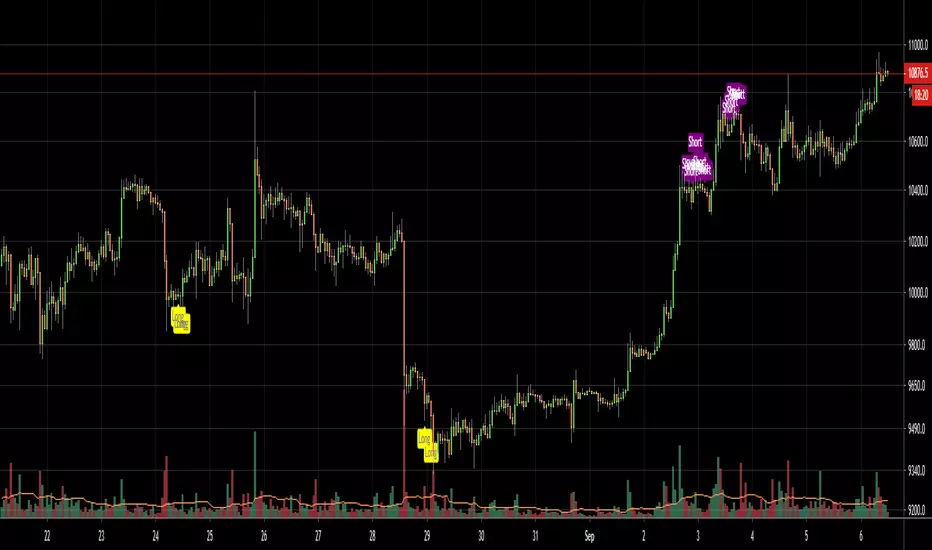
[astropark] Super Stochastic RSI [strategy]Dear Followers,
today a new Scalper Tool , which works great on 3 minutes and 5 minutes timeframes !
I called it " Super Stochastic RSI ", as it is based on StochRSI and inherits some basic functionality from it.
If you check its settings, you will see that you can have 3 different buy-sell sources (first two are active by default):
STRONG BUY/SELL : buy when green area deeply falls into oversold zone and sell when red area gets into overbought zone (you can set and edit at which level oversold and overbought zones start);
K/D CROSSES : buy when k-line cross above d-line and sell viceversa (you can set and edit specific cross ranges for both buy and sell);
WEAK BUY/SELL : buy when green area at least go below 50 level and sell when red area at least goes above 50 level (you can edit both levels); these conditions are highlighted as background color and are very useful for taking (at least partial) profits in trades.
By default the script will be placed as oscillator on a specific pane below the chart, but
> you can disable the oscillator plot by enabling the "hide all plot" option
> and place it as overlay on chart by clicking on the black arrow at then end on the indicator name in chart and selecting "move to -> existing pane above"
This strategy can trigger till 10 buy or 10 sell signals in a row before reverting, so use a proper money management .
Strategy results are calculated on 20 trading days using 1000$ as initial capital and working at 10x leverage.
The user who wants to use this strategy, especially via an automated bot, must always set a stoploss at 3-5% from entry point or use a proper risk management strategy .
This is not the "Holy Grail", so use it with caution.
This script will let you backtest the strategy and find best settings for your preferred market.
The alarms script version of this indicator, which will let you set all notifications you may need in order to be alerted on each triggered signals, can be found here below:
This is a premium indicator , so send me a private message in order to get access to this script .

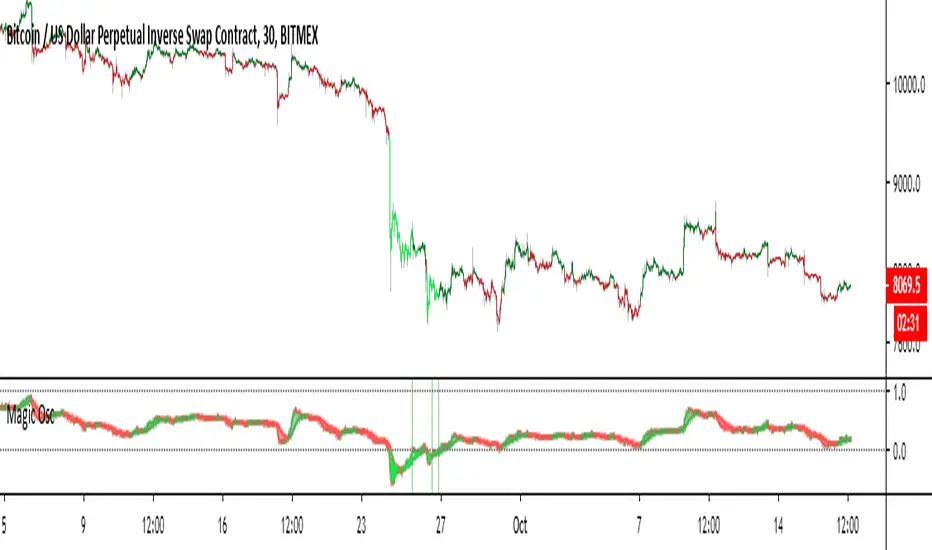
Magical Onion Oscillator V1This script is a oscillator that has many features. It is designed to give infrequent but super high quality signals. The basic concept is that when the fast line goes over 1, price is overbought, and when the fast line dips below 0, price is oversold. This is reflected by both the fill color on the oscillator, and by coloring the bars. When the area between the two lines is green, the trend is up, and when the fill color is red, the trend is down. The trend feature is not the primary use for this oscillator, the overbought/oversold signals are much more powerful.
Signals
When the bars are colored bright red or green, that means the price is overbought/oversold.
When the fill color is green, the trend is up. When the fill color is red, the trend is down.
Entry signals are given by the vertical green or red stripes in the oscillator window.
Settings
Timeframes 1-4 These settings are to change the time frames the oscillator uses to do calculations. The defaults should work fine for most time frames, but I allow you to modify these for extremely small or large timeframes. The input needs to be a multiplied minute, day, week, or month. For example if you would like to use this on the 1min chart, a possible setup could be 60,240,720,D. This would correspond to 1hr, 4hr, 12hr, D. If you wanted to use it on a larger timeframe like the daily, you could use M,2M,3M,4M. Which would mean 1,2,3,4 months. The default timeframes are very good for the charts in the range of 30min to 4hr.
Fast Length This is the smoothing factor for the fast line. The default is recommended, but you are free to customize as needed. Note that a higher value here will decrease the amount of signals.
Slow Length This is the smoothing factor for the slow length. It will work similarly to the short length, smaller values will increase signal frequency, but also make the trend signal choppier.
Adjustment Lag Turning this value down will cause the indicator to remain oversold and overbought for shorter periods. This will decrease the amount of signals. Turning it up will have the opposite effect.
Color Bars Toggling this turns on and off the bar coloring.
Color Lines According to Trend Toggling this option colors the oscillator lines according to the trend direction.
Please send me a message or leave a comment if you have any questions, good luck.
Modified Stochastic MACD Oscillator - Vitali ApirineFor all MACD enthusiasts out there, hot off the press, I present this next generation "Modified Stochastic MACD Oscillator" employing PSv4.0, originally formulated by Vitali Apirine for TASC - November 2019 Traders Tips. Just when you may have thought it was the end of the evolutionary line for MACD technology, it's not! Basically it's a NEW hybridization of a MACD and stochastic rolled into one, maintaining scale symmetry to support overbought/oversold defined levels across time frames and assets, unlike the ordinary MACD. On the ordinary MACD, this is virtually impossible to do properly, and trust me, I have tried with zero success. My less than 40 line implementation, at initial release, is a heavily modified version of the original indicator using novel techniques, surpassing not only Apirine's original intended design, but also the "contemporary MACD" provided by TV, visible on the bottom of the chart.
Utilizing the "Power of Pine", I included the maximum amount of features I could surmise in an ultra small yet powerful package. I provided an abundance of control over each feature as an attempt to create another heavenly MACD experience in an open source package, only rivaled by my "Ultimate MACD Super Pack". Configurations are displayed above in multiple scenarios that should be suitable for most traders. Of notable mention, I rescaled the oscillator more towards a zero mean unity scale, while still leaving the waveforms completely intact.
Features List Includes:
Dark Background - Easily disabled in indicator Settings->Style for "Light" charts or with Pine commenting
AND much, much more... you have the source!
For those of you who are new to Pine Script, this script also may help you understand advanced programming techniques in Pine and how they may be utilized in a most effective manner. I would like to see Tradingview become the go to platform for the best MACD indicators attainable with this contribution to the TV community. This is commonly what my dense intricate code looks like behind the veil, and if you are wondering why there is no notes, that's because the notation is in the variable naming. If you wish to contribute additional ideas, please do so below in the comments about all things MACD in Pine.
NOTICE: Copy pasting bandits who may be having nefarious thoughts, DO NOT attempt this, because this may violate Tradingview's terms, conditions and/or house rules. "WE" are always watching the TV community vigilantly for mischievous behaviors and actions that exploit well intended authors for the purpose of unscrupulously increasing brownie points in reputation scores. Hiding behind a "protected" wall may not protect you from investigation and account penalization by TV staff. Be respectful, and don't just throw a meaningless feature in there branding it as "your" gizmo. Fair enough? Alrighty then... I firmly believe in "innovating" future state-of-the-art indicators, and please contact me if you wish to do so.
The comments section below is solely just for commenting and other remarks, ideas, compliments, etc... regarding only this indicator, not others. When available time provides itself, I will consider your inquiries, thoughts, and concepts presented below in the comments section if you do have any questions or comments regarding this indicator. When my indicators achieve more prevalent use by TV members, I may implement more ideas when they present themselves as worthy additions. As always, "Like" it if you simply just like it with a proper thumbs up, and also return to my scripts list occasionally for additional postings. Have a profitable future everyone!

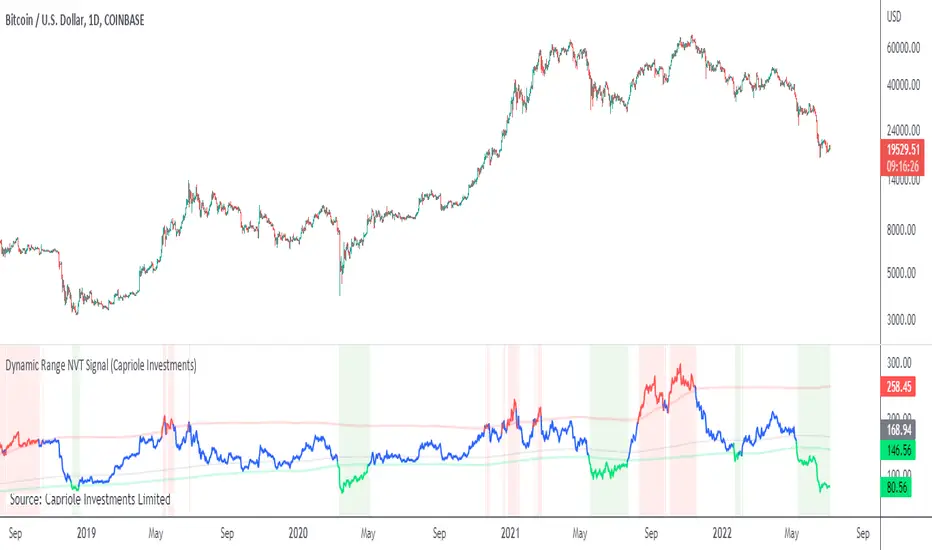
Dynamic Range NVT SignalABOUT DYNAMIC RANGE NVT SIGNAL
NVT Signal (Credit: Willy Woo and Dmitry Kalichkin) is akin to a "PE" ratio for Bitcoin , and can be used to identify when Bitcoin is overbought or oversold based on the relative value of transactions sent across the network.
This indicator includes a 2 year moving average and standard deviation to identify outlier values, instead of declaring a static high-low range for relative valuation.
THEORY
A dynamic "high-low" range was chosen for the following reasons:
- Bitcoin is only 10 years old, it is likely that relatively "high" and relatively "low" NVT values will change with time, as have PE ratios over the last century.
- Some transactions are now made off-chain (eg. Liquid Network's private side-chain which is used by many major exchanges). If this trend continues, we can expect "normal" NVT ranges to increase with time (as the relative portion of public on-chain transaction values decreases).
CALCULATION
- NVT = Circulating Market Cap / 90 average On-chain Transaction Value*
- Overbought (default): NVT > 2-year mean + 2*standard deviations. I.e. NVT Signal is in the top 2.5% of values for the prior 2 years.
- Oversold (default) NVT < 2-year mean - 0.5 * standard deviations.**
*Data source: Blockchain.info, estimated transaction value does not include returned to sender as change.
**Oversold under 2-year mean was chosen due to the skewness of NVT Signal, it is not normally distributed. For example: NVT Signal has never been less than the 2-year mean - 2* standard deviations. This may change in the future.
NOTES ON USAGE
- Use with care. Bitcoin can remain "overbought" or "oversold" for extended periods (eg. 2015-2016).
- As Bitcoin ages, the validity of NVT Signal will need to be monitored. Particularly with respect to potentially increasing use of side-chains, private transactions and potentially the lightning network.
- It is likely that a 2-year “look back period” for calculating mean and standard deviation will not be sufficient in the decades to come. As Bitcoin matures and stabilizes (some time in the future), a longer "look back period" should probably be used. To allow for this, the defaults for this indicator can be easily adjusted.
Smoothed RSIThis smoothed RSI indicator is designed to allow users to try and identify periods of extended time in oversold and overbought areas using a smoothed RSI value.
Features:
- RSI
- Period
- Source
- Resolution
- Visibility
- Smoothed RSI
- Period
- Moving Average Type
- Visibility

MS MONEY CCI SQUEEZEAbout
I have used this indicator to find many lucrative opportunities. This indicator takes the moving average of CCI in custom, volatility-specific conditions. CCI measures "overbought" in the red-shaded region and "Oversold" in the green-shaded region. The shaded regions do not constitute a buy/sell signal alone, the MS CCI Squeeze is best used when market conditions agree and is best used when the user has fundamental reasoning for "reversal-like" situations to align. The MS CCI Squeeze will soon have a synergistic partner called "MS RSI Squeeze" indicator that will look similar to help better measure volatility and strength trend.
About the Commodity Channel Index (CCI)
The commodity channel index (CCI) is an oscillator originally introduced by Donald Lambert in 1980. Since its introduction, the indicator has grown in popularity and is now a very common tool for traders in identifying cyclical trends not only in commodities, but also equities (stocks) and currency trading.
How to set an Alert
If the user wants to set an alert , click on one of the support/ resistance lines (black-dashed) near the zero mark. Clicking on the horizontal line above or below the zero line will populate a yellow arrow which will allow you to set alerts when wanted.
Please Read For Better Efficiency
When using this indicator, keep an eye out for harmonic patterns, both bullish and bearish head and shoulders patterns for "HIDDEN" breakout opportunities.
Please like, follow and share and I will continue building better indicators.

How To Use Dynamic ZonesExample of how to apply and use Dynamic Zones with an indicator by injecting it's source into my adaptation of the original idea by Leo Zamansky, Ph.D., and David Stendahl.
• Load your desired oscillating indicator on your chart (CCI, RSI, etc).
• Load my "How To Use Dynamic Zones" indicator on your chart.
• In the "How To Use Dynamic Zones" indicator settings choose your desired oscillating indicator as the Oscillator Source.
You will now have dynamic overbought and oversold levels. I have also included alerts which may be used to indicate when these conditions occur.
If desired you may repeat the above process by loading additional indicators along with additional copies of my indicator to use with each oscillator.
Oscillator Source: CLOSE uses your chosen indicator as a source or you may use price as a source
Sample Length: 70 uses number of previous values for evaluating
Hi is Above X% of Sample: 88 sets overbought zone
Lo is Below X% of Sample: 88 sets oversold zone
The simplest explanation of what these default settings are doing is that they take 70 previous values of your chosen indicator, then create an overbought level that is above 88% of those previous values and an oversold level that is below 88% of those previous values. As new bars form the levels are dynamically reevaluated and updated.
---
"This investing style follows a very simple form of logic: Enter the market only when an oscillator has moved far above or below traditional trading levels. However, these oscillator driven systems lack the ability to evolve with the market because they use fixed buy and sell zones. Traders typically use one set of buy and sell zones for a bull market and substantially different zones for a bear market. And therein lies the problem.
Once traders begin introducing their market opinions into trading equations, by changing the zones, they negate the system’s mechanical nature. The objective is to have a system automatically define its own buy and sell zones and thereby profitably trade in any market — bull or bear. Dynamic zones offer a solution to the problem of fixed buy and sell zones for any oscillator-driven system."
Reference: Stocks & Commodities V15:7 (306-310): Dynamic Zones by Leo Zamansky, Ph.D., and David Stendahl
---
NOTICE: This is an example script and not meant to be used as an actual strategy. By using this script or any portion thereof, you acknowledge that you have read and understood that this is for research purposes only and I am not responsible for any financial losses you may incur by using this script!

AEONDRIFT-KThis is a special edition of the AEONDRIFT Band that is implemented in my Strategies , which have substantially boosted their profitability.
Squeeze Zone = Increase chance for a big move to happen. I used this to decrease (buy/sell) trading thresholds in my strategy scripts to increase the chances of making a trade.
No Trading Zone = Increase chances for bad trades due to difficulty for indicators to . As the name implies, I used this to disable trading completely during this period.
Alerts are enabled for these states.
~ * ~ * ~ * ~ * ~ * ~ * ~ * ~ * ~ * ~ * ~ * ~ * ~ * ~ * ~ * ~ * ~ * ~ * ~ * ~ * ~
Note:
In no way is this intended as a financial/investment/trading advice. You are responsible for your own investment decisions and trades.
Please exercise your own judgement for your own trades base on your own risk-aversion level and goals as an investor or a trader. The use of OTHER indicators and analysis in conjunction (tailored to your own style of investing/trading) will help improve confidence of your analysis, for you to determine your own trade decisions.
~ * ~ * ~ * ~ * ~ * ~ * ~ * ~ * ~ * ~ * ~ * ~ * ~ * ~ * ~ * ~ * ~ * ~ * ~ * ~ * ~
Please check out my other indicators sets and series, e.g.
LIVIDITIUM (dynamic levels),
AEONDRIFT (multi-levels standard deviation bands),
FUSIONGAPS (MA based oscillators),
MAJESTIC (Momentum/Acceleration/Jerk Oscillators),
PRISM (pSAR based oscillator, with RSI/StochRSI as well as Momentum/Acceleration/Jerk indicators),
PDF (parabolic SAR /w HighLow Trends Indicator/Bar-color-marking + Dynamic Fib Retrace and Extension Level)
and more to come.
Constructive feedback and suggestions are welcome.
~ JuniAiko
(=^~^=)v~
AEONDRIFT
Strategy Scripts:
Cyber Momentum Strategy
Cyber Ensemble Strategy
See Also: Relative Candle Volatility & Directionality Index (RCVI and RCDI)

Function : Stochastic Oscillator Here is the Stochastic Oscillator function.
Now you can easily use length with mutable variables !!

Function : Relative Strength Index The relative strength index function is defined.
Now you can easily use length with mutable variables !!

Stochastic [Gu5]To know if we are in range, I recommend my other indicator "Trend Channel Gu5"
Stochastic shows overbought / oversold
--
Para saber cuando no hay tendencia y estamos en rango, recomiendo usar mi indicador "Trend Channel Gu5"
El cruce de K & D nos muestra cundo el mercado esta en sobre-compra o sobre-venta
Las alertas con banderas ayudan a visualizar mas claramente, evitando las alertas duplicadas

Money Flow Index Extreme Condition + MACDCombine the signal of extreme condition of Money Flow Index and MACD
RSI_EMA_FlashesCombination of Chris Moody's RSI + EMA with the background flashes from the Ultimate MTF RSI. Made by request.
Elgrand - Overbought/sold Rsi + Stochastic zonesVisualize on your chart when price in an oversold or overbought zone. A combination of Rsi and Stochasticrsi is used for higher probability. Wait for an zone to be displayed and then wait for price to exit a zone. Once this happens check candlestick patterns and support/resistance "lines" to find appropiate stoplosses for you entry or exit
Elgrand - Overbought Rsi and StochRsi on multiple timeframesScript to visualize the overbought and oversold condition on multiple timeframes. Good way to determine when you have a lower risk for enter a trade or to determine when you need to be on the lookout to sell.


Function StochRSI Stochastic Relative Strength Index developed by Tushar Chande and Stanley Kroll.
This script has been written to eliminate the period variable.(Integer)
Thus, it can be used comfortably in adaptive period scripts ! (For example : Adaptive Moving Average , KAMA , FAMA .. etc. )
All efforts goes to ChaosTrader () ,
RicardoSantos () ,
Hpotter for barcolor codes (iff) ()
I hope it will help your new ideas . Best regards ! Noldo .

Multi Timeframe RSI
This indicator will populate an RSI chart for multiple timeframes on the same chart.
Current Timeframe
15-min
1-hr
4-hr
1D
The point is to more easily see when things are getting oversold or overbought across multiple timeframes at the same time. To help with that, the background will also color green if all your selected timeframes are oversold and red if all your selected timeframes are overbought.
Note: It will only display and use the background colors on your current timeframe and timeframes larger than the current timeframe. So if you are looking at the 4-hr, the 15-min and 1-hr are ignored.

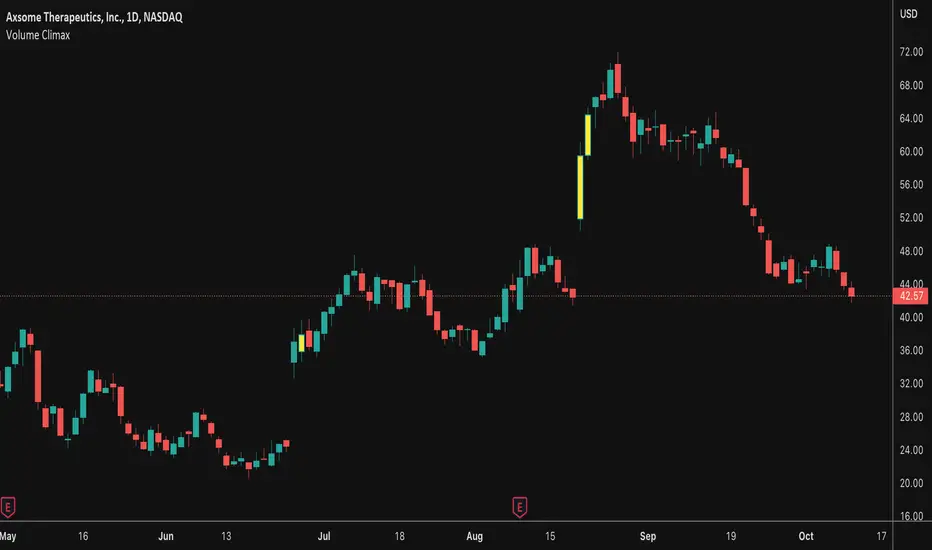
Volume ClimaxThis indicator couples RSI oversold and overbought regions with unusual volume . Often times you will see the final leg of a trend exhaust itself with this volume climax. This indicator is meant to help spot these instances.
User has the ability to customize oversold and overbought regions as well as a multiplier for how much more the volume needs to be relative to the 20 SMA . You can also set an alert with this indicator.