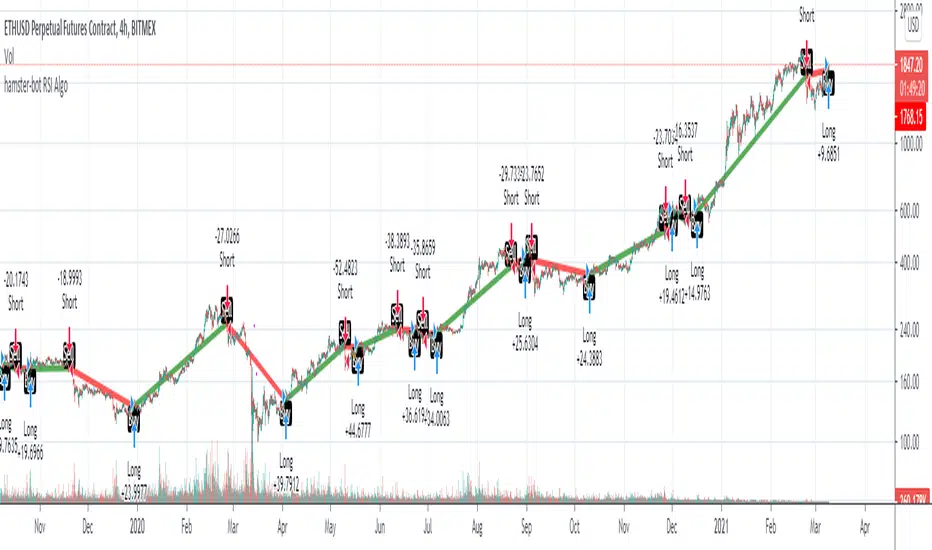
hamster-bot RSI AlgoThis is a simple RSI based signal indicator. It is designed for algorithmic bot trading.
For best results, leave a time-frame of at least 1 hour.
When the RSI reaches 70, it gives a buy signal, and when the RSI reaches 30, it gives a sell signal. The position is then maintained until the opposite signal is given. If backtesting shows poor results, but looks like the opposite would be good, there is a simple switch in the settings to turn it over.
original indicator on the basis of which the strategy is made:
Osilatörler
Bollinger Band with RSI
Using combination bollinger band and RSI indicator as guide to predict price volatility and the best entry point. The strategy logic is pretty straightforward where we're interested with close price that touches the lower bollinger band ; there are only two scenarios that will happened after the price reaches the lower band; the price might rebound from the lower bollinger band or drop lower and continue downtrend. To confirm the price movement, we use a second indicator which is the RSI to further investigate the price trend. For example, if the price reaches the lower bollinger band but the RSI value is not in the oversold region, we can conclude that the price will go lower and continue downtrend. If the RSI value is in the oversold region, we can use this price area as our entry point.
Stop loss is necessary to avoid losing too much capital if the RSI value lingers too long in the oversold region.
Best take profit area is when the price rebound above the middle bollinger band area/upper bollinger band or when the RSI reaches overbought region; whichever comes first.
Long entry:
RSI < 30 & close price < lower bollinger band
Exit entry:
RSI > 70
Default stop loss: -25%

Heikin Ashi+RSI+EMA Strategy 2.0 v4 [Cryptocurrency] by GodtrixHi,
I know a lot of people are looking for a more sophisticated and customizable strategy tool, I'm facing the same problem too, so I created one for myself and decided to share it for free trials and if you think this tool do what you wanted, you can contact me for the subscription "Premium" version.
I'll keep it simple with point forms, if you have any further inquiries or questions, please feel free to message me. Thank you.
Best profit plan with this strategy is you trade on Future leverage while you hold on to your coin, so that when price goes up, your coin value goes up, and at the same time, you trade with your leverage to earn even more, easily doubling up your total profit.
Benefits:
Fully customizable and you can easily personalized it and FINE TUNE it according to the market or coin you trading on.
The strategy is based on REAL PRACTICAL trading skills, so it works in real-world.
I fixed the "repainting" issue so the backtest it shows you IS ACCURATE when you run for real-time.
We all know one indicator is not going to help you win your trades, so this strategy combines ALL three: EMA for long+short term trend, HA for short term trend, RSI for entry/exit
This strategy is designed for LONG trade (Buy low, Sell high), not for SHORT trade.
This is not day trading, it is more to mid-term trading, where there's only few trades per month
Mainly is coded to work with 3Commas bot auto trading, so you only need to key in your Bot ID & Email Token.
Bot trading NOTE:
You need to replace the Alert Message with this: {{strategy.order.alert_message}}
One Alert will work for both Buy and Sell Order
If you using other Bot service, you can enter Custom Command too, so it works on any bot service.
Lastly,
regarding the setting advice, I would say you try playing with different settings and your objective is to achieve a backtest result that has:
1) Profitable is > 80%
2) Losing trades is nearly 0 or below 25% of your winning trades. Trick is using far stop loss %
3) Net Profit be almost same or more than "Buy & Hold Profit"
If you interested in our subscription version, message me for price.
Best Luck & a million dollar profit to you,
Godtrix BITSTAMP:BTCUSD BINANCE:DOTUSDT

Williams Alligator + RSI + T3CCIWilliams Alligator strategy is based on indicator developed by a legendary trader Bill Williams, an early pioneer of market psychology.
The strategy is based on a trend-following Alligator indicator, which follows the premise that financial markets and individual securities trend just 15% to 30% of the time while grinding through sideways ranges the other 70% to 85% of the time. Williams believed that individuals and institutions tend to collect most of their profits during strongly trending periods.
Although Alligator is a very strong tool it has a lot of weak signals and has lag span on entries and exits. We added RSI oscillator and T3CCI to clear market noises and weak signals. Moreover the approach we intoduced to the indicator allows to enter positions and close them earlier than orginal indicator which ensures stronger signals
The strategy supports traditional and cryptocurrency spot, futures, options and marginal trading exchanges. It works accurately with BTC, USD, USDT, ETH and BNB quote currencies. Best to use with 1D timeframe charts
The strategy can be and should be configured for each particular asset. You can change filters and risk management settings to receive the most advanced accurate alerts
Advantages of this script:
Good for long and Short positions
Produces strong long-term entries and closures of positions
Stable to short-term market fluctutions
Easy configuration with a user friendly interface
Backtests show high accuracy around 85.71%
High Net Profit percentage around 21.26%
High profit factor around 82.403
How to use?
1. Apply strategy to the trading pair your are interested in at 1D timeframe chart
2. Configure the strategy: change filters values and risk management settings until Strategy tester shows good results according to mathematical expectation
3. Set up a TradingView alert to trigger when strategy conditions are met
4. Strategy will send alerts when to enter and when to exit positions
Feel free to copy and use this script for your ideas and trading!

ATR + %R Scalping StrategyThe Average True Range is a single line indicator that measures volatility. The indicator was originally developed by J. Welles Wilder to measure the volatility of commodities within the futures market.
ATR does not measure price trends or price direction hence %R and Parabolic SAR indicators were added.
The strategy enhances standard Average True Range and %R composition with trend confirmation and filters which clear out market noises and manipulations from triggers.
The strategy supports traditional and cryptocurrency spot, futures, options and marginal trading exchanges. It works accurately with BTC, USD, USDT, ETH and BNB quote currencies. Best to use with 5 and 15 minutes timeframe charts and Limit orders.
The strategy can be and should be configured for each particular asset. You can change filters and risk management settings to receive the most advanced accurate alerts
Advantages of this script:
Strategy has high profit factor around 30.32
Backtests show high accuracy around 91.18%
High Net Profit percentage
Low Drawdowns
Weak signals are filtered
Dynamic Take profit and Stop loss
Fast deals around 50 minutes per trade
Can be applied to any market and quote currency
Easy to configure user interface
How to use?
1. Apply strategy to the trading pair your are interested in at 5m or 15m timeframe chart
2. Configure the strategy: change filters values and risk management settings until Strategy tester shows good results according to mathematical expectation
3. Set up a TradingView alert to trigger when strategy conditions are met
4. Strategy will send alerts when to enter and when to exit positions

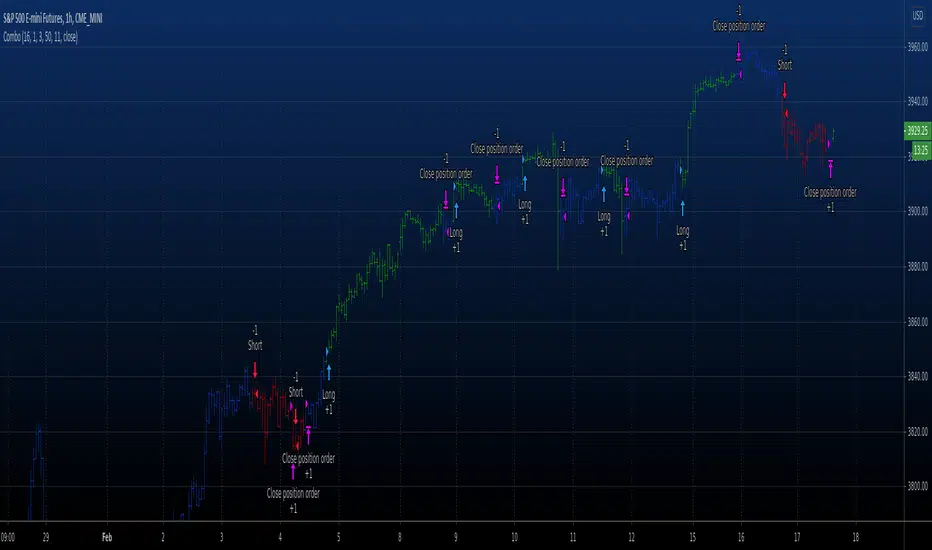
Combo Backtest 123 Reversal & Money Flow Indicator This is combo strategies for get a cumulative signal.
First strategy
This System was created from the Book "How I Tripled My Money In The
Futures Market" by Ulf Jensen, Page 183. This is reverse type of strategies.
The strategy buys at market, if close price is higher than the previous close
during 2 days and the meaning of 9-days Stochastic Slow Oscillator is lower than 50.
The strategy sells at market, if close price is lower than the previous close price
during 2 days and the meaning of 9-days Stochastic Fast Oscillator is higher than 50.
Second strategy
Indicator plots Money Flow Indicator (Chaikin). This indicator looks
to improve on Larry William's Accumulation Distribution formula that
compared the closing price with the opening price. In the early 1970's,
opening prices for stocks stopped being transmitted by the exchanges.
This made it difficult to calculate Williams' formula. The Chaikin
Oscillator uses the average price of the bar calculated as follows
(High + Low) /2 instead of the Open.
The indicator subtracts a 10 period exponential moving average of the
AccumDist function from a 3 period exponential moving average of the
AccumDist function.
WARNING:
- For purpose educate only
- This script to change bars colors.

Trend Daddy Bitcoin Strategy - Optimized For Automated TradingOverview:
This algorithm is the end result of years of trading both bitcoin and traditional markets. Over the years I've learned that trying to catch a top or bottom of a move is nearly impossible and results in a lot of pain. Instead, I've learned the money is made somewhere in the middle trading the momentum. That is how I came up with the Trend Daddy algo. Combining multiple different indicators, this script is able to pick up on large trending moves while at the same time avoiding sideways chop.
Signals:
The signals this algorithm produces are simple long and short signals. Keep in mind, this script will NOT attempt to short the top of the market nor will it attempt to catch knives. The signals that are thrown out attempt to play the momentum of the market, not reversals. Always wait for a candle to confirm in order to enter a trade.
Time Frame:
Bitcoin markets are extremely volatile and it is not recommended using this script on any time frame lower than 4 hours, with daily or above being the recommended time frame.
Backtesting:
I have run hundreds of backtests on this algorithm but also keep in mind that backtests do not show future results. I try to be as realistic in my backtests and do not account for any compounding. In the published backtest I ran an account size of $10k USD, only trading $10k USD per trade with no compounding. With this extremely conservative strategy, from day one of Bitcoin being listed on an exchange, this strategy would return roughly 1535% or $15,351 over the past 9 years.
Disclaimer:
Trading in any markets, especially cryptocurrencies involves taking on a great magnitude of risk. Do not trade any money that you are not willing to lose. Furthermore, past performance does not guarantee future results. The best trading device is your mind. Hopefully, this algorithm is the next best thing.

Combo Backtest 123 Reversal & Modified Price-Volume Trend This is combo strategies for get a cumulative signal.
First strategy
This System was created from the Book "How I Tripled My Money In The
Futures Market" by Ulf Jensen, Page 183. This is reverse type of strategies.
The strategy buys at market, if close price is higher than the previous close
during 2 days and the meaning of 9-days Stochastic Slow Oscillator is lower than 50.
The strategy sells at market, if close price is lower than the previous close price
during 2 days and the meaning of 9-days Stochastic Fast Oscillator is higher than 50.
Second strategy
The related article is copyrighted material from
Stocks & Commodities.
WARNING:
- For purpose educate only
- This script to change bars colors.

Combo Backtest 123 Reversal & MASS Index This is combo strategies for get a cumulative signal.
First strategy
This System was created from the Book "How I Tripled My Money In The
Futures Market" by Ulf Jensen, Page 183. This is reverse type of strategies.
The strategy buys at market, if close price is higher than the previous close
during 2 days and the meaning of 9-days Stochastic Slow Oscillator is lower than 50.
The strategy sells at market, if close price is lower than the previous close price
during 2 days and the meaning of 9-days Stochastic Fast Oscillator is higher than 50.
Second strategy
The Mass Index was designed to identify trend reversals by measuring
the narrowing and widening of the range between the high and low prices.
As this range widens, the Mass Index increases; as the range narrows
the Mass Index decreases.
The Mass Index was developed by Donald Dorsey.
WARNING:
- For purpose educate only
- This script to change bars colors.

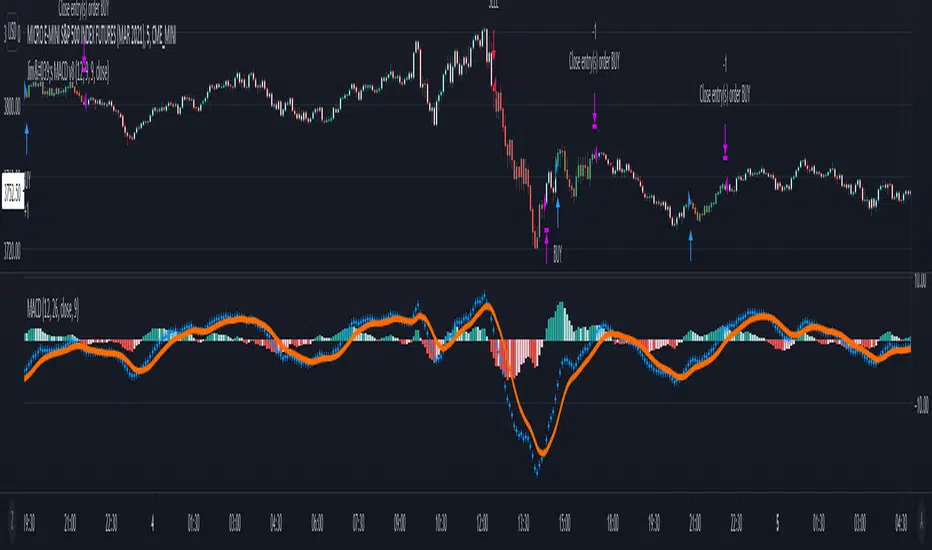
Jim's MACDMACD Buy/Sell Strategy
Filters bearish crossovers above the 0 line and bullish crossovers below.
Uses 34 ema to further filter the trades and take only longs above and only shorts below.
Apply at least 2:1 risk to reward ratio to account for losing trades.
Trade at own risk!
Scalping using RSI 2 indicator with TSLThis strategy implements a simply scalping using the RSI (calculated on two periods), the slopes of two MAs ( EMA or SMA ) having different lengths (by default, I use 50 and 200).
A trailing stop loss (%) is used.
Entry conditions:
.) Fast MA > Slow MA and Price > Slow MA and RSI < Oversold Threshold ------> go Long
.) Fast MA < Slow MA and Price < Slow MA and RSI > Overbought Threshold ------> go Short
Exit conditions:
.) Long entry condition is true and (close >= TP or close <= TSL ) ----> close short position
.) Short entry condition is true and (close <= TP or close >= TSL ) ----> close long position
The strategy performed best on Bitcoin and the most liquid and capitalized Altcoins but works excellent on volatile assets, mainly if they often go trending.
Works best on 3h - 4h time frame.
There's also an optional Volatility filter, which opens the position only if the difference between the two slopes is more than a specific value, which can be set in the study inputs. The purpose is not opening positions if the price goes sideways and the noise is way > than the signal.
Note:
.) the RSI length is 2;
.) the oversold Threshold is 90%;
.) the overbought Threshold is 10%;
.) by default, the trailing stop loss per cent is 1%;
.) by default, the fast MA length is 50;
.) by default, the slow MA length is 200;
.) by default, the MA used is EMA.
Cheers.

RSI Classic Strategy (by Coinrule)One of the questions hobbyist traders more often ask is: what is the perfect trading indicator?
Every indicator is just a tool, so its efficiency is proportional to your ability to read its signals and translate them into an actionable trading strategy. The RSI is likely the most flexible and easy to use among the technical indicators.
This trading strategy tries to catch short-term swings on the coins of your choice with a simple yet profitable setup.
Buy when the RSI is lower than 30 (you can adjust it to 35 in times of steep uptrend).
Sell when the RSI is greater than 65 (the target may range between 60 and 75 depending on the volatility of the coin).
Note that the buy signal comes when the indicator crosses below 30 and not when it crosses above 30 as it happens on the built-in RSI strategy on Tradingview.
The present script overperforms the built-in strategy, even adding trading fees and using a lower amount of capital for each trade (30%). That means that the system can deliver higher net-profits with lower risk levels.
A typical example of market conditions where this strategy works perfectly is as follows.
The first initial breakout indicates that a new leg up in the trend may start. Bitcoin starts to trade within a range which you can identify when it reaches the point 3. That is the perfect time to start the rule because
- trading within a channel anticipates possible swings up and down
- the trend is on the upside, providing low downside risk in buying the dips.
This strategy works well with selected coins of your choice, and it's a great fit on leverage exchanges like Binance Futures.
If you prefer to run it across all available coins on the market, instead, you may choose an optimized version.

ATH Oscillator StrategyThis idea stems from the belief that people want to reverse the trend when an all time high or low is hit. This strategy incorporates that by using ath and atl values based on the lookback period and the signal gets smoothed by the input smoothing type and length. I found that the best time to use this was on the 3m chart. But I am certain that higher time frames can be used if the settings are tweaked.
Settings:
Strategy -
simple(long,short,switch) - This strategy just uses the directional change of the signal using just longs, just short, or switching between the two.
range - This strategy uses the hlines on the chart to determine when to buy and sell. These can be adjusted using the Range Top / Bot values
div - This strategy uses a simple divergence of the signal line to time entries
Lookback - How many bars back to check the ath and atl
Smoothing - How smooth you want the signal
Smoothing Type - Different ways to smooth the signal
Range Top/Bot - Changes the height of the hlines for the range strategies
On Buy/Sell Signal # - Change when you enter. Increasing this number will move the signals to the left if there are consecutive signals. Useful to find bottoms and tops.
Chart: ETHUSD Perp Bybit
Strategy Properties: 100 base order, 100% equity
Notes: Use on 3-5m time frame for best results. Change settings if you want to try other coins like BTC or higher time frames

Combo Backtest 123 Reversal & Martin Pring's Special K This is combo strategies for get a cumulative signal.
First strategy
This System was created from the Book "How I Tripled My Money In The
Futures Market" by Ulf Jensen, Page 183. This is reverse type of strategies.
The strategy buys at market, if close price is higher than the previous close
during 2 days and the meaning of 9-days Stochastic Slow Oscillator is lower than 50.
The strategy sells at market, if close price is lower than the previous close price
during 2 days and the meaning of 9-days Stochastic Fast Oscillator is higher than 50.
Second strategy
Pring's Special K is a cyclical indicator created by Martin Pring.
His method combines short-term, intermediate and long-term velocity
into one complete series. Useful tool for Long Term Investors
Modified for any source.
WARNING:
- For purpose educate only
- This script to change bars colors.
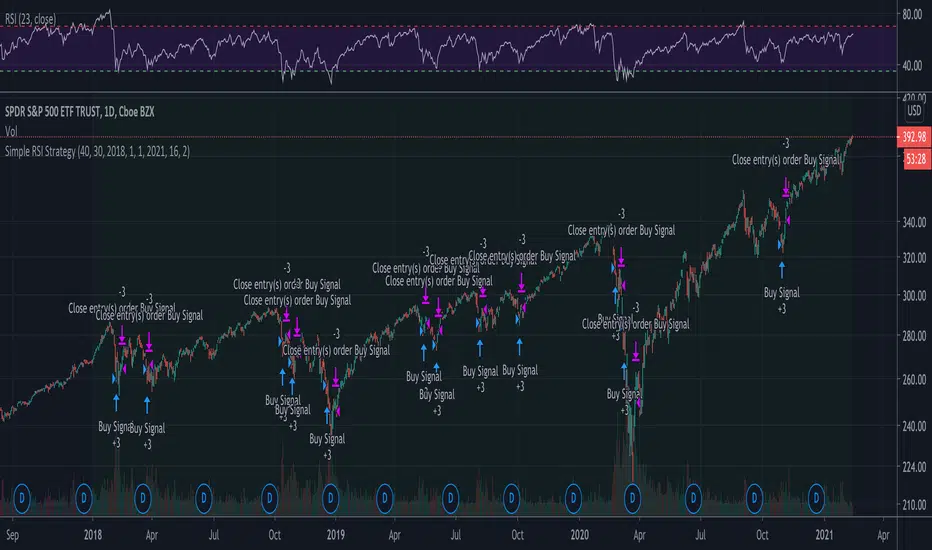
Example of Simple RSI Buy/Sell at a level and hold for 10 daysScript implements strategy:
1 Buy at RSI (10) < 30
2 Sell at RSI (10) > 40 or after 10 days
The strategy is not profitable for long term trading.
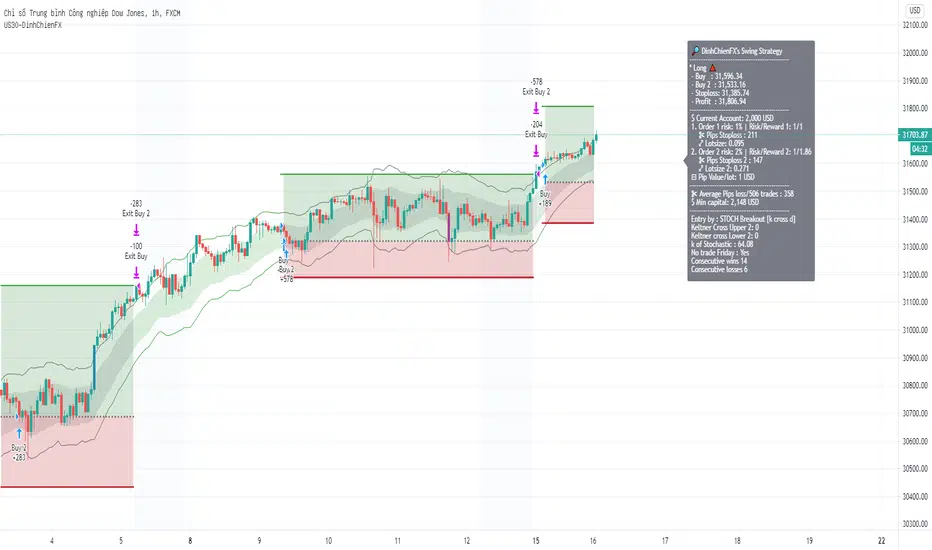
US30-DinhChienFX Swing [2 orders]Keltner basis: 20 | trend identification: Keltner Upper/Lower 2 | entry: Stochastic breakout k cross d | Stoploss: 2, Profit: 2 |
The strategy finds the rule in 4 years, every year, every quarter. The ratio of risk/reward 1/1 to give the success percentage over 55%.
Makes a second order has a better ratio. US30''s risk/reward: 1/1.86.
Look the right label: that rule has 14 times consecutive wins and 6 times consecutive losses in history.
-----------
+ A Long trend is when the price close & crossover the Keltner Upper 2 + k value of Stochastic indicator crossover 80.
+ A Short trend is when the price close & crossunder the Keltner Lower 2 + k value of Stochastic indicator crossunder 20.
+ to Entry when k value ( Stoch indicator) make correction and cross the d value ( Stoch indicator)
- Buy: d > 70
- Sell: d < 17
*** Use the link below to obtain access to this indicator
Buy and Hold entry finder StrategyHello everyone!
I proudly present the backtest Strategy Script for my "Buy and Hold entry finder" Script.
It basically shows you the outcome, if you would use my indicator in the past.
The buy signals are limited to 1 order per month.
Order Size: Allows you to choose, how much money you want to invest per month. (Please consider, it will only invest an x amount per Order, but it will not stack the amount you did not invest in an previous month ) (Example in my indicator)
Pyramiding: Just regulates, how often you can open an position.
Commission: Here you can set how much it will cost to open an position at your broker.
I coded a feature that allows you to set a Start Date and an End Date for your backtest. In the end of the backtest the script closes all positions.
If you got any question, feel free to ask in the comments or send me a message.
Sincerely, RS Titan.

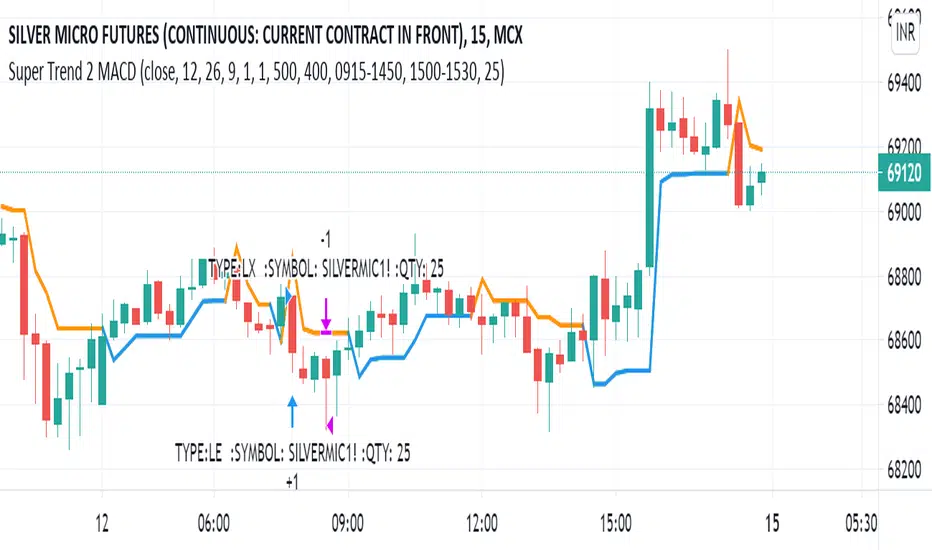
Super Trend 2 MACD pk singhalYou can automate complete strategies, and not just indicators using the TradingView free version. That’s right! explore 1000s of strategies from public library using free Tradingview and free APIBridge (paper trading). We will demonstrate this using SuperTrend strategy (not SuperTrend indicator).
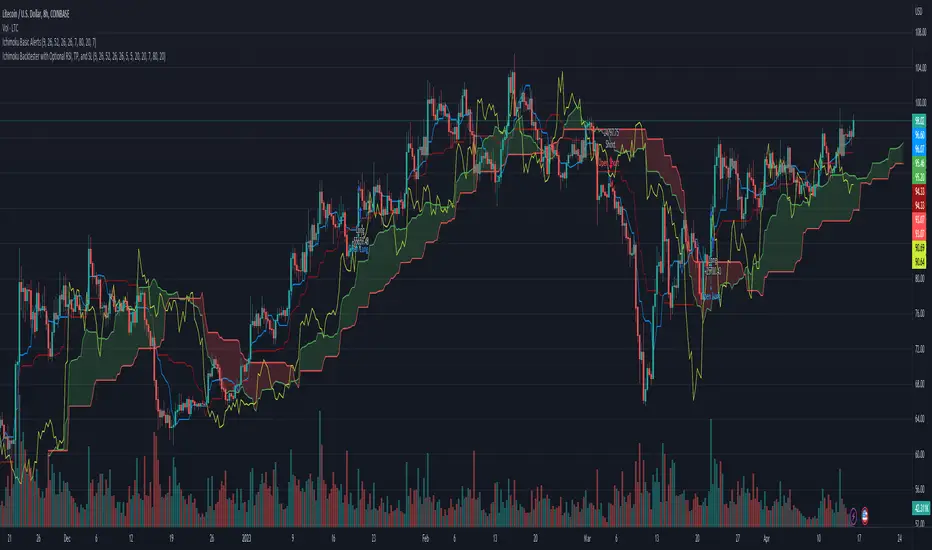
Ichimoku Backtester with TP, SL, and Cloud Confirmation OptionStarted with the Basic Ichimoku strategy from Mizuki32. Added Take Profit, Stop Loss (for both long and short), and a toggle to wait for confirmation from the cloud.
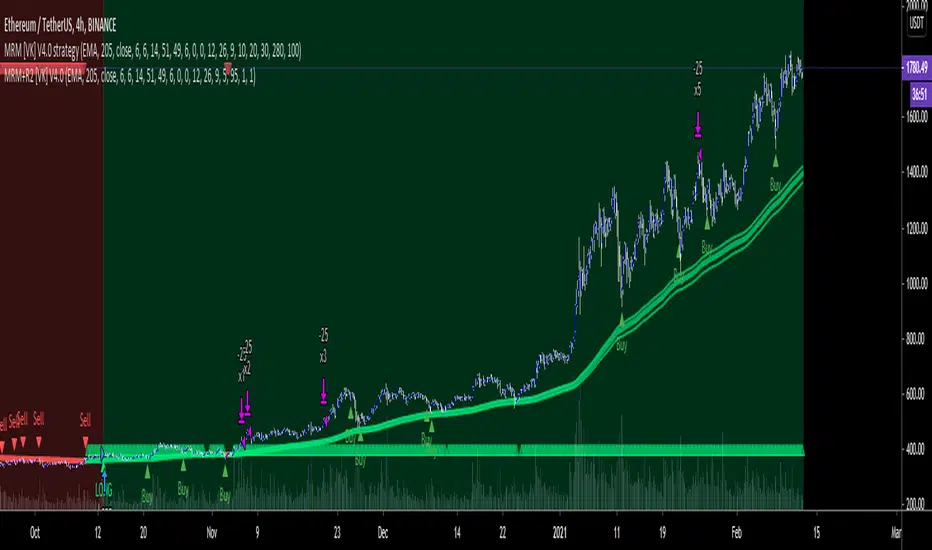
MRM [VK] V4.0 strategyMRM VK strategy
This strategy uses MA, RSI , MACD combined.
MACD and RSI can be used multi time frame to filter trend.
It is a very simple strategy which goes long/short when MACD , RSI and MA Trend Changes in higher Time Frame.
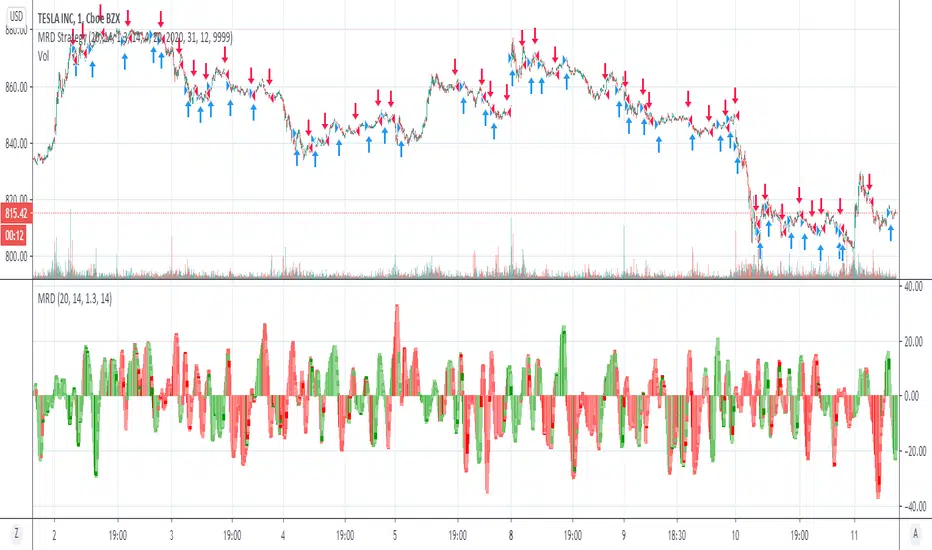
MRD StrategyI heard that MFI and RSI were most reliable when they are close together, so i made a script that takes the rough difference between the two, with some regression etcetera. What you see currently is 50.69% profitable trades, with a profit ratio of 1.3. Hope you like it.
RSI-VWAP Indicator %█ OVERALL
Simple and effective script that, as you already know, uses vwap as source of the rsi, and with good results as long as the market has no long-term downtrend.
RsiVwap = rsi (vwap (close), Length)
The default settings are for BTC in a 30 minute time frame. For other pairs and time frames you just have to play with the settings.
█ FEATURES
• The option to start trading from a certain date has been added.
• To make the profit more progressive, a percentage of your equity is used for entries and a percentage of your position is used for closings.
• The option to trade in Spot mode has been added, since, for the TradingView backtest, the money is infinite and if you do not limit it somehow,
it would offer you much better profits than the live trading.
QuantityOnLong = Spot ? (EquityPercent / 100) * ((strategy.equity / close) - strategy.position_size) : (EquityPercent / 100) * (strategy.equity / close)
• The option to stop the system when the drawdown exceeds the fixed limit has been added.
Drawdown, as you already know, is a very important measure of risk in trading systems.
The maximum drawdown will tell us what the maximum loss of a trading system has been during a period. This maximum loss is determined by:
strategy.risk.max_drawdown(Risk, strategy.percent_of_equity)
• Leverage plotted on labels added.
█ ALERTS
To enjoy the benefits of automatic trading, TradingView alerts can be used as direct buy-sell orders on spot, or long-close orders with leverage.
Currently there are Chrome extensions that act as a bridge between TradingView and your Exchange or Broker.
This is an example of syntax for this type of extensions. Copy and paste a message like this into the alert window:
{{strategy.order.action}} @ {{strategy.order.price}} | e = {{exchange}} a = account s = {{ticker}} b = {{strategy.order.action}} {{strategy.order.alert_message}}
█ NOTE
Certain Risks of Live Algorithmic Trading You Should Know:
• Backtesting cannot assure actual results.
• The relevant market might fail or behave unexpectedly.
• Your broker may experience failures in its infrastructure, fail to execute your orders in a correct or timely fashion or reject your orders.
• The system you use for generating trading orders, communicating those orders to your broker, and receiving queries and trading results from your broker may fail.
• Time lag at various point in live trading might cause unexpected behavior.
• The systems of third parties in addition to those of the provider from which we obtain various services, your broker, and the applicable securities market may fail or malfunction.
█ THANKS
Thanks to TradingView, its Pine code, its community and especially those Pine wizards who post their ideas that helps us to learn.
If the world is heading toward a equitable new world economic order, let's get rich first ...
Happy trading!
