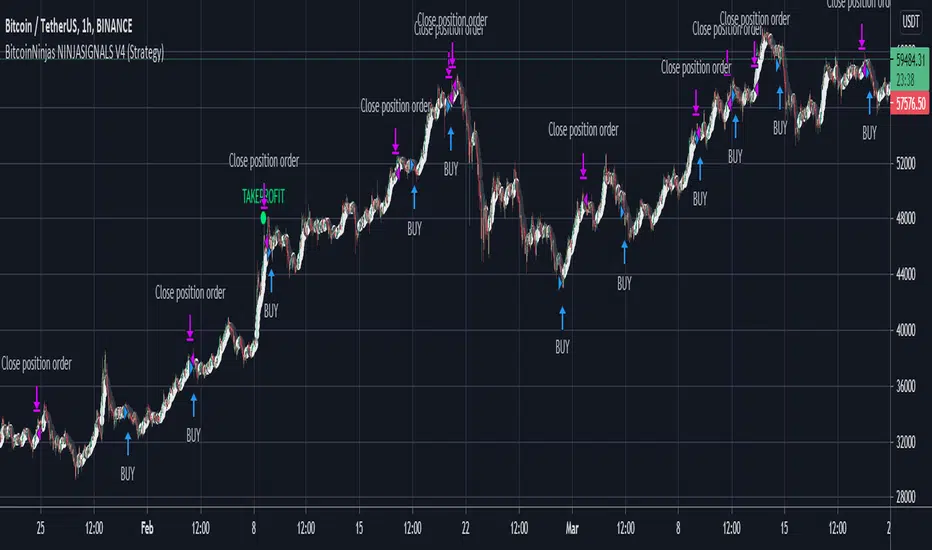
BitcoinNinjas NINJASIGNALS V4 (Strategy)BitcoinNinjas NINJASIGNALS V4 (Strategy)
(for Cryptocurrencies, Forex, GunBot, ProfitTrailer, Autoview, CryptoHopper, manual or automated trading, and more)
This is version 4 of our Ninja Signals trading script, with accompanying backtesting strategy.
BitcoinNinjas NINJASIGNALS V4 (Script)
•Allows users to easily set automated buy/long and sell/short alerts on TradingView for use with automatic and manual trading of cryptocurrencies, Forex securities, and more (alerts are compatible with automatic trading software such as GunBot, ProfitTrailer, Autoview, CryptoHopper, and more).
•Synthesizes many powerful indicators [e.g., Relative Strength Index (RSI), Stochastic RSI, Money Flow Index (MFI), Moving Average Convergence Divergence (MACD), etc.) into one powerful script to generate very precise buy and sell signals in virtually all market conditions.
•Features user-defined adjustable calibration settings, allowing traders to customize the script to fit any currency / security on any exchange available through TradingView.com, simply by adjusting settings.
•Buy/Long arrows, Sell/Short arrows, & EMA trendline can be customized or hidden, if desired.
•Complete with backtesting strategy version of script which allows users to test various trading strategies based on the alerts the script generates (see information and screenshots below).
•Backtesting strategy features a user-defined adjustable date range, so traders can estimate performance of the script over specific periods of time, such as the last week, month, or year.
•Script and backtesting strategy feature many user-adjustable settings including stop loss and take profit alerts, an ‘only sell for profit’ option (Gunbot-specific), many different buy and sell filters, and more. Simply adjust the script settings and the backtesting results will automatically refresh.
•Backtesting strategy allows for pyramid buying to test various average down / dollar cost average trading strategies. Simply adjust the number of pyramid buys and the quantity of each buy.
•Fully compatible with margin and futures trading for any currency / security on TradingView.com.
DISCLAIMER: By using our BitcoinNinjas ‘Ninja Signals’ planning script, you agree to the BitcoinNinjas 'Terms of Use'. No sharing, copying, reselling, modifying, or any other forms of use are authorized for our documents, script / strategy, and the information published with them. This informational planning script / strategy is strictly for individual use and educational purposes only. This is not financial or investment advice. Investments are always made at your own risk and are based on your personal judgement. BitcoinNinjas is not responsible for any losses you may incur. Please invest wisely.
Osilatörler
Break of structure (BOS) forex StrategyPlease read all Details before using this indicator
This strategy is based on taking position after the break of a Previous High/Low swing happens (fixed time frame), the break of structure happens because of the swing happens then we go long or short respectively in this strategy.
I will be discussing the setting details through which you can make it work on different forex pairs.
Does it work on other pairs?
Yes, I have found similar back test results on other USD pairs.
Does it works on smaller time frame?
Yes it does work on smaller time frame , you have to understand the below concepts used and try different settings.
For the user the most important thing is to understand the settings of the indicator so that they can optimize the setting and get the best results:
This indicator contains the following IMPORTANT setting:
i. Fixed trading session for long trades (long position can be taken in that period of time only)
ii. Fixed trading session for short trades (Short position can be taken in that period of time only)
The concept behind restricting the time to go long or short is because in forex the particular pair move in a particular direction depending upon the currency and time zones.
This strategy works on different forex pairs, you need to find the best settings. I will be providing the best settings which works for this strategy and different pairs.
2. Choose Previous High/Low Timeframe
This is the most important option where you have to choose the timeframe for which you want H/L by default it is set to “D”. This timeframe H/L reference will be taken for taking trading decisions.
3.Setting for back test selection date range you can check the beck test of a particular time range.
4.You can check Long and Short positions performance separately, by unchecking the “Go_long” option it will remove all long positions from back test. Vice versa for “Go_short option”
5.Internal Bar Strength
IBS is simply an indicator where you buy on weakness and sell on strength, the cornerstone of any mean-reverting strategy.
It oscillates from zero to one and measures the relative position of the closing price relative to the High and Low.
IBS = (Close – Low) / (High – Low)
In the input setting the you can disable enable the IBS option from the strategy.
6. Parkinson volatility
Parkinson volatility is a volatility measure that uses the stock’s high and low price of the day (can be changed in the setting, instead of day it can be set to any bar length)
The main difference between regular volatility and Parkinson volatility is that the latter uses high and low prices for a day, rather than only the closing price.
In the setting you have three option
i. Enter Volatility Threshold
If the Parkinson volatility value is greater than the the threshold value then it lets the trade happen.
ii.Set the high/low bar time frame for calculating Parkinson volatility. ( Set 60m by default)
Formula used as below:
high_=security(syminfo.ticker, input("60"), high)
low_=security(syminfo.ticker, input("60"), low)
hourlyRangeSquared = pow((log(high_) - log(low_)), 2)
dailyParkinsonVol = sqrt(sum(hourlyRangeSquared, 24) / (4 * log(2)))
7. "Enter no of contract size"
This setting helps you to set the contract size , by default it is set to 100000.
8. “Zigzag Filter Length” this setting is for SWING H/L Lookback. With the help of this I have ploted Swing Support and Resistance.
9.Futrther confirmation of trade is done through the RSI criteria. In this I have provided four kind of RSI confirmation you can test all by selecting any one of the four.
i. filter trade on the basis of BB of RSI (as shown in the image)
ii. filter trade on the basis of RSI Levels (RSI>50 for long, vice versa for short)
iii. filter trade by rsi>basis of BB of RSI(for long) & rsi<50(for short)
iv. filter trade by rsi>50(long) & rsi< basis of BB of RSI(short)
SELECT ONLY ONE OF THE ABOVE IN SETTING.
10.For Exiting the trade I have used the trailing SL you can change it in setting.
You can exit the trade using two targets (two take profit) using different size for exiting the trade.
If you want to take only on target then you have to make QANTITY of shares for 1st Exit as 100. Then you will exit all your position in the first target.
A big thanks to kodify.net there articles are very helpful kodify.net
Thanks to Mickey for providing assistance.
Thanks to stack overflow community for clearing the doubts.
Trading view official documentation on V4 of pine script also helped me.

(IK) Stoch-60-15This strategy uses 60 minute and 15 minute stochastic data to determine entry and exit; it only executes long trades. I've only used this on BTC/USD, but I imagine the concepts employed should hold for any ticker
The script builds a simple Stochastic indicator for the current timeframe, and it also plots a single stochastic line for a higher resolution time frame. I've found good results trading on 15 minutes with a 60 minute higher resolution.
We enter a trade if the higher resolution stochastic is in an uptrend, if the current resolution stochastic is in an uptrend, and if the current stochastic value is less than 50.
We exit a trade when the current stochastic value crosses below 80 or the trailing stop loss is hit.
Stop loss is calculated with the input value, Stop Loss Percent. This value represents the percent of capital you're willing to lose before exiting a trade. A stop loss percent of 0.050 means your trade will exit if it falls 5% from the highest high since entering a trade. You will have at least 95% of your original capital left. There is no option to change a trailing stop loss to a set stop loss (in order to keep the code as simple as possible), however, you can turn it off by setting Stop Loss Percent to 1.
I tried to keep the script itself lightweight and very easy to understand, so it's not very customizable in regards to input options. You can change stochastic data, as well as the trailing stop percentage. The script can be adjusted to other timeframes, however this requires a small change in the code (details in script comments). Changing just the "Higher Resolution" input will not produce expected results
My hope is that by keeping it lightweight and simple, it will be easier for you to adjust to your specific needs, or work into a larger strategy.

RSI+PA+DCA StrategyDear Tradingview community,
This RSI based trading strategy is created as a training exercise. I am not a professional trader, but a committed hobbyist. This not a finished trading strategy meant for trading, but more a combination of different trading ideas I liked to explore deeper. The aim with this exercise was to gain more knowledge and understanding about price averaging and dollar cost averaging strategies. Aside that I wanted to learn how to program a pyramiding strategy, how to plot different order entry layers and how to open positions on a specific time interval.
In this script I adapted code from a couple of strategy examples by Coinrule . Who wrote simple and powerful examples of RSI based strategies and pyramiding strategies.
Also the HOWTO scripts shared by vitvlkv were very helpful for this exercise. In the script description you can find all the sources to the code.
A PA strategy could be a helpful addition to ease the 'stress-management to buy when price drops and resolution in selling when the price is rising' (Coinrule).
The idea behind the strategy is fairly simple and is based on an RSI strategy of buying low. A position is entered when the RSI and moving average conditions are met. The position is closed when it reaches a specified take profit percentage. As soon as the first the position is openend multiple PA (price average) layers are setup based on a specified percentage of price drop. When the price crosses the layer another position with somewhat the same amount of assets is entered. This causes the average cost price (the red plot line) to decrease. If the price drops more, another similar amount of assets is bought with another price average decrease as result. When the price starts rising again the different positions are separately closed when each reaches its specified take profit. The positions can be re-openend when the price drops again. And so on. When the price rises more and crosses over the average price and reached the specified take profit on top of it, it closes all the positions at once and cancels all orders. From that moment on it waits for another price dip before it opens a new position.
Another option is to activate a DCA function that opens a position based on a fixed specified amount. It enters a position at the start of every week and only when there are already other positions openend and if the current price is below the average price of the position. Like this buying on a time interval can help lowering the average price in case the market is down.
I read in some articles that price averaging is also called dollar cost averaging as the result is somewhat the same. Although DCA is really based on buying on fixed time intervals. These strategies are both considered long term investment strategies that can be profitable in the long run and are not suitable for short term investment schemes. The downturn is that the postion size increases when the general market trend is going down and that you have to patiently wait until the market start rising again.
Another notable aspect is that the logic in this strategy works the way it does because the entries are exited based on the FIFO (first in first out) close entry rule. This means that the first exit is applied to the first entry position that is openend. In other words that when the third entry reaches its take profit level and exits, it actually exits the first entry. If you take a close look in the 'List of Trades' of your Strategy Tester panel, you can see that some 'Long1' entries are closed by an 'Exit 3' and not by an 'Exit 1'. This means that your trade partly loses, but causes a decrease in average price that is later balanced out by lower or repeated entering and closing other positions. You can change this logic to a real sequential way of closing your entries, but this changes the averaging logic considerably. In case you want to test this you need to change, in this line in the strategy call 'close_entries_rule = "FIFO"', the word FIFO to ANY.
In the settings you can specify the percentage of portfolio to use for each trade to spread the risk and for each order a trading fee of 0.075% is calculated.

MACD BTC Long/Short Strategy v1.0This strategy will use only default MACD with Simple MA(Signal Line) mode 'ON' to determine when it's time to long/short using its histogram value.
Current version has 2 more entries added to increase more trades and profits along the way while maintaining low 'max drawdown' and high returns.
Entry will be opened when macd line(blue) crossed with signal line(red).
Entry will be closed when histogram increased/decreased opposite its previous histogram.
Re-enter will opened a position when histogram continues after X delay (Re-enter Delay setting).
Sculp will opened a position when histogram is still in light colors for X delay (Sculp Delay setting).

Predict DinhChienFX's1. Identify the trend
* On the chart:
a. Part of Dow theory: multi-trades active at the impulse waves.
Uptrend trend:
- HH / Higher High: The following peak is higher than the previous one.
- HL / Higher Low: The back bottom is higher than the previous one.
Downtrend:
- LL / Lower Low: The back bottom is lower than the previous one.
- LH / Lower High: The posterior peak is lower than the previous one
b. Keltner price channel:
Uptrend: Go above Upper 2
Bearish trend: Down to Lower 2
* Under Chart:
Stochastic indicator: 21 past candles
- Uptrend: Index K and D surpass 80
- Buy zone: Index D is large 80.
----------------------------
- Downward trend: K and D indexes go down to 20.
- Sell zone: Index D is less than 20.
RSI indicator: 21 past candles
- Uptrend: value exceeds 80.
- Downward trend: value exceeds 20.
ADX indicator: Used to identify a strong trend
- ADX smooth: 9
- DI: 9
2. Entry point:
- Buy: wait to buy on the Upper Keltner channel.
- Sell (sell): wait for sell at the Lower Keltner channel.
3. Take profit, stoploss
ATR indicator (20) (Average true range) * 2

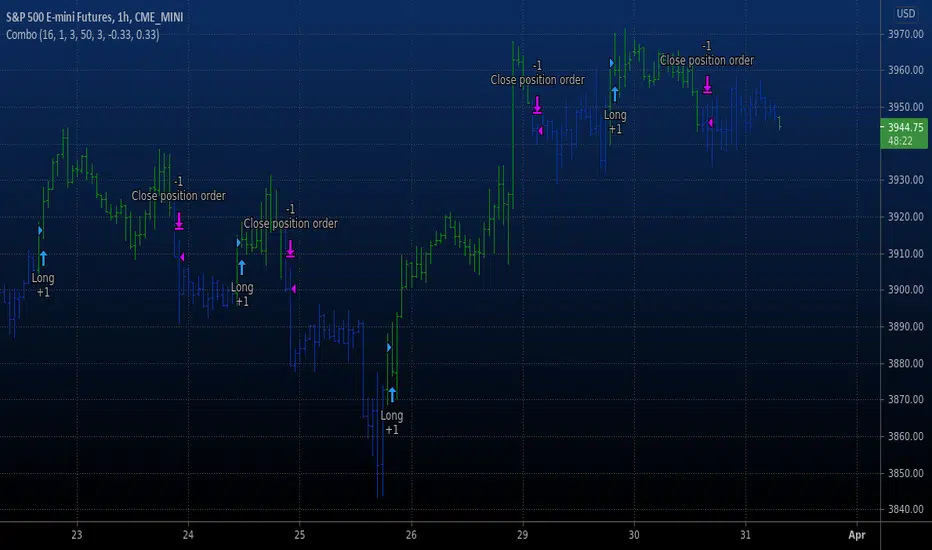
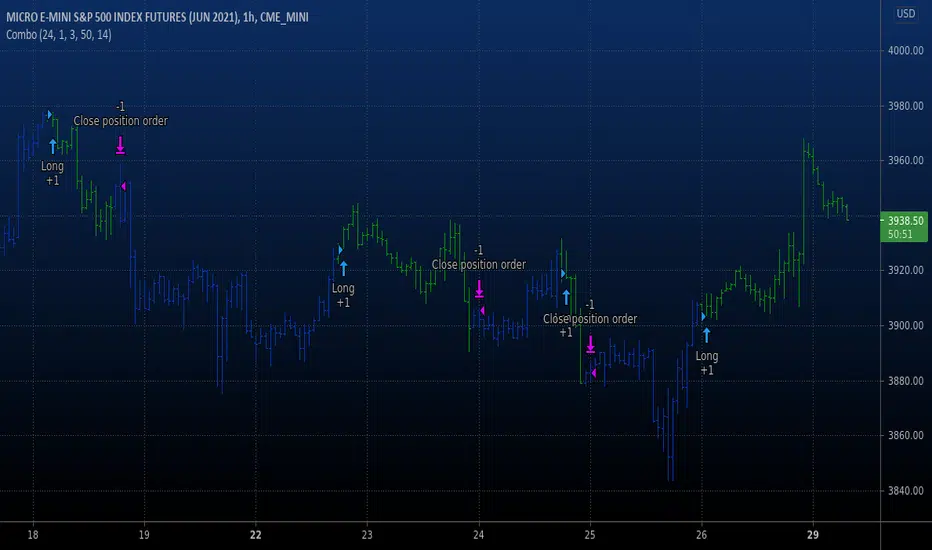
Combo Backtest 123 Percent change bar This is combo strategies for get a cumulative signal.
First strategy
This System was created from the Book "How I Tripled My Money In The
Futures Market" by Ulf Jensen, Page 183. This is reverse type of strategies.
The strategy buys at market, if close price is higher than the previous close
during 2 days and the meaning of 9-days Stochastic Slow Oscillator is lower than 50.
The strategy sells at market, if close price is lower than the previous close price
during 2 days and the meaning of 9-days Stochastic Fast Oscillator is higher than 50.
Second strategy
This histogram displays price or % change from previous bar.
WARNING:
- For purpose educate only
- This script to change bars colors.
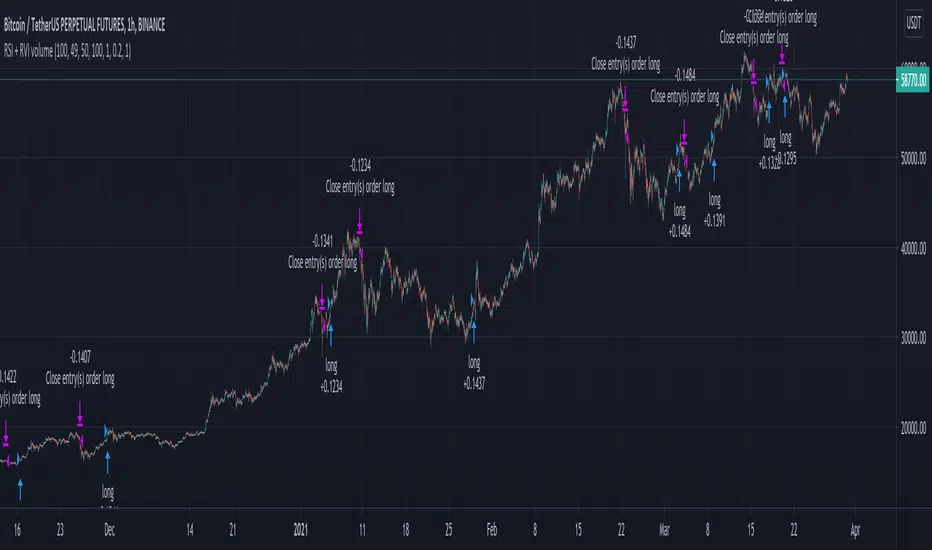
RSI and RVI on volume crypto BTC This strategy combine special version of RSI and RVI , where in this case , I am using the volume , for measuring the speed and change of volume to the price both up and down size together with the volatility spikes.
In this case instead of looking at the volume or volatility, I am combining them into one oscillator.
For best usage, I believe a big length of candles like 100 can get better results, and use it in this way as a lagging indicator.
Since most of the tests I made for futures, I applied a risk management in % of the price movement. For stop loss we have 20% while for TP, 100%. However in both cases, we will exit sooner, and thats going to be when condition from the oscillator says so.
For this we have a middle level, 50, which will act as both overbought and oversold areas.
At the same time I apply the posibility of using leverage into size calculations for more precise tests and try to get min-max out of it.
If you have any questions, please let me know !
Volume RSI Crypto This is a special version RSI, in this case , I am using the volume, which is measuring the speed and change of volume to the price both up and down size.
Volume RSI attempts to gauge price trend changes via changes in bullish and bearish movements.
Its formula is :
VoRSI = 100 - 100 / (1 + VoRS)
where VoRS is Volume Relative Strength over specified period which is calculated as a ratio between averages of Up-Volumes and Down-Volumes:
VoRS = (Average Up-Volume) / (Average Down-Volume)
The logic for this strategy is simple
We entry long when we have a crossover with the Overbought level and we entry short when we have a crossunder with oversold level.
If you have any questions, please let me knw !

Combo Backtest 123 Overbought/Oversold This is combo strategies for get a cumulative signal.
First strategy
This System was created from the Book "How I Tripled My Money In The
Futures Market" by Ulf Jensen, Page 183. This is reverse type of strategies.
The strategy buys at market, if close price is higher than the previous close
during 2 days and the meaning of 9-days Stochastic Slow Oscillator is lower than 50.
The strategy sells at market, if close price is lower than the previous close price
during 2 days and the meaning of 9-days Stochastic Fast Oscillator is higher than 50.
Second strategy
Simple Overbought/Oversold indicator
WARNING:
- For purpose educate only
- This script to change bars colors.

Simple BTC scalper 1minThis is a simple but effiecient 1 min scalper for BTC pairs
Its made of EMA 200 and Stochastic RSI.
Rules are simple :
For long we check that close is above the EMA and that stochastic crosses on the 20 level.
For short we check that close is below the EMA and that stochastic crosses above the 80 level.
We exit long when we enter short, and viceversa for short.
If there are any questions, please let me know !

CRYPTO RVI FUTURE 1HThis is a crypto strategy adapted for the futures pairs, especially the perpusdt ones from binance for 1h time frame.
The main component here is the RVI, which is a modified form of the RSI indicator. The RVI, measures more the general direction of the volatility, and can get the trends far smoother than the RSI.
The logic inside is the same like we would normally do with RSI, we check for overbought and oversold levels, and based of that we have an entry or exit depending if we go long or short.
I have tested this product with all the pairs from PERPUSDT from binance and seems to works with the majority of them, of course on some better than the others.
If there are any questions, please let me know !

Crypto rsi cci mf stoch rsi oscillators all in one strategyThis is a strategy based on the popular oscillator like RSI, CCI, MF and Stochastic RSI oscillators.
In this situation I use a very high length , 100 candles, and the middle point between overbought and oversold levels at 50.
The entry for long is when all oscilators are above 50, and the exit is when they are below 50 + plus some minor modifications
If you have any questions, please message me a private message !

Combo Backtest 123 Negative Volume Index This is combo strategies for get a cumulative signal.
First strategy
This System was created from the Book "How I Tripled My Money In The
Futures Market" by Ulf Jensen, Page 183. This is reverse type of strategies.
The strategy buys at market, if close price is higher than the previous close
during 2 days and the meaning of 9-days Stochastic Slow Oscillator is lower than 50.
The strategy sells at market, if close price is lower than the previous close price
during 2 days and the meaning of 9-days Stochastic Fast Oscillator is higher than 50.
Second strategy
The theory behind the indexes is as follows: On days of increasing
volume, you can expect prices to increase, and on days of decreasing
volume, you can expect prices to decrease. This goes with the idea of
the market being in-gear and out-of-gear. Both PVI and NVI work in similar
fashions: Both are a running cumulative of values, which means you either
keep adding or subtracting price rate of change each day to the previous day`s
sum. In the case of PVI, if today`s volume is less than yesterday`s, don`t add
anything; if today`s volume is greater, then add today`s price rate of change.
For NVI, add today`s price rate of change only if today`s volume is less than
yesterday`s.
WARNING:
- For purpose educate only
- This script to change bars colors.
RSMI have published that script not like oscillator, which in fact it is, because tradingview doesn't support dual plots in overlay=true and overlay=false. So I have decided that to show filter is better idea. Yes, it decrease potential profit on long term, but for me personally, it is much better to understand the direction of the market movement and take potential trades more seriously. Also about this script: in general based on RSI and works pretty nice on 1H timeframe. Yes, theoretically it can work on both 4H and 1D timeframes, but for this you need to change the settings that are not displayed in the inputs (I did not add them, due to the fact that they can be confusing, because I decided to add a filter). And about filter - it is one of the variations of the SuperTrend. According to House Rules, I cannot insert links here, but only if you are interested in trying this work in auto trading, you can follow the link (located even lower) and find there an algorithm with the same name.

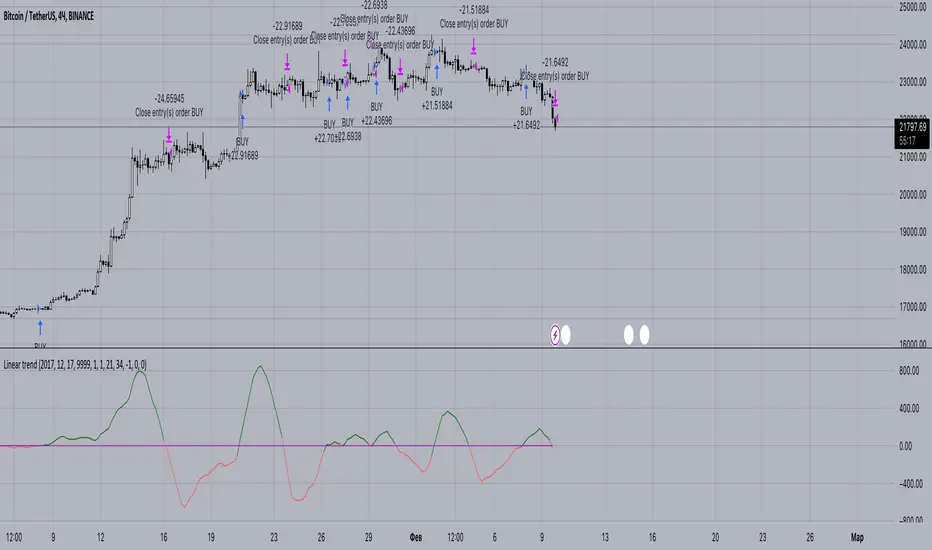
Linear trendThis oscillator based on linear regression . By subtracting the slower LMA from the faster LMA we can get a value, which we will further compare with zero. If the resulting difference is greater than 0, then we can assume that the trend is upward. Also by using offset we could increase the expected profit (focusing on backtest data).
You could get access for this script by the link below.
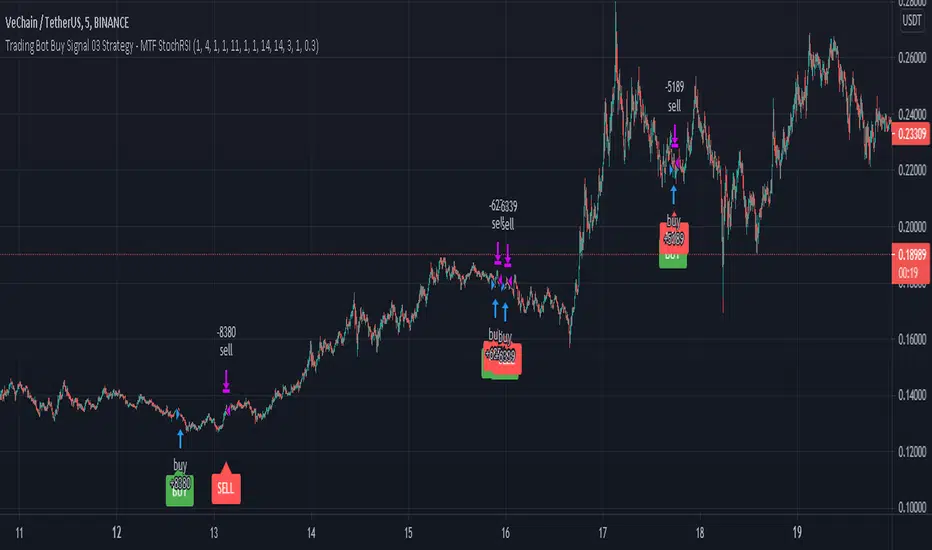
Trading Bot Buy Signal 03 Strategy - MTF StochRSIWelcome to our third Tradingview strategy.
We develop signals which have been specially developed for crypto trading bots. We publish new indicators at regular intervals.
This strategy is based on our "Trading Bot Buy Signal 03 - MTF StochRSI" indicator, so that you can apply and test this strategy to your charts/pairs.
The basic idea of this script is to use the stochastic RSI indicator in multiple Timeframes. When all selected timeframes show an oversold and in 5 Min Timeframe is an crossover, it triggers a solid buy signal. This strategy is relatively robust against false breakouts, even if these can of course never be avoided. These signals occur relatively rare, but you can set an alarm up on different pairs simultaneously. The strategy needs to be set up in 5 min chart cause of an additional crossover buy condition. It wasnt tested in Forex etc. but feel free to test it.
The sell strategy is based on trailing sell and not indicator based cause we believe in the power of long term uptrending crypto, compounding and dont want to sell at a loss in a false breakout. You can set the trailing sell limit to your own preferences or leave it at default value. Our goal is to reduce the average coin holding time to a minimum.
This strategy using different timeframes so it is sending a repainting warning. Cause it calculates values in a different timeframe. But thats normal and it wont recalculate results.
Feel free to adjust the parameters to your preferences:
- Adjust the values of Stoch - K and Length of RSI and Main Stoch to change the sensitivity of the indicator
- Turn on different timeframes or leave default timeframes
- Adjust the oversold Limit of the StochRSI indicator to change results
- Adjusting the trailing sell parameters influences the coin holding time and the results
If there are questions, write them into the comments or contact us directly over the direct message. Happy Trading!
Combo Backtest 123 Reversal & N Bars Up This is combo strategies for get a cumulative signal.
First strategy
This System was created from the Book "How I Tripled My Money In The
Futures Market" by Ulf Jensen, Page 183. This is reverse type of strategies.
The strategy buys at market, if close price is higher than the previous close
during 2 days and the meaning of 9-days Stochastic Slow Oscillator is lower than 50.
The strategy sells at market, if close price is lower than the previous close price
during 2 days and the meaning of 9-days Stochastic Fast Oscillator is higher than 50.
Second strategy
Evaluates for n number of consecutive higher closes. Returns a value
of 1 when the condition is true or 0 when false.
WARNING:
- For purpose educate only
- This script to change bars colors.

Trading Bot Buy Signal 02 Strategy - MTF StochasticWelcome to our second Tradingview strategy.
We develop signals which have been specially developed for crypto trading bots. We publish new indicators at regular intervals.
This strategy is based on our "Trading Bot Buy Signal 02 - MTF Stochastic" indicator, so that you can apply and test this strategy to your charts/pairs.
The basic idea of this script is to use the stochastic indicator in multiple Timeframes. When all selected timeframes show an oversold it triggers a solid buy signal. This strategy is relatively robust against false breakouts, even if these can of course never be avoided. These signals occur relatively rare, but you can set an alarm up on different pairs simultaneously. The strategy works best in 5 min chart and in crypto pairs. It wasnt tested in Forex etc. but feel free to test it.
The sell strategy is based on trailing sell and not indicator based cause we believe in the power of long term uptrending crypto, compounding and dont want to sell at a loss in a false breakout. You can set the trailing sell limit to your own preferences or leave it at default value. Our goal is to reduce the average coin holding time to a minimum.
This strategy using different timeframes so it is sending a repainting warning. Cause it calculates values in a different timeframe. But thats normal and it wont recalculate results.
Feel free to adjust the parameters to your preferences:
- Adjust the values of Stoch - K and Stoch - D to change the sensitivity of the indicator
- Turn on different timeframes or leave default timeframes
- Adjust the threshold value of the stoch indicator to change results
- Adjusting the trailing sell parameters influences the coin holding time and the results
If there are questions, write them into the comments or contact us directly over the direct message. Happy Trading!

Dankland Playground DCAing multi-strategy OPThis is essentially a script that I made for myself before deciding it may be good enough for you all as well.
How it works basically is this... you have 18 oscillators which can all be used as independently as you wish. That means there are 20 groups which they can be split amongst as you choose.
When in separate groups they should not be able to sell eachothers positions without triggering a stop loss. Every single oscillator has its own position sizing and exit sizing which can be stated as either a percent of balance or a flat amount of contracts. Each oscillator has a minimum amount of profit you can tell it to sell it, which is calculated from the average cost of your current position, which does include all groups. This works out to help you average out better entry and exit prices, essentially a method of DCAing.
You can set the minimum sale amount, which is to keep it from placing orders below your exchanges minimum dollar trade cost.
The included oscillators are as follows:
Chande Momentum cross
Moving Average Cross
MACD cross
%B Bollinger cross
Stochastic cross + region filter
Stochastic RSI cross + region filter
SMII cross and region
Three RMIs
Standard RSI
LSMA-smoothed RSI
Know Sure Thing
RSI of KST
Coppock Curve
RSI of Curve
PPO
RSI of PPO
Trix
RSI of Trix
So the idea is that this is essentially multiple strategies combined into one backtestable house. Balance is calculated for all position sizes in order to try to prevent false entries that plague so many scripts (IE, you set pyramiding to 2, each buy $1000, initial balance $1000, and yet it buys two orders off the bat for $2000 total and nets 400% profit because the second was considered free)/
You tune each side and position size them so that they work together as well as you can and in doing so you are able to create a single backtest that is capable of running a bot, essentially, between multiple strategies - you can run a slower Moving Average cross, a faster SMI cross or MACD, or Bollinger that grabs big moves only, all the while having MACD trade small bonuses along the way. This way you can weight the Risk to Reward of each against eachother.
I will not try to claim this is something you can open and with no work have the best bot on the planet. This scripts intention is to take a lot of relatively common trading strategies and combine them under on roof with some risk management and the ability to weigh each against eachother.
If you are looking for a super advanced singular algorithm that tries to capture every peak and valley exactly on the dot, this is not for you. If you are looking for a tool with a high level of customizability, with a publisher who intends to update it to the best of his ability in accordance to seeking to make the best product that I personally can make for both myself and the community (because I will be using this myself of course!) that was specifically designed with the intention of performing well in spot markets by averaging low entry costs and high exit costs, this is for you! That is the exact intention here.
I do not trade margin currently, I trade spot. I am sure this script can be tuned to work on margin but this is not my intention or area so if this is you and there is something you need for margin specifically implemented, ask, because I likely don't know what you need yet.
The current backtest shown is hand-optimized by myself for BTC/USD 1hr market with NO stop loss enabled and all sales weighed to be around 0% minimum profit from the total average entry cost.
I chose to run it myself with no stop losses because Bitcoin is so bullish to me. The stop losses can still be very profitable, but not 1495% net profit. This style of automation is not for everyone as when running with no stop loss and the requirement every sale is somewhat profitable, or at least no very noticeable loss, you wind up relying on yourself to manually stop out if things crash too much and the bot has to stop trading to wait for market to go back up. The thing to do here if you are playing without a stop loss is to have your own alerts set at your fear level, a % drop in a period of time or something like that, and when you reach that point I would consider resetting the bot so it continues to take trades. I personally will accept a temporary drop in USD as long as I can keep my BTC holdings up overall as the goal should always be to have as many BTC as possible by the start and end of the bull run.

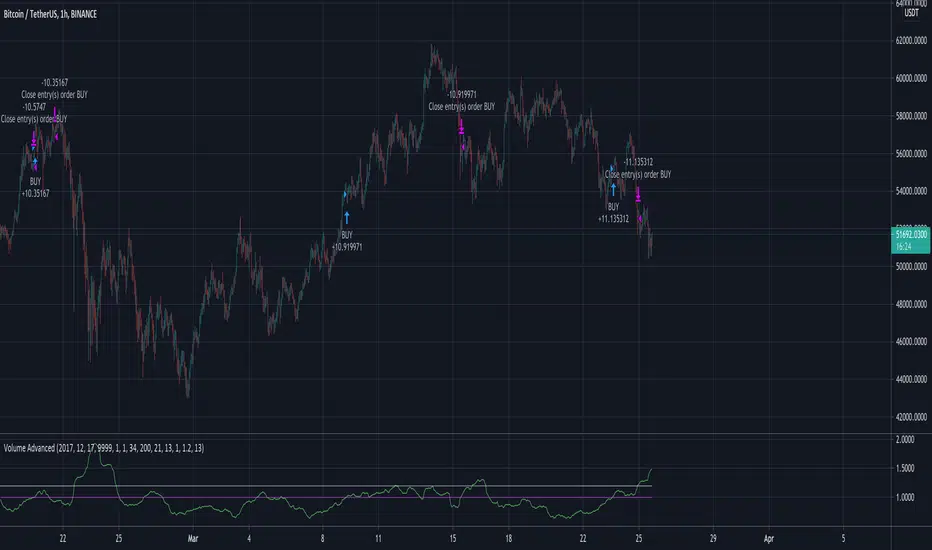
Volume AdvancedI have found out this script some time ago. In fact it is not my code (just have modified a little) and I don't know the author (couldn't find). So now I would like to share with the community, maybe somebody would have some idea how to make it better. The script itself is modified volatility oscillator (like ATR) based on volume, making a deal at the moment of price change. To recognize the current trend I have add simple function just to compare the current price with the N bars before, because sometimes in moments of high volatility there may be wrong signals.
Combo Backtest 123 Reversal & N Bars Down This is combo strategies for get a cumulative signal.
First strategy
This System was created from the Book "How I Tripled My Money In The
Futures Market" by Ulf Jensen, Page 183. This is reverse type of strategies.
The strategy buys at market, if close price is higher than the previous close
during 2 days and the meaning of 9-days Stochastic Slow Oscillator is lower than 50.
The strategy sells at market, if close price is lower than the previous close price
during 2 days and the meaning of 9-days Stochastic Fast Oscillator is higher than 50.
Second strategy
Evaluates for n number of consecutive lower closes. Returns a value
of 1 when the condition is true or 0 when false.
WARNING:
- For purpose educate only
- This script to change bars colors.

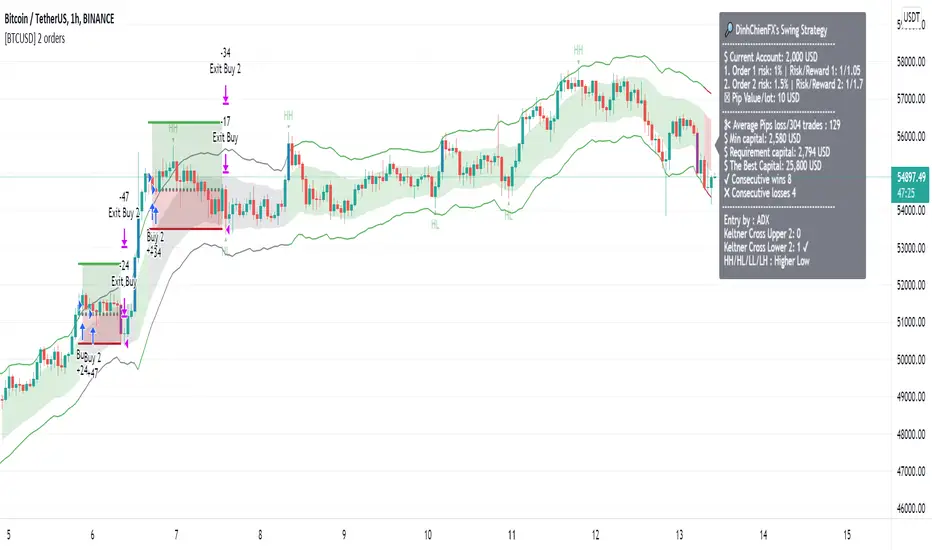
[BTCUSD] DinhChienFX [2 orders]* Historical statistics from 2018:
* Strategy will enter 2 orders, Order 2 will appear only when there is Order 1:
- Percent profitable of 1st order: 64.76%.
- Percent profitable of 2nd order: 49.86%.
- Average percent profitable: 57.31%.
- 14 consecutive wins.
- 4 consecutive losses.
Order 1: risk / reward ratio 1/1 used to determine if this rule is effective or not?
Order 2: Appears when there is order 1, Use take-profit and take-loss level of order 1 at Fibonacci 75%.
. * 1st Order conditions:
- Buy: When the ADX index cuts up to 45, check earlier if the closing price has cut up and is above the Upper 2 line, enter the Buy order.
- Sell: when the ADX indicator cuts up to 45, check before that if the closing price has cut down and is above Lower 2 then enter a Sell order.
* How to enter Order 2: When order 1 appears, there are always Stoploss and Takeprofit levels. Draw Fibonacci from take-profit and take-loss prices, Fibonacci retracement level = 75%
----------------
1. Trend identification:
- Channel Keltner:
... Uptrend: when the closing candlestick cuts up and is above the Keltner channel, the Upper Line 2
... Down trend: when the candle closes and falls above the Keltner Line Lower 2
2. Rules of entry:
- Channel Keltner:
... Buy: Candlestick closing price cuts up and above the Keltner Upper 2.
... Sell: The closing price of the candle cuts down and is lower than the Keltner Below 2.
ADX indicator:
... Buy: The ADX value crossed to 45 and the close of the candle was higher than Keltner Upper 2.
... Sell: ADX value cuts to 45 and the close of the candle is lower than Keltner Below 2.
3. Stoploss and Profit = atr (20) * 2.