OG SuperTrend + RSI Option + Enhanced ORB v2 © 2025This elite-level indicator combines the precision of SuperTrend and RSI signals with a mathematically accurate Opening Range Breakout (ORB) system and Previous Day High/Low zones, providing traders with real-time directional bias and sniper-level entry guidance.
🔍 Core Features:
✅ SuperTrend + RSI Buy/Sell Signals
✅ Real-time RSI Tracker (Top Right)
✅ Clean visual BUY/SELL labels on trend shifts
✅ Mathematically accurate 5-Min & 10-Min ORB Levels
✅ Live tracking of Previous Day High/Low Zones
✅ Clean chart layout with elite color-coded precision
✅ Instant alert conditions for both bullish and bearish setups
🔔 Recommended Use:
Combine with price action, candlestick patterns, and volume spikes
Ideal for options flow, intraday scalping, and breakout strategies
Works beautifully on 1m, 5m, 15m, and 1H timeframes
📊 Settings Include:
Adjustable ATR Period & SuperTrend Multiplier
Toggle Buy/Sell Labels
Customizable RSI Length
Orb

GeeksDoByte 15m & 30m ORB + Prev Day High/LowCME_MINI:NQ1!
How It Works
Opening Ranges
At 9:30 ET, the script begins tracking the high & low.
It uses two fixed sessions:
15 min from 09:30 to 09:45
30 min from 09:30 to 10:00
On the very first bar of each session it initializes the range, then continuously updates the high/low on each new intraday bar.
Dashed lines are drawn when the session opens and extended horizontally across subsequent bars.
Previous Day’s Levels
Independently, it fetches yesterday’s high and low via a daily security call.
These historic levels are plotted as simple horizontal lines for daily context.
How to Use
Breakout Entries
A close above the 15 min ORB high can signal an early breakout; a further push above the 30 min ORB high confirms extended momentum.
Conversely, breaks below the respective lows can indicate short setups.
Support & Resistance
Yesterday’s high/low often act as magnet levels. If price is near the previous high when the opening ranges break, you get a confluence zone worth watching.
Trade Management
Combine the two opening-range levels to tier your stops or scale in.
For example, you might place an initial stop below the 15 min low and a wider stop below the 30 min low.

ORB NormanORB with adjustable times for up to 3 ORB's.
High and Low for each defined timeframe with adjustable lenghts for each day.

Open Range Breakout (ORB) with Alerts
🚀 ChartsAlgo – Open Range Breakout (ORB) with Alerts
The Open Range Breakout (ORB) Indicator by ChartsAlg is designed for intraday traders looking to capitalize on price movements after the market’s opening range. This tool is especially effective for futures (MNQ, MES) and high-volatility stocks or crypto where initial volatility sets the tone for the session.
This indicator identifies a user-defined opening range window, plots the high/low lines of that range, and visually alerts users when price breaks out above or below the range — with options to customize breakout repetitions, background fill, and alerts.
💡 What is an Open Range Breakout (ORB)?
The opening range represents the high and low established during the first few minutes of the trading session — usually 15 or 30 minutes. Many intraday strategies are based on the idea that breaking out of this initial range often signals strong momentum and trend continuation.
Traders often enter:
Long when price breaks above the range high.
Short when price breaks below the range low.
⚙️ How It Works
You define a session window (e.g., 09:30–09:45 EST).
The indicator tracks the high and low during this time.
Once the session ends, the high and low become your range breakout levels.
The indicator then:
Plots lines for visual clarity
Optionally fills background between the range
Triggers breakout signals if price crosses the levels
Provides alerts when breakouts occur
🛠️ Settings Breakdown
🔹 Session Settings
Range Session: Set your preferred window (e.g., 0930–0945). Can be premarket, first 30 mins, or any custom time.
Time zone: Use "America/New York" for EST (default) or change to "GMT+0" for international traders.
🔹 Breakout Settings
Bullish Breakout Signals: Number of allowed breakout alerts above the range.
Bearish Breakout Signals: Number of allowed breakout alerts below the range.
This prevents repeated alerts once breakout has been confirmed.
🔹 Display Settings
Show Background Fill: Fills area between high/low of the range for easier visual analysis.
Show Breakout Signals: Triangle markers plotted on the chart when breakouts happen.
Only Show Today’s Range: Keeps the chart clean by showing only the most current day’s range.
🔹 Color Settings
Range High/Low Line Colors: Choose any color for clarity.
Range Fill Color: Customize the highlight area for your chart style.
📊 Chart Features
Range High/Low Lines: Automatically plotted after range session ends.
Visual Fill Box: Optional background shading between the opening range.
Triangle Breakout Markers: Appear at the breakout candle.
Alerts: Can be used with TradingView’s alert system to notify you of breakouts in real-time.
🔔 Alerts
Two alert conditions are built in:
Bullish Breakout: Triggers when price breaks above the high of the range.
Bearish Breakout: Triggers when price breaks below the low of the range.
Example Alert Message:
📈 “Bullish Breakout above Open Range on AAPL!”
To activate:
Click “🔔 Alerts” on TradingView.
Set condition to this script.
Choose “ORB Breakout Up” or “ORB Breakout Down”.
Choose alert frequency and notification method.
⚠️ DISCLAIMER
ChartsAlgo tools are for informational and educational purposes only.
They are not financial advice or signals. Past performance does not guarantee future results. Use at your own risk and always implement solid risk management.
By using this indicator, you agree that you are solely responsible for any trades or decisions made based on the information provided.

[IX] 15min ORB + Volume Trend DeltaIX 15-Minute ORB + Trend Volume Delta
A powerful intraday tool that combines Opening-Range Breakouts with a real-time volume delta tracker and adaptive trend logic—built for traders who want to stay on the right side of momentum and liquidity.
🔹 WHAT THIS INDICATOR DOES
• Automatically draws the Opening Range (ORB) for London (07:00–07:15 UTC) and New York (13:30–13:45 UTC) sessions.
• Once the ORB is set, it highlights the high and low levels throughout the session.
• Adds key previous levels: yesterday’s High, Low, Open and the most recent 4H High/Low.
• Includes a Trend MA with ±2× ATR(200) bands to define bullish/bearish market conditions.
• Tracks buy vs sell volume within the current trend regime and shows it live on your chart as a percentage delta.
🔹 HOW TO USE IT
Set your chart to 5-minute timeframe (or any intraday timeframe up to the selected ORB window).
When the session begins, the script automatically locks in the ORB zone.
Once the ORB is formed:
• If price breaks and holds above the ORB ➤ focus on longs.
• If price breaks and holds below the ORB ➤ focus on shorts.
Use the Trend Volume Delta as confirmation—strong buy delta supports longs, strong sell delta supports shorts.
Targets and support/resistance can be aligned with previous Daily / 4H levels.
🔹 TREND FILTER & VOLUME DELTA
• The adaptive trend MA uses CMO-based weighting, becoming more responsive during momentum shifts and more stable during chop.
• Trend regime is defined by price closing above or below the ±2× ATR bands.
• While inside a regime (bullish or bearish), the script accumulates volume:
– Bullish = volume from green candles (close > open)
– Bearish = volume from red candles (close < open)
• Displays total buy/sell volume and the percentage delta live in a compact table.
🔹 CUSTOMIZATION OPTIONS
• ORB duration (1–15 min)
• Custom session times for London and New York
• Toggle display for ORBs, previous levels (Daily / 4H), volume delta table, watermark
• Fully adjustable ORB and trend colors
• Trend/Momentum settings, table size and position
🔹 ALERTS INCLUDED
• Price breaking above or below the London or NY ORB
• Alerts only trigger after the ORB is set—perfect for breakout entries
🔹 WHY THIS MATTERS
• ORBs are used by institutional traders to define the day’s first true directional intent
• Trend filter avoids chasing noise by adjusting to volatility
• Volume Delta shows who’s in control—buyers or sellers
• Previous levels give natural reaction points for entries, stops, and targets
🔹 DISCLAIMER
This indicator is for educational use only. Not financial advice. Always do your own research and manage risk responsibly.
🔹 JOIN THE COMMUNITY
Want more free tools like this?
Join the free IXTradingHub Discord to access additional indicators, trading resources, and live discussions.
Or check out our VIP suite if you’re ready to take your trading to the next level and start building consistent profitability.
→ Visit IXTradingHub.com to get started.

Simple Sessions & LevelsWhat this indicator does:
This script marks out two essential types of price levels for intraday and swing traders:
The high and low of a customizable 15-minute opening range after the market/session open.
The previous day’s high, midpoint (“halfback”), and low.
How it works:
The script lets you set the session start time (hour and minute) to match your market.
It then calculates the high and low of the first 15 minutes after the session opens and plots those as solid lines.
It also plots the prior day’s high, halfback (midpoint), and low on your chart for easy reference.
Each line and each label can be toggled on or off independently in the settings for maximum customization.
Colors for each level are also fully customizable.
How to use it:
Add the script to your chart.
Set the session start hour and minute to match the open of the market or instrument you trade.
Choose which levels and labels you want displayed by using the toggles in the settings.
The indicator will automatically draw the session range and prior day levels for you.
Use these lines as reference for key support, resistance, and potential trade entry/exit points.
What makes it unique and useful:
This tool combines a flexible session opening range with classic daily reference levels in one package. You have complete control over which levels and labels are shown, making it adaptable for any trading style. It’s especially useful for day traders who want to quickly identify volatility windows and the most important price levels from the previous session.

Opening Range Breakout (15 mins Range)Take the guesswork out of your trading with the Opening Range Breakout Pro script. This tool automatically marks the high and low of the first 15 minutes of the NYSE session, then highlights the first candle to break out above or below this range—removing ambiguity from your trade entries.
The opening range is one of the most powerful concepts in day trading. By identifying the price range set during the market’s first minutes, you gain a clear framework for your trades. When price breaks out above the range, it often signals a strong bullish move; a break below signals bearish momentum. This script visually marks these moments, so you can react quickly and confidently.
Why use Opening Range Breakout Pro?
• Defined Entry and Exit Points: The script gives you clear, objective breakout levels—no more guessing when to enter a trade.
• Removes Emotional Trading: With visual cues for breakouts, you can follow a systematic approach and avoid hesitation or FOMO.
• Backtested, Time-Tested Strategy: The opening range breakout has been used by professional traders for decades to capture early trends and maximize profit potential.
• High Reward Potential: By capitalizing on the volatility and momentum of the opening session, traders often catch the best moves of the day.
• Easy to Use: Just add to your chart—no configuration needed. The script works on any NYSE stock, on a 5-minute chart.
How it works:
• Draws the opening 15-minute high and low as orange lines.
• Labels the range prices for quick reference.
• Marks the first candle to close above the range with an orange ▲, and the first to close below with an orange ▼.
Take control of your trading day, remove uncertainty, and trade with confidence—just like the pros.

Worldwide Sessions and Open Range BreakoutThis script shows when the various normal market hours for each of the major worldwide markets (Asia, New York, and London). It also draws a line on the opening range for each of these market sessions. The opening range defaults to the first 15 minutes of the session, but this can be customized.
This script does automatically handle the session times regardless of your time zone or what time frame you are on. No need to set anything! This probably can't handle non-normal trading days, such as partial days.
This script is made for futures, but would likely work for other markets, like Forex.

15Min Opening Range & Midline (UTC+2) This TradingView script draws the 15-minute Opening Range of the day based on a user-defined start time and plots the high, low, and midline of this range. It works by capturing the high and low of the first 15 minutes of the session, and then extending them for the rest of the trading day. The midline is calculated as the average of the high and low values.
Key Features:
User-configurable start time: Define the hour and minute for when the opening range should start based on your local time zone.
Line customization: Choose the color and line style (solid, dashed, dotted) for the high, low, and midline.
Easy-to-read visual representation: The high and low lines extend across the chart from the range start, with the midline placed in the center.
Dynamic updates: The indicator resets at the start of each new trading day and updates the opening range lines accordingly.
Perfect for:
Traders looking to monitor the initial market range during the first 15 minutes of trading.
Identifying key support and resistance levels based on early price action.
Providing a midline to assess market bias and potential breakouts.
Notes:
The indicator calculates everything based on the local time zone you define and automatically adjusts to your desired start time.
It will not redraw lines; once drawn, they remain on the chart until the next session.
NY Opening Range Breakout - MA StopCore Concept
This strategy trades breakouts from the New York opening range (9:30-9:45 AM NY time) on intraday timeframes, designed for scalping and day trading.
Setup Requirements
Timeframe: Works on any timeframe under 15 minutes (1m, 2m, 3m, 5m, 10m)
Session: New York market hours
Range Period: 9:30-9:45 AM NY time (15-minute opening range)
Entry Rules
Long Entries:
Wait for a candle to close above the opening range high
Enter long on the next candle (before 12:00 PM NY time)
Must be above moving average if using MA-based take profit
Short Entries:
Wait for a candle to close below the opening range low
Enter short on the next candle (before 12:00 PM NY time)
Must be below moving average if using MA-based take profit
Risk Management
Stop Loss:
Long trades: Opening range low
Short trades: Opening range high
Take Profit Options:
Fixed Risk Reward: 1.5x the range size (customizable ratio)
Moving Average: Exit when price crosses back through MA
Both: Whichever comes first
Key Features
Trade Direction Options:
Long Only
Short Only
Both directions
Moving Average Filter:
Prevents entries that would immediately hit stop loss
Uses EMA/SMA/WMA/VWMA with customizable length
Acts as dynamic support/resistance
Time Restrictions:
No entries after 12:00 PM NY time (customizable cutoff)
One trade per direction per day
Daily reset of all variables
Visual Elements
Red/green lines showing opening range
Purple line for moving average
Entry and breakout signals with shapes
Take profit and stop loss levels plotted
Information table with current status
Strategy Logic Flow
Morning: Capture 9:30-9:45 range high/low
Wait: Monitor for breakout (previous candle close outside range)
Filter: Check MA condition if using MA-based exits
Enter: Trade on next candle after breakout
Manage: Exit at fixed TP, MA cross, or stop loss
Reset: Start fresh next trading day
This is a momentum-based breakout strategy that capitalizes on early market volatility while using the opening range as natural support/resistance levels.

Opening Range Breakout Detector📈 Opening Range Breakout Detector (TF-Independent)
Tracks breakouts with precision. No matter the chart, no matter the timeframe.
This indicator monitors whether price breaks above or below the Opening Range across multiple key durations — 1m, 5m, 10m, 15m, 30m, 45m, and 60m — using 1-minute data under the hood, while you can work on higher timeframe charts (daily, etc.).
Highlights:
✅ Status table shows which ORs broke UP or DOWN
⏱ Control which timeframes to track
🖼 Customizable table position, size and colors
Crafted by @FunkyQuokka

OpeningRange (Trading_Tix)Purpose:
The indicator highlights the high, low, and middle (50%) price levels of a specified session's opening range. These levels can serve as key support and resistance zones for trading strategies. The indicator also offers options to extend these levels beyond the session into later timeframes, making it useful for tracking breakout or trend continuation setups.
Key Features:
1. Session Detection:
The indicator identifies a specific session period using the user-defined Session Time. It calculates the start time, high, and low prices during this period:
rangeTime: Defines the session time range (default: 5:00 PM to 2:59 AM).
extendTime: Defines the extended time range where lines/backgrounds can be prolonged.
2. Opening Range Calculation:
High (high_val) and Low (low_val)**:
Tracks the highest and lowest prices during the session.
Middle Line:
A midpoint is calculated by averaging high_val and low_val.
3. Visual Elements:
Horizontal Lines:
Drawn at the high, low, and middle levels.
Customizable in width and color.
Shaded Background Box:
Covers the range between high and low prices.
The box’s color and transparency can be adjusted.
Line and Box Extension:
Optionally extends these elements into the extended time range.
4. Customization:
Users have the flexibility to:
Toggle visibility of lines, middle line, and background box.
Adjust colors, line thickness, and style.
Enable or disable the extension of lines and backgrounds into the extended period.
How It Works:
Initialization:
The script initializes variables to store range data (startTime, high_val, low_val) and drawing objects (lines, boxes).
It detects whether the current bar falls within the session (inSession) or extended timeframe (inExtend).
Plotting:
During the session:
Deletes previous lines and boxes from prior sessions.
Draws new lines at the high, low, and middle levels.
Creates a background box covering the range, if enabled.
During the extended period:
Extends the session lines and box, if the user has opted for extensions.
Updates:
Continuously adjusts the high/low values and updates the lines as new price data arrives.
Use Cases:
This indicator can be valuable for traders who:
Use the opening range to identify potential breakout zones.
Trade based on price consolidation within the range.
Want a visual representation of key price levels to plan entries and exits.
Would you like help refining this script further or adjusting its settings to match your trading style?

London ORB + Session High/Low + FVGLondon ORB + Session High/Low + FVG
📘 Script Description: London ORB + Session High/Low + Fair Value Gap
This script is designed to assist intraday traders during the London session open by combining:
🕒 1. Opening Range Breakout (ORB)
Captures the high and low of the first 15-minute candle after the London open (08:00–08:15 GMT).
Draws lines and labels for the ORB High and Low levels.
Detects breakouts above or below the ORB and plots a triangle signal at the breakout bar.
🌐 2. Asian & US Session Levels
Automatically marks the highs and lows of the Asian (00:00–06:00 GMT) and US (13:30–20:00 GMT) sessions.
Useful for identifying prior session liquidity zones, key support/resistance levels, and potential reaction areas.
📉 3. Fair Value Gaps (FVG)
Highlights imbalances in price action between non-overlapping candles (also known as FVGs or inefficiencies).
Draws a shaded box between candles where gaps exist:
Green for bullish FVGs
Red for bearish FVGs
🔔 4. Alert Support
Optional alerts are built in for:
Long breakout (price breaks above ORB)
Short breakout (price breaks below ORB)
🎯 Use Case
Perfect for:
Day traders looking to capitalize on early volatility at the London open
Traders using liquidity-based strategies, retests, or gap-fills
Visualizing and aligning with prior session highs/lows for structure and context

Rogue ORB PRORogue ORB Pro is a precision-engineered Opening Range Breakout (ORB) indicator built for active intraday traders who need real signals, not noise.
This tool identifies high-probability breakout entries from the opening range, enhanced with optional ATR-based stop loss levels, deviation targets, cooldown filters, and a relative volume gate to filter weak setups.
🔍 Key Features:
Opening Range High/Low: Drawn from a user-defined time window and locked for the day
Deviations: Automatically plots target zones above and below the OR range (e.g. 1, 2 deviations)
Pre-Market Levels: Automatically draws pre market high and low lines at the end of pre market session
Buy/Sell Signals: Triggered on breakout of the OR High/Low with configurable breakout logic (touch or close)
ATR Stop Loss Line: Dynamically drawn at a fixed ATR distance from breakout candle, with optional SL label
Cooldown Period: Prevents back-to-back signals by enforcing a user-defined bar delay between entries, can help with overtrading
Volume Filter: Optional relative volume filter that requires breakout candles to exceed a custom volume threshold
VWAP Overlay: Visual VWAP for directional bias and confluence

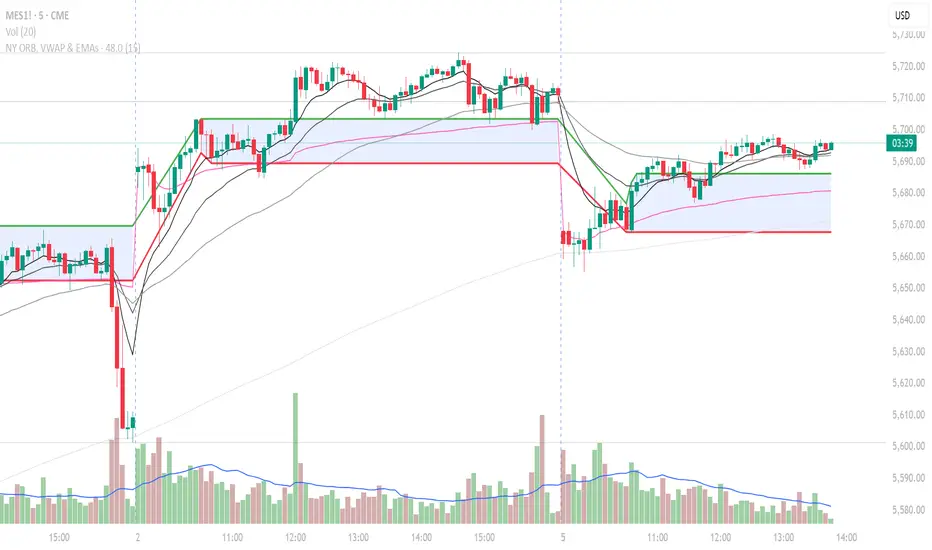
NY ORB, VWAP & EMAsIndicator is designed to display key technical analysis tools on your Trading View chart. It includes:
One of the key benefits of this indicator is that it allows Basic Trading View users to set VWAP, EMAs, and ORB in a single indicator. This is particularly useful for users who are limited to a single indicator on their Basic plan, as it provides a comprehensive view of market sentiment, trend, and potential breakouts without the need for multiple indicators.
Features
New York Opening Range Breakout (ORB): Plots the high and low of the first 15 minutes (configurable) of the New York trading session.
Volume Weighted Average Price (VWAP): Displays the VWAP line, which can be toggled on or off.
Exponential Moving Averages (EMAs): Plots four EMAs (9, 21, 50, and 200 periods), which can also be toggled on or off.
Customization
ORB Length: Choose from 5 or 15 minutes for the ORB calculation.
Show VWAP and EMAs: Toggle the visibility of the VWAP and EMA lines on or off.
Usage
This indicator is designed to help traders identify key market levels, trends, and potential breakouts during the New York trading session. The ORB can be used to gauge market sentiment, while the VWAP provides a benchmark for average price action. The EMAs offer additional trend analysis and can be used to identify potential support and resistance levels.
ORB - Futures and Stocks (Breakouts + Alerts + ORB Selector)This indicator shows the Opening Range Breakout (ORB) based on the time range you choose.
Important:
It only works for intraday trading on time frames less than 1 day (like 1-minute, 5-minute, or hourly charts).
You can use it with any stock or futures, such as US500, NAS100, or GER40.
Inputs:
ORB Range - Your preference.
Session Start
Time Zone Offset
Examples:
for EU Frankfurt, DAX (GER40):
Set your ORB range
Session Start 0900
Time Zone Offset +1
For US Stock Market and US500, NAS100:
Set your ORB range
Session Start 0930
Time Zone Offset -5
Created using ChatGPT

US Market ORB with Volume SpikeHow to Use:
Apply to US stocks/ETFs (works best on 1-5 minute charts)
Default settings work for NYSE/NASDAQ market hours
Blue background shows ORB formation period
Orange highlights indicate volume spikes
Buy/Sell signals appear at breakouts with volume confirmation

PumpC Opening Range Breakout (ORB) Stretch RangePumpC ORB Stretch
The PumpC ORB Stretch is a volatility-based indicator that helps traders identify potential breakout zones by analyzing how price typically behaves around the open. This tool is inspired by concepts introduced by Toby Crabel in his well-known book “Day Trading with Short-Term Price Patterns and Opening Range Breakout.”
Rather than predicting market direction, this indicator highlights areas where price is likely to expand based on recent volatility. It is designed for traders who prefer dynamic, data-driven breakout levels over static support and resistance zones.
What Is the "Stretch"?
In Toby Crabel’s framework, the Stretch is the average of the smaller of two price moves:
The distance from the open to the high of the bar
The distance from the open to the low of the bar
This smaller value captures the “quiet side” of the candle and reflects recent price compression. Averaged over multiple periods (commonly 10 daily bars), it creates a baseline to assess how far price may move away from the open under typical market conditions.
How the Indicator Works
The PumpC ORB Stretch follows this process:
Uses a higher timeframe (such as daily) to calculate the open, high, and low.
For each bar, measures the smaller of the two distances: open to high or open to low.
Applies a moving average to the result over a user-defined number of bars (default is 10).
Multiplies the average stretch by customizable levels (e.g., 0.382, 1.0, 2.0).
Plots breakout levels above and below the open of the selected timeframe.
The result is a set of adaptive levels that expand or contract with market volatility.
Customization Options
Stretch Timeframe: Choose the timeframe used for stretch calculation (default: Daily).
Stretch Length: Set the number of bars to include in the moving average.
Breakout Levels: Enable or disable individual levels and define multipliers.
Color Settings: Customize colors for each range level for easy visual distinction.
Plot Style: Circular markers are used to reduce chart clutter and improve readability.
How to Use It
Use plotted levels to anticipate possible breakouts from the open.
Adjust stretch length to reflect short-term or longer-term volatility trends.
Combine this tool with momentum indicators, volume, or price action for confirmation.
Use levels to help guide stop placement or profit targets in breakout strategies.
Important Notes
This script is based on an interpretation of Crabel’s concepts and is not affiliated with Crabel Capital or the original author.
The indicator does not predict direction; it is a tool for context and structure.
It is recommended that users test and validate this tool in a simulated environment before applying it to live trading.
This indicator is intended for educational purposes only.
Licensing and Attribution
This script is built entirely in Pine Script v5 and follows TradingView’s open-source standards. It does not include any third-party or proprietary code. If you modify or share it, please credit the original idea and follow all TradingView script publishing rules.

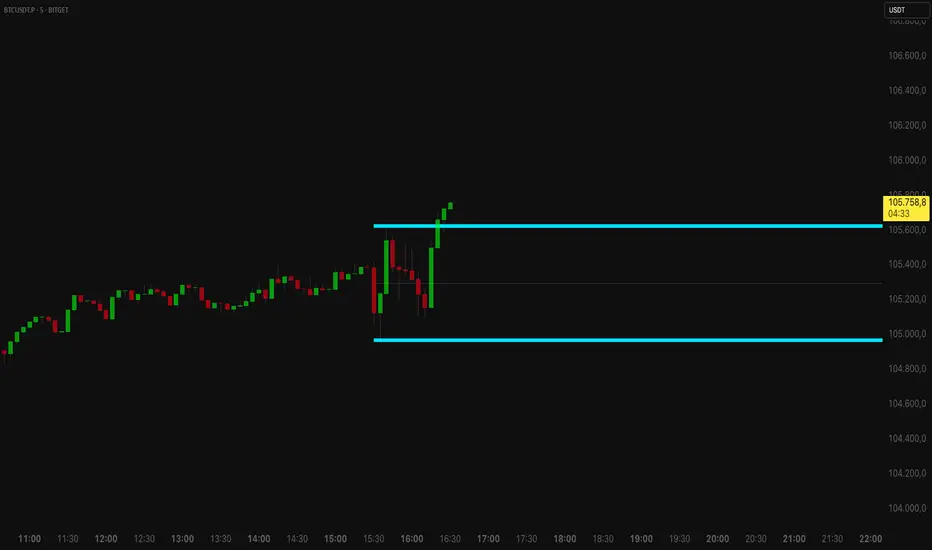
Opening Range BreakoutThis is an Opening Range Breakout script. It will plot the opening range high and low (green and red lines, respectively) as determined by the user input (default is a 15 min window from market open, 9:30 - 9:45 am). The time period for the breakout is also configured by a user input (default is from 9:45 am - 2:30 pm).
Alerts are sent for breakouts either above (bullish) or below (bearish) the opening range high and low. An EMA is also used for trend confirmation before sending alerts for breakouts (to avoid false signals).
A bullish breakout is determined by all of the following being true:
- The current price being above the opening range high (green line)
- The EMA trending up (ie the current value of the EMA > prior EMA value)
- The current price is > the EMA
- The EMA is > the opening range high
A bearish breakout is determined by all of the following being true:
- The current price being below the opening range low (red line)
- The EMA trending down (ie the current value of the EMA < prior EMA value)
- The current price is < the EMA
- the EMA is < the opening range low
Enjoy this simple indicator!

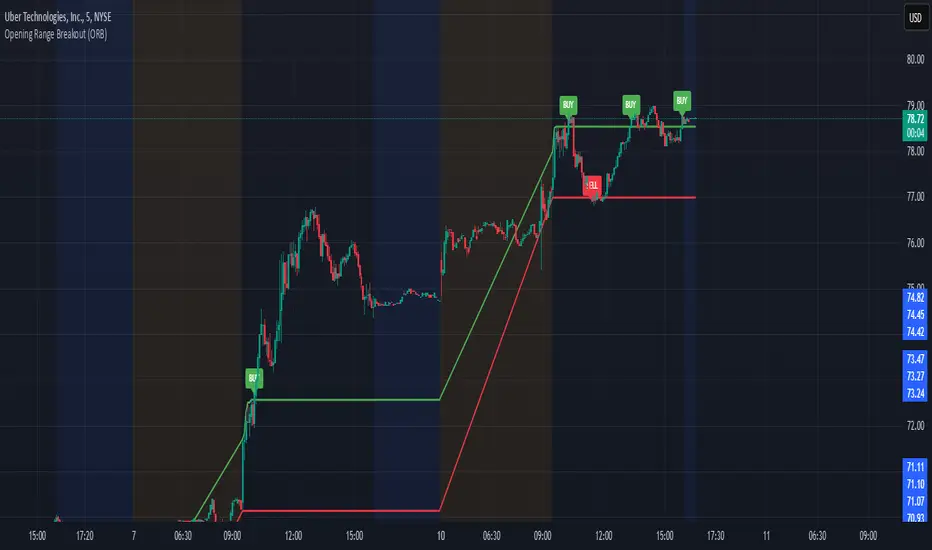
Opening Range Breakout (ORB)This is an Opening Range Break indicator. Best if used on a 5 minute chart. It plots the opening 30 minutes high and low of a ticker. (meaning mostly for stocks, options, etfs) and then it alerts a buy signal upon break of opening high and a sell signal upon break of opening low. This is a day trading type of indicator and there is a new opening range everyday.
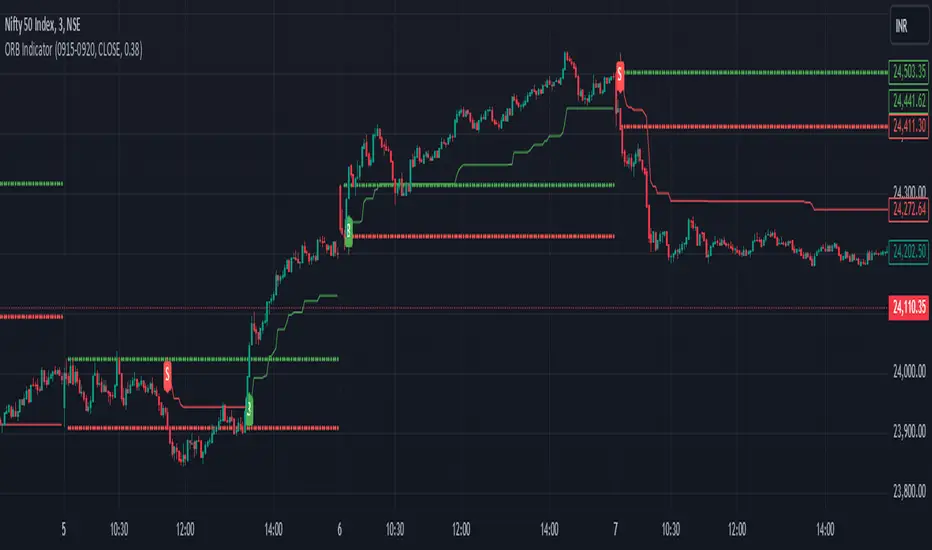
ORB opening range breakoutThis indicator plots the opening range high and low for a selected period of time in minutes after the market opens on an intraday chart to allow the user to visualize the high and low of the opening range for use in the Opening Range Breakout (ORB) strategy.
The Opening Range Breakout (ORB) strategy is a trading approach that involves identifying the price range within the first few minutes of a market session and then waiting for the price to break out of that range. This indicator facilitates this strategy through the use of shaded regions and/or price levels.
Features
Able to plot the high and low for any opening range above 1 min on any intraday timeframe
Fully customizable ORB region, price level, price axis, label
The inclusion of the Bollinger band along with it's Moving Average serves multiple purposes to assist the user in the opening range breakout strategy
Highlights to the user the deviation from the Moving Average due to an opening range breakout so that the user is better informed on whether to avoid entering a position, exit a position, or monitor the situation more closely
Highlights area of support or resistance formed by the Moving Average of Bollinger Band
Inform the user of the current trend direction to serve as confluence during an opening range breakout
What sets this indicator apart from others
In other ORB indicators, the opening range must be a multiple of the current chart's timeframe, restricting users on the intraday timeframes that can be used. E.g. if the user is using the 15 minutes opening range, they are restricted to use the 1, 3, 5, 15 minute(s) chart.
This indicator gives the user the flexibility to set any opening range above 1 min on any intraday timeframe. E.g. if the user is using the 15 minutes opening range, they are free to use any intraday timeframe on their chart, such as 1 hour or 2 hours chart.
How to use
Input the opening time range of interest in minutes
Check the "ORB region" checkbox to shade the ORB region
Check the "PRICE LEVEL" checkbox to draw a horizontal line of the high and low
Check the "PRICE AXIS" checkbox to plot the values on the price axis
Check the "LABEL" checkbox to draw a label of the high and low

ORB with ATR Trailing SL [Bluechip Algos]This is a simple ORB (Opening Range Breakout) Indicator that not only signals breakout directions based on the opening session range but also includes trailing stop levels to manage ongoing trades. Instead of regular fixed Stop loss, we use ATR indicator (ATR based SL) to trail the stop loss that might help in maximizing the profitable trades. This helps especially during the trending days where market moves unidirectionally.
About the Indicator
Opening Range Identification: The indicator defines an initial session timeframe and captures the highest and lowest prices during this period.
Breakout Signals: It signals potential entry points when the price crosses these range boundaries.
Trailing Stop Calculation: Customizable trailing stop-loss based on ATR percentage, helping users lock in profits.
Features
Session Customization: User-defined session for setting the opening range.
Entry Signal Customization: Allows configuration for breakouts on either a closing basis or upon touching the level.
Automatic Stop-Loss Adjustments: Dynamic trailing stop levels that adapt to both long and short entries.
Visual Display: Highlights breakout levels and plots lines representing stop-loss levels.
Understanding the Indicator
Range Calculation: After defining the session, the high and low of the session are locked. The high serves as the upper breakout boundary, and the low as the lower boundary.
Signals (Buy and Sell): The indicator uses crossover conditions:
Buy Signal ("B") when price crosses above the ORB high.
Sell Signal ("S") when price crosses below the ORB low.
Trail Stop Calculation: When a signal is triggered, a trailing stop level is set and updates as the trade progresses:
Long positions have a stop-loss based on a percentage below the last closing price.
Short positions have a stop-loss based on a percentage above the last closing price.
Input Parameters
Session Time (ORB Session Time): Start and end times for setting the ORB range.
Signal Configuration: Choice between "CLOSE" (signal on close) or "TOUCH" (signal as soon as level is touched).
ATR Percentage: Sets the percentage for the trailing stop calculation.
Negroni Opening Range StrategyStrategy Summary:
This tool can be used to help identify breakouts from a range during a time-zone of your choosing. It plots a pre-market range, an opening range, it also includes moving average levels that can be used as confluence, as well as plotting previous day SESSION highs and lows.
There are several options on how you wish to close out the trades, all described in more detail below.
Back-testing Inputs:
You define your timezone.
You define how many trades to open on any given day.
You decide to go: long only, short only, or long & short (CAREFUL: "Long & Short" can open trades that effectively closes-out existing ones, for better AND worse!)
You define between which times the strategy will open trades.
You define when it closes any open trades (preventing overnight trades, or leaving trades open into US data times!!).
This hopefully helps make back-testing reflect YOUR trading hours.
NOTE: Renko or Heikin-Ashi charts
For ALL strategies, don’t use Renko or Heikin-Ashi charts unless you know EXACTLY the implications.
Specific to my strategy, using a renko chart can make this 85-90% profitable (I wish it was!!) Although they can be useful, renko charts don’t always capture real wicks, so the renko chart may show your trade up-only but your broker (who is not using renko!!) will have likely stopped you out on a wick somewhere along the line.
NOTE: TradingView ‘Deep backtesting’
For ALL strategies, be cynical of all backtesting (e.g. repainting issues etc) as well as ‘Deep backtesting’ results.
Specific to this strategy, the default settings here SHOULD BE OK, but unfortunately at the time of writing, we can’t see on the chart what exactly ‘deep backtesting’ is calculating. In the past I have noted a number of trades that were not closed at the end of the day, despite my ‘end of day’ trade closing being enabled, so there were big winners and losers that would not have materialized otherwise. As I say, this seems ok at these settings but just always be cynical!!
Opening Range Inputs
You define a pre-market range (example: 08:00 - 09:00).
You define an opening range (example: 09:00 - 09:30).
The strategy will give an update at the close of the opening range to let you know if the opening range has broken out the pre-market range (OR Breakout), or if it has remained inside (OR Inside). The label appears at the end of the opening range NOT at the bar that ‘broke-out’.
This is just a visual cue for you, it has no bearing on what the strategy will do.
The strategy default will trade off the pre-market range, but you can untick this if you prefer to trade off the opening range.
Opening Trades:
Strategy goes long when the bar (CLOSE) crosses-over the ‘pre-market’ high (not the ‘opening range’ high); and the time is within your trading session, and you have not maxed out your number of trades for the day!
Strategy goes short when the bar (CLOSE) crosses-under the ‘pre-market’ low (not the ‘opening range low); and the time is within your trading session, and you have not maxed out your number of trades for the day!
Remember, you can untick this if you prefer to trade off the opening range instead.
NOTES:
Using momentum indicators can help (RSI and MACD): especially to trade range plays in failed breakouts, when momentum shifts… but the strategy won’t do this for you!
Using an anchored vwap at the session open can also provide nice confluence, as well as take-profit levels at the upper/lower of 3x standard deviation.
CLOSING TRADES:
You have 6 take-profit (TP) options:
1) Full TP: uses ATR Multiplier - Full TP at the ATR parameters as defined in inputs.
2) Take Partial profits: ATR Multiplier - Takes partial profits based on parameters as defined in inputs (i.e close 40% of original trade at TP1, close another 40% of original trade at TP2, then the remainder at Full TP as set in option 1.).
3) Full TP: Trailing Stop - Applies a Trailing Stop at the number of points, as defined in inputs.
4) Full TP: MA cross - Takes profit when price crosses ‘Trend MA’ as defined in inputs.
5) Scalp: Points - closes at a set number of points, as defined in inputs.
6) Full TP: PMKT Multiplier - places a SL at opposite pre-market Hi/Low (we go long at a break-out of the pre-market high, 50% would place a SL at the pre-market range mid-point; 100% would place a SL at the pre-market low)'. This takes profit at the input set in option 1).
