OBV on retail Volume This Indicator takes volume of retail exchanges as input - Bitfinex+Flyer+Coinbase+Bitstamp+Gemini+Binance and calculates OBV on that its always better than calculating obv based on volume of single exchange.
I had excluded futures exchanges like mex, deribit as they don't represent retail
Denge İşlem Hacmi (OBV)
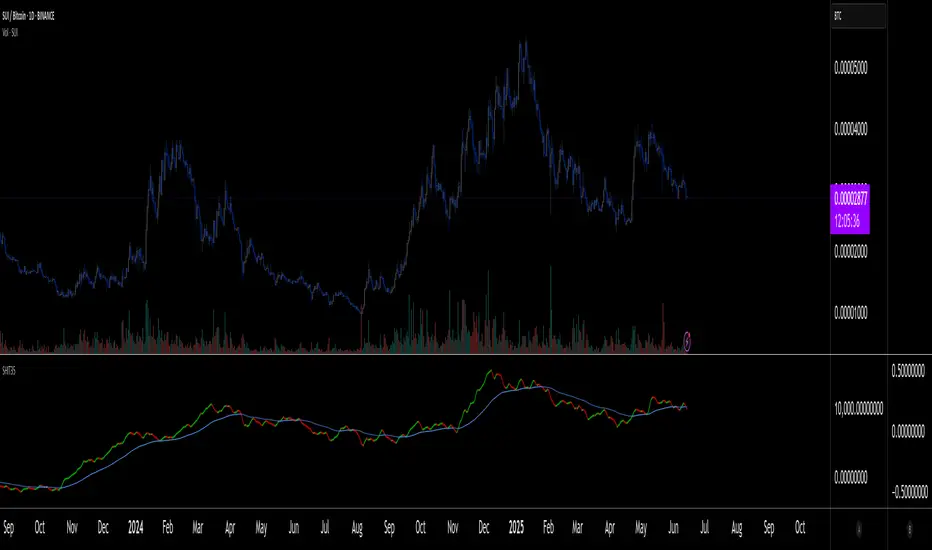
SHIT35 Alt Index (ROC or Volume) [LucF]SHIT35 is an index of 35 Binance alt/BTC pairs. It provides traders with a more reliable read of BTC pairs price movement than the often uncorrelated USD market cap standard.
Because it must read data coming from 35 markets, SHIT35 is painfully slow and should be kept hidden most of the time. Its features will hopefully seduce traders in using it nonetheless for market analysis.
Features
The Index can be calculated using 4 different modes:
1. Total of instant rate of change for all 35 markets ,
2. Cumulative total of ROCs,
3. Average of ROCs,
4. Plus/Minus volume (an aggregate OBV, if you will).
Select only one of the methods at a time to prevent confusion between modes.
An option allows showing the correlation between the Index as it is configured, and another instrument (CRYPTOCAP:TOTAL2 by default).
Markers can be used to identify abnormal movements in the Index. They are generated using Index exits from Bollinger bands.
The chart shows the Index with, from top to bottom, the default mode with BTC pairs, with USDT pairs, then mode 2 and 4 for BTC pairs.
Index Components
The Index is not weighed. The 35 instruments composing the index all have equivalents in the USDT quote currency on Binance, so you can easily change to those pairs using the Settings. Choosing another exchange or quote currency will require modifications to the list of instruments in the indicator’s code, since if one of the markets cannot be found, the indicator will not work. If the instrument exists but has no history for some bars, zero values will be used for them.
Watchlists
I have created a watchlist for the 35 markets in each of the BTC and USDT quote currencies. To import the watchlists, save the text you’ll find at these links in a file named the way you want your watchlist to be named and import them using the “Import Watchlist…” function.
BTC Watchlist: pastebin.com
USDT Watchlist: pastebin.com
Alerts
You can define alerts on any combination of markers you configure. After defining the markers you want the alert to trigger on, make sure you are on the interval you want the alert to be monitoring at, then create the alert, select the indicator, use the default alert condition and choose your triggering window (usually “Once Per Bar Close”). Once the alert is created, you can change the indicator's inputs with no effect on the alert.
TA-Money Flow-v2, Stochastic OBVNot sure where I originally got this (somewhere off Tradingview several years ago, thanks to the person who shared), just publishing because of a request.
This is basically a stochastic OBV movement indicator. It is good to work with both price and volume. I've updated to be able to display either as positive only, or both sides (50/-50), also included an invert function. It works great on any time frame, but you need to have volume data.
Enjoy.
I've got a version 3 if you're interested.

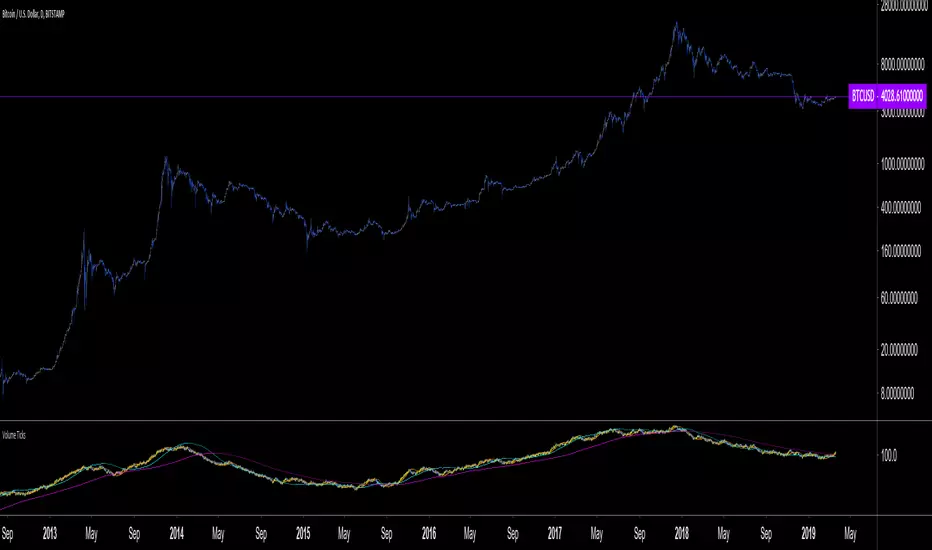
Volume Ticks - Increasing Volume Bar Count [LucF]Volume Ticks is a zero-lag market sentiment indicator. It works by providing a cumulative count of increasing volume columns.
A one count is added for each increasing volume column where close>open, and one is subtracted on an increasing volume column if close
OBV-Ichimoku [by: Bijan Ajdary]This indicator adds Tenkansen and 3 types of Kijunsen and ChikouSpan and Kumo to the OBV chart.
Just like the Ichimoku indicator, only with the difference that, OBV was used instead of the price,
And making it highly efficient for professional traders and Analyzers.
Email: bj.ajdary@gmail.com
Telegram Id: @The_Last_Savior

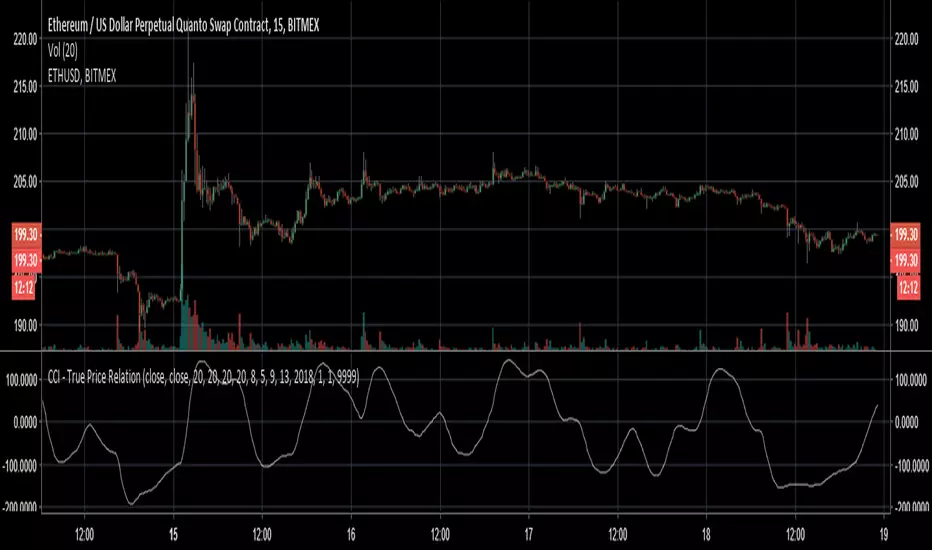
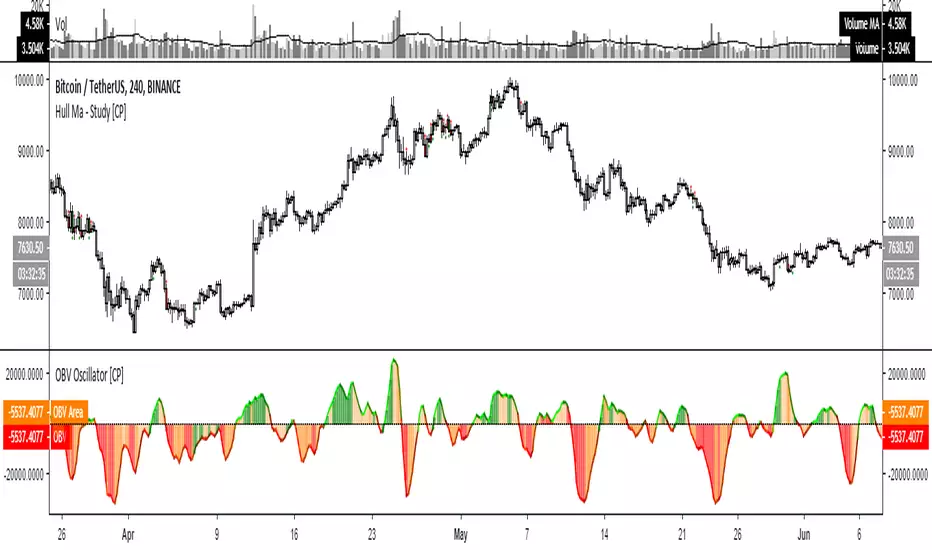
OBV Oscillator [CP]This is my version of the OBV Oscillator and I've used CCI to color the histogram
Line colors:
* Lime rising line above 0 line: Strong Bullish
* Green falling line above 0 line : Neutral Bullish
* Red falling line below 0 line : Strong Bearish
* Maroon rising line below 0 line : Neutral Bearish
Histogram colors:
*Green background above 0 line: Strong Bullish / Overbought
*Orange background above 0 line: Neutral Bullish
*Red background below 0 line: Strong Bearish / Oversold
*Orange background below 0 line: Neutral Bearish
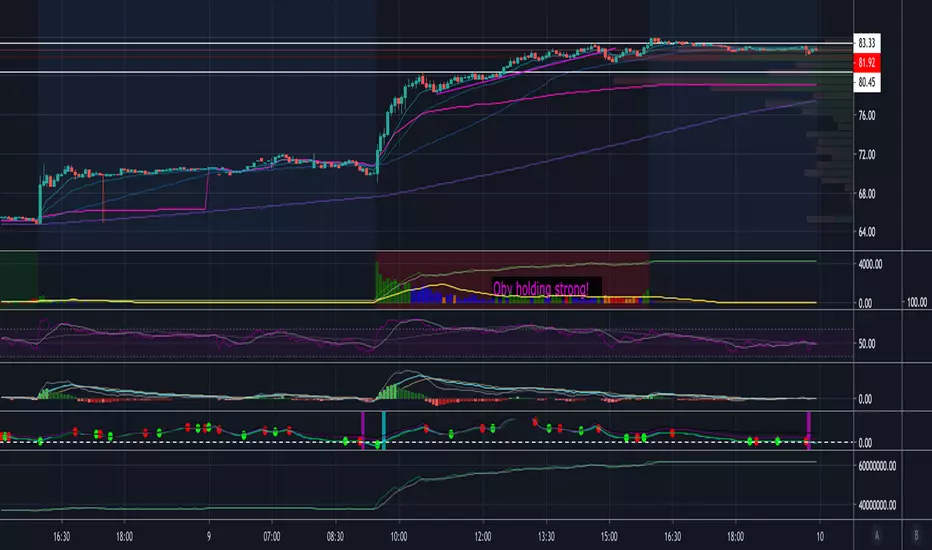
Volume Candle + All MAs [SHK]Hi friends.
There are multiple locked and non-free "volume candle" indicators but now it's free ! You don't need to pay others to access that anymore.
No need to give multiple paragraph description like other developers. It's simply OBV as Candle.
You can add multiple types of Moving averages to the indicator:
Butterworth 2Pole
DEMA
EMA
Gaussian
Geometric Mean
LowPass
McGuinley
Regularized MA
SMA
Sine WMA
Smoothed MA
T3
Triangular MA
Wilders
Zero Lag
AM HellachoppyThis script shows choppy zones and attempts to estimate the proceeding direction using a variety of methods. The methods used to calculate the estimate are user configurable.

TH_OBV+ HistogramHi there!
This is an Histogram version of the OBV+ ( )
With this one, you will be also spot divergences and better time the market. Information is visually more clear and with the added benefit of less space required in your charts
Have fun!

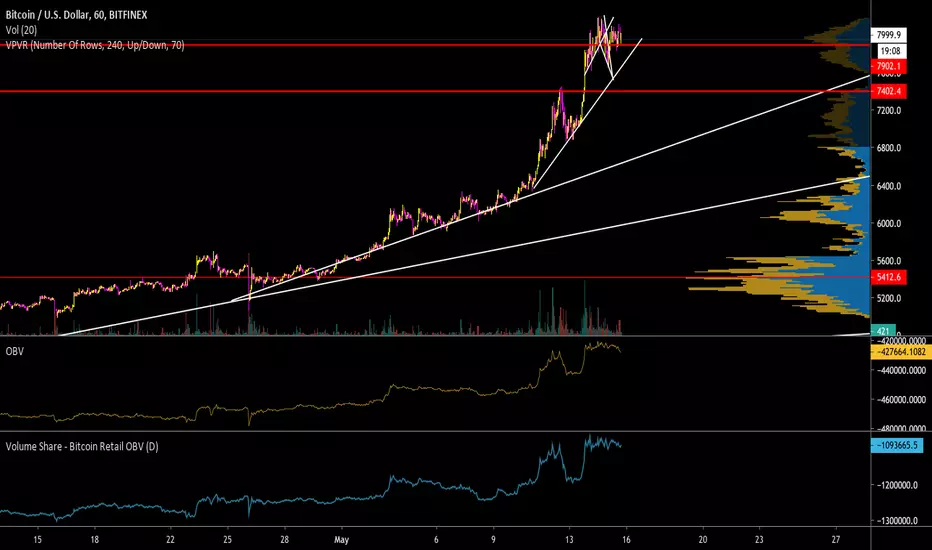
[ProfitTrailer] OBV Buy/Sell studyProfitTrailer buy/sell study for OBV strategy.
The script highlights the region where trailing is most likely to succeed.


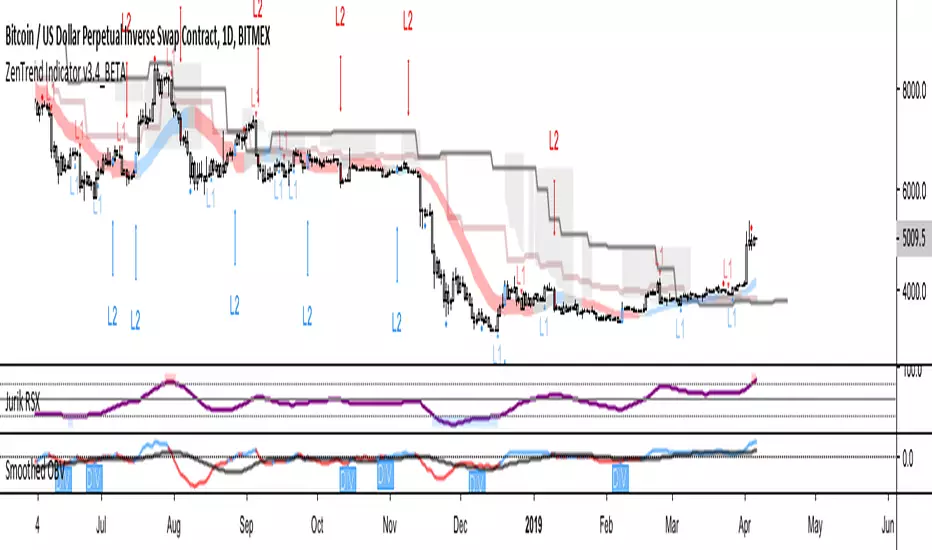
Cumulative OBV for BTC and ETHThis takes the OBV from various exchanges and compiles it into one OBV. Currently using Bitfinex, Bitstamp, Bitmex, Coinbase and Binance. Works for BTC or ETH
Bullish and Bearish divergences are marked.

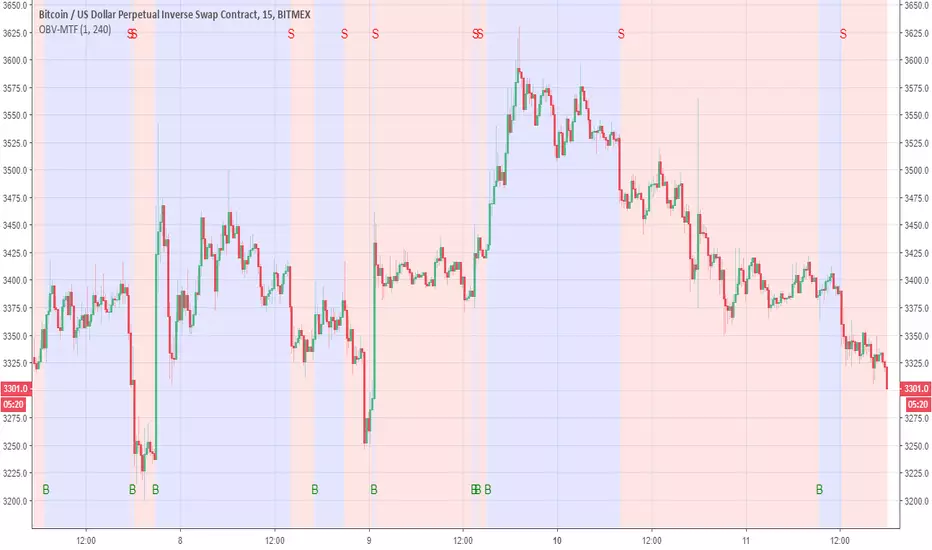
OBV-MTFUsing modified OBV volume equetion and using our modified MTF length (not need to use security so no repaint )
the Buy and Sell reresent in B and S and by the colors of bullish compare to bearish
You change the MTF by changing int2
in this example is set to 240 min MTF over 15 min charts
alerts inside
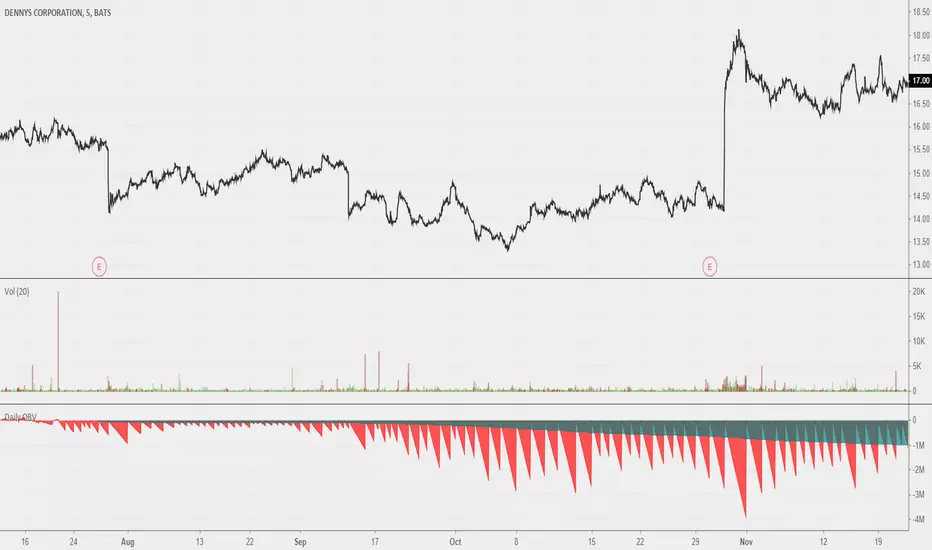
Daily OBVOBV that should reset on a daily session break. Looks neat when you scroll out all the way. Good use remains to be found; I believe this could be a useful reference for a more fleshed out idea for 'local zone' OBVs. Maybe comparing previous sessions' daily OBVs to current.
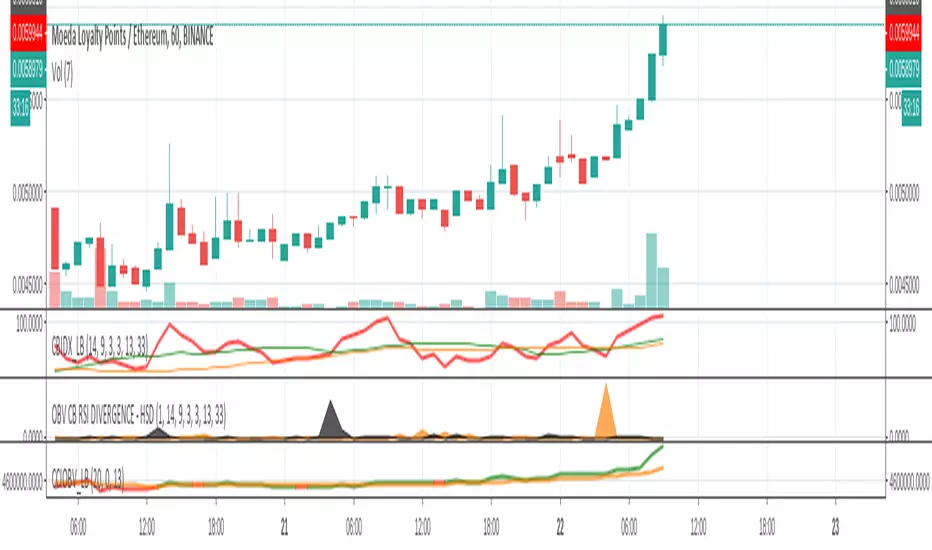
OBV CB RSI DIVERGENCE - HSDShows divergence spikes between OBV and Constance Brown RSI
Trade in the direction of the obv trend when it spikes
Includes LazyBear code and A&E's help - very much appreciated
Useful for all markets n instruments, i guess
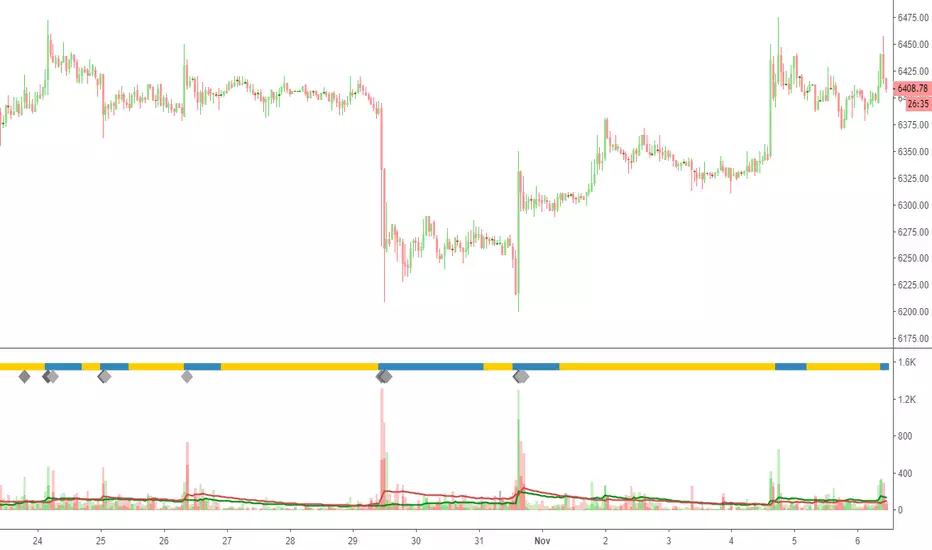
Ultimate Volume (UV) Supply/Demand Absorption [cI8DH]This is a variant of my ADV indicator which adds low/high volume trend, supply/demand absorption detection and separate buy/sell volume moving averages. When aggregation is set to cumulative, it can replicate my ADL indicator as well. It shows both regular volume bars and the accumulated/distributed (A/D) portions of volume.
Green line shows buy volume/accumulation and red line shows sell volume/distribution. This can help with assessing buy/sell pressure (read "why invent a new indicator" for more info about why this is more accurate than CMF , MFI, OBV and Williams AD for this purpose).
Volume trend shows high and low volume periods in blue and yellow respectively. This could help with avoiding over-trading during low market activity periods.
Supply/demand absorption is shown at the top (below volume trend). It shows that market is resisting the trend which could most often lead to sideways or minor/major trend change. Darker colors show stronger resistance. This feature is configured with two parameters that might require tuning depending on the asset and time frame.
The equation to calculate accumulation/distribution (A/D) is elegant and intuitive. It calculates candle body to candle height ratio and multiplies it by volume: volume*(close-open)/(high-low). This is the building block of my three other indicators ADMF , ADP and ADL ( UMF includes all these three indicators). The volume bars has two shades of green and red. The dark shade shows amount of A/D and the light shade shows total volume (what you see on a regular volume indicator).
When money volume is enabled, volume is multiplied by price. As you can see in the chart below, trade volume in terms of USD was growing over the past years while it has not made a new ATH in terms of the instrument (BTC).
Notes
- Uncheck "Money Volume" for Bitmex or any other exchange that shows volume in terms of money.
- Smooth MA length N = EMA length 2*N-1
- Combined tickers, e.g. (COINBASE:BTCUSD+BITSTAMP:BTCUSD+KRAKEN:XBTUSD)/3, can mitigate inconsistency issues between different exchanges (I recommend not mixing USD and USDT pairs together)
Here is a TL;DR list of my indicators to save you some time from looking at my obsolete indicators.
On Balance VolumeThis indicator was originally described by Joseph E. Granville in his book "Granville's New Key To Stock Market Profits" (1963).

Volume+ by BDthis is a simple volume indicator,
shows volume sizes with color differences on histogram (total volume, neutral volume and effective volume)
bar length = total volume, gray bar= neutral volume, green bar= pozitive volume, red bar= negative volume
variable value; The bar's average will be calculated until the given value. by default is average not calculated
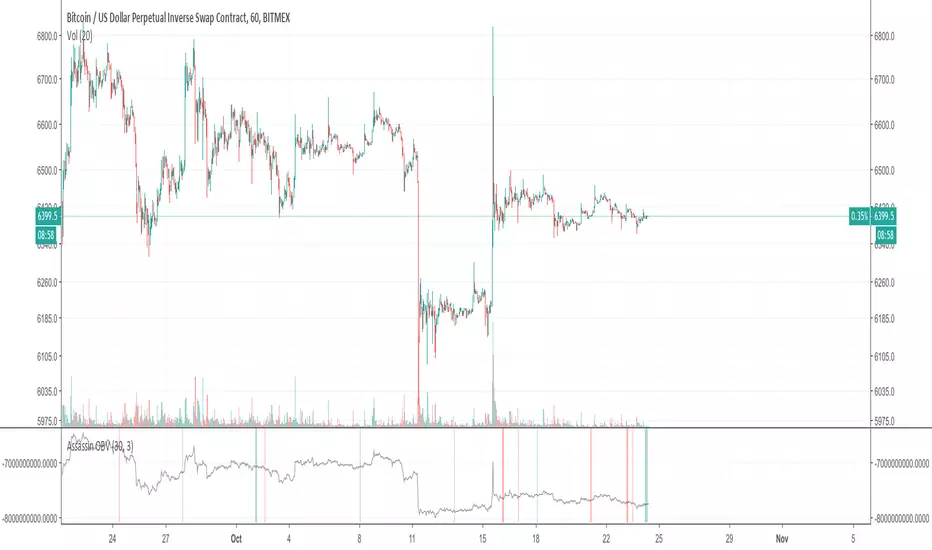
Assassin OBVAssassin OBV
add divergence judgement with price.
red means bull Divergence.
teal means bear Divergence.
OBV-Ts-Ks [by: Bijan Ajdary]This indicator adds Tenkansen and 3 types of Kijunsen to the OBV chart And making it highly efficient for professional traders.
Written based on the teachings of dear Chris