Quick scan for signal🙏🏻 Hey TV, this is QSFS, following:
^^ Quick scan for drift (QSFD)
^^ Quick scan for cycles (QSFC)
As mentioned before, ML trading is all about spotting any kind of non-randomness, and this metric (along with 2 previously posted) gonna help ya'll do it fast. This one will show you whether your time series possibly exhibits mean-reverting / consistent / noisy behavior, that can be later confirmed or denied by more sophisticated tools. This metric is O(n) in windowed mode and O(1) if calculated incrementally on each data update, so you can scan Ks of datasets w/o worrying about melting da ice.
^^ windowed mode
Now the post will be divided into several sections, and a couple of things I guess you’ve never seen or thought about in your life:
1) About Efficiency Ratios posted there on TV;
Some of you might say this is the Efficiency Ratio you’ve seen in Perry's book. Firstly, I can assure you that neither me nor Perry, just as X amount of quants all over the world and who knows who else, would say smth like, "I invented it," lol. This is just a thing you R&D when you need it. Secondly, I invite you (and mods & admin as well) to take a lil glimpse at the following screenshot:
^^ not cool...
So basically, all the Efficiency Ratios that were copypasted to our platform suffer the same bug: dudes don’t know how indexing works in Pine Script. I mean, it’s ok, I been doing the same mistakes as well, but loxx, cmon bro, you... If you guys ever read it, the lines 20 and 22 in da code are dedicated to you xD
2) About the metric;
This supports both moving window mode when Length > 0 and all-data expanding window mode when Length < 1, calculating incrementally from the very first data point in the series: O(n) on history, O(1) on live updates.
Now, why do I SQRT transform the result? This is a natural action since the metric (being a ratio in essence) is bounded between 0 and 1, so it can be modeled with a beta distribution. When you SQRT transform it, it still stays beta (think what happens when you apply a square root to 0.01 or 0.99), but it becomes symmetric around its typical value and starts to follow a bell-shaped curve. This can be easily checked with a normality test or by applying a set of percentiles and seeing the distances between them are almost equal.
Then I noticed that on different moving window sizes, the typical value of the metric seems to slide: higher window sizes lead to lower typical values across the moving windows. Turned out this can be modeled the same way confidence intervals are made. Lines 34 and 35 explain it all, I guess. You can see smth alike on an autocorrelogram. These two match the mean & mean + 1 stdev applied to the metric. This way, we’ve just magically received data to estimate alpha and beta parameters of the beta distribution using the method of moments. Having alpha and beta, we can now estimate everything further. Btw, there’s an alternative parameterization for beta distributions based on data length.
Now what you’ll see next is... u guys actually have no idea how deep and unrealistically minimalistic the underlying math principles are here.
I’m sure I’m not the only one in the universe who figured it out, but the thing is, it’s nowhere online or offline. By calculating higher-order moments & combining them, you can find natural adaptive thresholds that can later be used for anomaly detection/control applications for any data. No hardcoded thresholds, purely data-driven. Imma come back to this in one of the next drops, but the truest ones can already see it in this code. This way we get dem thresholds.
Your main thresholds are: basis, upper, and lower deviations. You can follow the common logic I’ve described in my previous scripts on how to use them. You just register an event when the metric goes higher/lower than a certain threshold based on what you’re looking for. Then you take the time series and confirm a certain behavior you were looking for by using an appropriate stat test. Or just run a certain strategy.
To avoid numerous triggers when the metric jitters around a threshold, you can follow this logic: forget about one threshold if touched, until another threshold is touched.
In general, when the metric gets higher than certain thresholds, like upper deviation, it means the signal is stronger than noise. You confirm it with a more sophisticated tool & run momentum strategies if drift is in place, or volatility strategies if there’s no drift in place. Otherwise, you confirm & run ~ mean-reverting strategies, regardless of whether there’s drift or not. Just don’t operate against the trend—hedge otherwise.
3) Flex;
Extension and limit thresholds based on distribution moments gonna be discussed properly later, but now you can see this:
^^ magic
Look at the thresholds—adaptive and dynamic. Do you see any optimizations? No ML, no DL, closed-form solution, but how? Just a formula based on a couple of variables? Maybe it’s just how the Universe works, but how can you know if you don’t understand how fundamentally numbers 3 and 15 are related to the normal distribution? Hm, why do they always say 3 sigmas but can’t say why? Maybe you can be different and say why?
This is the primordial power of statistical modeling.
4) Thanks;
I really wanna dedicate this to Charlotte de Witte & Marion Di Napoli, and their new track "Sanctum." It really gets you connected to the Source—I had it in my soul when I was doing all this ∞
Noise

Noise Footprint ImbalanceNoise Footprint Imbalance Indicator
The Noise Footprint Imbalance Indicator highlights areas of imbalance in price action, marking potential zones of support and resistance. This indicator helps traders visualize "footprints" of imbalance on the chart, allowing for better identification of areas where price moves significantly away from equilibrium. This can help traders pinpoint potential reversal points or zones where buyers or sellers may step in.
Features
Customizable Box Count: Choose the maximum number of imbalance zones displayed on the chart, keeping your workspace clear and focused.
Imbalance Detection: Highlights both top and bottom imbalances, identifying them based on price discrepancies between open/close and high/low levels.
Dynamic Zone Boxes: Draws boxes around imbalance zones with customizable colors and transparency, providing visual clarity without overwhelming the chart.
Usage
This indicator is beneficial for traders who:
Use imbalance zones as potential areas of interest for entries or exits.
Want to combine it with other indicators or price action analysis to improve trade setups.
Customization Options
Maximum Imbalance Zones: Adjusts the maximum number of imbalance boxes shown.
Imbalance Box Color: Customize the color and transparency of the imbalance zones to suit your chart's theme.
Add this script to your chart to enhance your technical analysis and bring more structure to your trading approach with the Noise Footprint Imbalance Indicator.

Total Death and Golden Crosses Calculator The Indicator calculates the total number of the death and golden crosses in the total chart which can help the moving average user to compare the number of signals generated by the moving average pair in the given timeframe.
All you need is to plot any two moving average then change the source of the indicator to get the total number of crosses.
If Indicator is not plotting anything then right click on the indicator's scale and click on "Auto(data fits the screen" option.

White NoiseThe "White Noise" indicator is designed to visualize the dispersion of price movements around a moving average, providing insights into market noise and potential trend changes. It highlights periods of increased volatility or noise compared to the underlying trend.
Code Explanation:
Inputs:
mlen: Input for the length of the noise calculation.
hlen: Input for the length of the Hull moving average.
col_up: Input for the color of the up movement.
col_dn: Input for the color of the down movement.
Calculations:
ma: Calculate the simple moving average of the high, low, and close prices (hlc3) over the specified mlen period.
dist: Calculate the percentage distance between the hlc3 and the moving average ma, then scale it by 850. This quantifies the deviation from the moving average as a value.
sm: Smooth the calculated dist values using a weighted moving average (WMA) twice, with different weights, and subtract one from the other. This provides a smoothed representation of the dispersion.
Coloring:
col_wn: Determine the color of the bars based on whether dist is positive or negative and whether it's greater or less than the smoothed sm value. This creates color-coded columns indicating upward or downward movements with varying opacity.
col_switch: Define the color for the current trend state. It switches color when the smoothed sm crosses above or below its previous value, indicating potential trend changes.
col_switch2: Define the color for the horizontal line that separates the two trend states. It switches color based on the same crossover and crossunder conditions as col_switch.
Plots:
plot(dist): Plot the dispersion values as columns with color defined by col_wn.
plot(sm): Plot the smoothed dispersion line with a white color and thicker linewidth.
plot(sm ): Plot the previous smoothed dispersion value with a lighter white color to create a visual distinction.
Usage:
This indicator can help traders identify periods of increased market noise, visualize potential trend reversals, and assess the strength of price movements around the moving average. The colored columns and smoothed line offer insights into the ebb and flow of market sentiment, aiding in decision-making.
ps. This can be used as a long-term TPI component if you dabble in Modern Portfolio Theory (MPT)
Recommended for timeframes on the 1D or above:

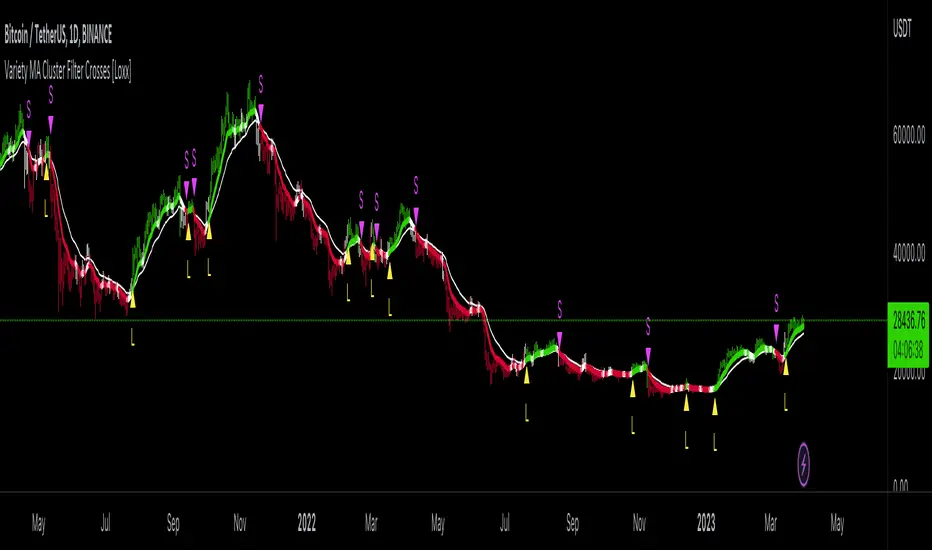
Variety MA Cluster Filter Crosses [Loxx]What is a Cluster Filter?
One of the approaches to determining a useful signal (trend) in stream data. Small filtering (smoothing) tests applied to market quotes demonstrate the potential for creating non-lagging digital filters (indicators) that are not redrawn on the last bars.
Standard Approach
This approach is based on classical time series smoothing methods. There are lots of articles devoted to this subject both on this and other websites. The results are also classical:
1. The changes in trends are displayed with latency;
2. Better indicator (digital filter) response achieved at the expense of smoothing quality decrease;
3. Attempts to implement non-lagging indicators lead to redrawing on the last samples (bars).
And whereas traders have learned to cope with these things using persistence of economic processes and other tricks, this would be unacceptable in evaluating real-time experimental data, e.g. when testing aerostructures.
The Main Problem
It is a known fact that the majority of trading systems stop performing with the course of time, and that the indicators are only indicative over certain intervals. This can easily be explained: market quotes are not stationary. The definition of a stationary process is available in Wikipedia:
A stationary process is a stochastic process whose joint probability distribution does not change when shifted in time.
Judging by this definition, methods of analysis of stationary time series are not applicable in technical analysis. And this is understandable. A skillful market-maker entering the market will mess up all the calculations we may have made prior to that with regard to parameters of a known series of market quotes.
Even though this seems obvious, a lot of indicators are based on the theory of stationary time series analysis. Examples of such indicators are moving averages and their modifications. However, there are some attempts to create adaptive indicators. They are supposed to take into account non-stationarity of market quotes to some extent, yet they do not seem to work wonders. The attempts to "punish" the market-maker using the currently known methods of analysis of non-stationary series (wavelets, empirical modes and others) are not successful either. It looks like a certain key factor is constantly being ignored or unidentified.
The main reason for this is that the methods used are not designed for working with stream data. All (or almost all) of them were developed for analysis of the already known or, speaking in terms of technical analysis, historical data. These methods are convenient, e.g., in geophysics: you feel the earthquake, get a seismogram and then analyze it for few months. In other words, these methods are appropriate where uncertainties arising at the ends of a time series in the course of filtering affect the end result.
When analyzing experimental stream data or market quotes, we are focused on the most recent data received, rather than history. These are data that cannot be dealt with using classical algorithms.
Cluster Filter
Cluster filter is a set of digital filters approximating the initial sequence. Cluster filters should not be confused with cluster indicators.
Cluster filters are convenient when analyzing non-stationary time series in real time, in other words, stream data. It means that these filters are of principal interest not for smoothing the already known time series values, but for getting the most probable smoothed values of the new data received in real time.
Unlike various decomposition methods or simply filters of desired frequency, cluster filters create a composition or a fan of probable values of initial series which are further analyzed for approximation of the initial sequence. The input sequence acts more as a reference than the target of the analysis. The main analysis concerns values calculated by a set of filters after processing the data received.
In the general case, every filter included in the cluster has its own individual characteristics and is not related to others in any way. These filters are sometimes customized for the analysis of a stationary time series of their own which describes individual properties of the initial non-stationary time series. In the simplest case, if the initial non-stationary series changes its parameters, the filters "switch" over. Thus, a cluster filter tracks real time changes in characteristics.
Cluster Filter Design Procedure
Any cluster filter can be designed in three steps:
1. The first step is usually the most difficult one but this is where probabilistic models of stream data received are formed. The number of these models can be arbitrary large. They are not always related to physical processes that affect the approximable data. The more precisely models describe the approximable sequence, the higher the probability to get a non-lagging cluster filter.
2. At the second step, one or more digital filters are created for each model. The most general condition for joining filters together in a cluster is that they belong to the models describing the approximable sequence.
3. So, we can have one or more filters in a cluster. Consequently, with each new sample we have the sample value and one or more filter values. Thus, with each sample we have a vector or artificial noise made up of several (minimum two) values. All we need to do now is to select the most appropriate value.
An Example of a Simple Cluster Filter
For illustration, we will implement a simple cluster filter corresponding to the above diagram, using market quotes as input sequence. You can simply use closing prices of any time frame.
1. Model description. We will proceed on the assumption that:
The aproximate sequence is non-stationary, i.e. its characteristics tend to change with the course of time.
The closing price of a bar is not the actual bar price. In other words, the registered closing price of a bar is one of the noise movements, like other price movements on that bar.
The actual price or the actual value of the approximable sequence is between the closing price of the current bar and the closing price of the previous bar.
The approximable sequence tends to maintain its direction. That is, if it was growing on the previous bar, it will tend to keep on growing on the current bar.
2. Selecting digital filters. For the sake of simplicity, we take two filters:
The first filter will be a variety filter calculated based on the last closing prices using the slow period. I believe this fits well in the third assumption we specified for our model.
Since we have a non-stationary filter, we will try to also use an additional filter that will hopefully facilitate to identify changes in characteristics of the time series. I've chosen a variety filter using the fast period.
3. Selecting the appropriate value for the cluster filter.
So, with each new sample we will have the sample value (closing price), as well as the value of MA and fast filter. The closing price will be ignored according to the second assumption specified for our model. Further, we select the МА or ЕМА value based on the last assumption, i.e. maintaining trend direction:
For an uptrend, i.e. CF(i-1)>CF(i-2), we select one of the following four variants:
if CF(i-1)fastfilter(i), then CF(i)=slowfilter(i);
if CF(i-1)>slowfilter(i) and CF(i-1)slowfilter(i) and CF(i-1)>fastfilter(i), then CF(i)=MAX(slowfilter(i),fastfilter(i)).
For a downtrend, i.e. CF(i-1)slowfilter(i) and CF(i-1)>fastfilter(i), then CF(i)=MAX(slowfilter(i),fastfilter(i));
if CF(i-1)>slowfilter(i) and CF(i-1)fastfilter(i), then CF(i)=fastfilter(i);
if CF(i-1)<slowfilter(i) and CF(i-1)<fastfilter(i), then CF(i)=MIN(slowfilter(i),fastfilter(i)).
Where:
CF(i) – value of the cluster filter on the current bar;
CF(i-1) and CF(i-2) – values of the cluster filter on the previous bars;
slowfilter(i) – value of the slow filter
fastfilter(i) – value of the fast filter
MIN – the minimum value;
MAX – the maximum value;
What is Variety MA Cluster Filter Crosses?
For this indicator we calculate a fast and slow filter of the same filter and then we run a cluster filter between the fast and slow filter outputs to detect areas of chop/noise. The output is the uptrend is denoted by green color, downtrend by red color, and chop/noise/no-trade zone by white color. As a trader, you'll likely want to avoid trading during areas of chop/noise so you'll want to avoid trading when the color turns white.
Extras
Bar coloring
Alerts
Loxx's Expanded Source Types, see here:
Loxx's Moving Averages, see here:
An example of filtered chop, see the yellow circles. The cluster filter identifies chop zones so you don't get stuck in a sideways market.
KERPD Noise Filter - Kaufman Efficiency Ratio and Price DensityThis indicator combines Kaufman Efficiency Ratio (KER) and Price Density theories to create a unique market noise filter that is 'right on time' compared to using KER or Price Density alone. All data is normalized and merged into a single output. Additionally, this indicator provides the ability to consider background noise and background noise buoyancy to allow dynamic observation of noise level and asset specific calibration of the indicator (if desired).
The basic theory surrounding usage is that: higher values = lower noise, while lower values = higher noise in market.
Notes: NON-DIRECTIONAL Kaufman Efficiency Ratio used. Threshold period of 30 to 40 applies to Kaufman Efficiency Ratio systems if standard length of 20 is applied; maintained despite incorporation of Price Density normalized data.
TRADING USES:
-Trend strategies, mean reversion/reversal/contrarian strategies, and identification/avoidance of ranging market conditions.
-Trend strategy where KERPD is above a certain value; generally a trend is forming/continuing as noise levels fall in the market.
-Mean reversion/reversal/contrarian strategies when KERPD exits a trending condition and falls below a certain value (additional signal confluence confirming for a strong reversal in price required); generally a reversal is forming as noise levels increase in the market.
-A filter to screen out ranging/choppy conditions where breakouts are frequently fake-outs and or price fails to move significantly; noise level is high, in addition to the background buoyancy level.
-In an adaptive trading systems to assist in determining whether to apply a trend following algorithm or a mean reversion algorithm.
THEORY / THOUGHT SPACE:
The market is a jungle. When apex predators are present it often goes quiet (institutions moving price), when absent the jungle is loud.
There is always background noise that scales with the anticipation of the silence, which has features of buoyancy that act to calibrate the beginning of the silence and return to background noise conditions.
Trend traders hunt in low noise conditions. Reversion traders hunt in the onset of low noise into static conditions. Ranges can be avoided during high noise and buoyant background noise conditions.
Distance between the noise line and background noise can help inform decision making.
CALIBRATION:
- Set the Noise Threshold % color change line so that the color cut off is where your trend/reversion should begin.
- Set the Background Noise Buoyancy Calibration Decimal % to match the beginning/end of the color change Noise Threshold % line. Match the Background Noise Baseline Decimal %' to the number set for buoyancy.
- Additionally, create your own custom settings; 33/34 and 50 length also provides interesting results.
- A color change tape option can be enabled by un-commenting the lines at the bottom of this script.
Market Usage:
Stock, Crypto, Forex, and Others
Excellent for: NDQ, J225, US30, SPX
Market Conditions:
Trend, Reversal, Ranging

Adaptive ATR Keltner Channels [Loxx]Adaptive ATR Channels are adaptive Keltner channels. ATR is calculated using a rolling signal-to-noise ratio making this indicator flex more to changes in price volatility than the fixed Keltner Channels.
What is Average True Range (ATR)?
The average true range (ATR) is a technical analysis indicator, introduced by market technician J. Welles Wilder Jr. in his book New Concepts in Technical Trading Systems, that measures market volatility by decomposing the entire range of an asset price for that period.1
The true range is taken as the greatest of the following: current high less the current low; the absolute value of the current high less the previous close; and the absolute value of the current low less the previous close. The ATR is then a moving average, generally using 14 days, of the true ranges.
What are Keltner Channel (ATR)?
Keltner Channels are volatility-based bands that are placed on either side of an asset's price and can aid in determining the direction of a trend.
The Keltner channel uses the average-true range (ATR) or volatility, with breaks above or below the top and bottom barriers signaling a continuation.

Parabolic SAR of KAMA [Loxx]Parabolic SAR of KAMA attempts to reduce noise and volatility from regular Parabolic SAR in order to derive more accurate trends. In addition, and to further reduce noise and enhance trend identification, PSAR of KAMA includes two calculations of efficiency ratio: 1) price change adjusted for the daily volatility; or, 2) Jurik Fractal Dimension Adaptive (explained below)
What is PSAR?
The parabolic SAR indicator, developed by J. Wells Wilder, is used by traders to determine trend direction and potential reversals in price. The indicator uses a trailing stop and reverse method called "SAR," or stop and reverse, to identify suitable exit and entry points. Traders also refer to the indicator as to the parabolic stop and reverse, parabolic SAR, or PSAR.
What is KAMA?
Developed by Perry Kaufman, Kaufman's Adaptive Moving Average (KAMA) is a moving average designed to account for market noise or volatility. KAMA will closely follow prices when the price swings are relatively small and the noise is low. KAMA will adjust when the price swings widen and follow prices from a greater distance. This trend-following indicator can be used to identify the overall trend, time turning points and filter price movements.
What is the efficiency ratio?
In statistical terms, the Efficiency Ratio tells us the fractal efficiency of price changes. ER fluctuates between 1 and 0, but these extremes are the exception, not the norm. ER would be 1 if prices moved up 10 consecutive periods or down 10 consecutive periods. ER would be zero if price is unchanged over the 10 periods.
What is Jurik Fractal Dimension?
There is a weak and a strong way to measure the random quality of a time series.
The weak way is to use the random walk index (RWI). You can download it from the Omega web site. It makes the assumption that the market is moving randomly with an average distance D per move and proposes an amount the market should have changed over N bars of time. If the market has traveled less, then the action is considered random, otherwise it's considered trending.
The problem with this method is that taking the average distance is valid for a Normal (Gaussian) distribution of price activity. However, price action is rarely Normal, with large price jumps occuring much more frequently than a Normal distribution would expect. Consequently, big jumps throw the RWI way off, producing invalid results.
The strong way is to not make any assumption regarding the distribution of price changes and, instead, measure the fractal dimension of the time series. Fractal Dimension requires a lot of data to be accurate. If you are trading 30 minute bars, use a multi-chart where this indicator is running on 5 minute bars and you are trading on 30 minute bars.
Conclusion from the combined efforts explained above:
-PSAR is a tool that identifies trends
-To reduce noise and identify trends during periods of low volatility, we calculate a PSAR on KAMA
-To enhance noise and reduction and trend identification, we attempt to derive an efficiency ratio that is less reliant on a Normal (Gaussian) distribution of price
Included:
-Customization of all variables
-Select from two different ER calculation styles
-Multiple timeframe enabled

FiboBars ExtendedA trend indicator FiboBars Extended , the main purpose of which is to confirm the trend and cut off market noise. In his logic, he uses the Fibonacci sequence.
Two settings are used to account for noise suppression accuracy:
Period - number of calculation bars
Level - Fibonacci number selection

Trend-Quality IndicatorBINANCE:BTCUSDT
Open source version of the Trend-Quality Indicator as described by David Sepiashvili in [ Stocks & Commodities V. 22:4 (14-20) ]
Q-Indicator and B-Indicator are available both separately or together
█ OVERVIEW
The Trend-Quality indicator is a trend detection and estimation tool that is based on a two-step filtering technique. It measures cumulative price changes over term-oriented semicycles and relates them to “noise”. The approach reveals congestion and trending periods of the price movement and focuses on the most important trends, evaluating their strength in the process. The indicator is presented in a centered oscillator (Q-Indicator) and banded oscillator format (B-Indicator).
Semicycles are determined by using a short term and a longer term EMAs. The starting points for the cycles are determined by the moving averages crossover.
Cumulative price change (CPC) indicator measures the amount that the price has changed from a fixed starting point within a given semicycle. The CPC indicator is calculated as a cumulative sum of differences between the current and previous prices over the period from the fixed starting point.
The trend within the given semicycle can be found by calculating the moving average of the cumulative price change.
The noise can be defined as the average deviation of the cumulative price change from the trend. To determine linear noise, we calculate the absolute value of the difference between CPC and trend, and then smooth it over the n-point period. The root mean square noise, similar to the conventional standard deviation, can be derived by summing the squares of the difference between CPC and trend over each of the preceding n-point periods, dividing the sum by n, and calculating the square root of the result.
█ Q-INDICATOR
The Q-Indicator is a centered oscillator that fluctuates around a zero line with no upper or lower limits, is calculated by dividing trend by noise.
The Q-Indicator is intended to measure trend activity. The further the Q is from 0, the less the risk of trading with a trend, and the more reliable the trading opportunity. Values exceeding +2 or -2 can be qualified as promising
Values:
in the -1 to +1 range (GRAY) indicate that the trend is buried beneath noise. It is preferable to stay out of this zone
in the +1 to +2 or -1 to -2 range (YELLOW) indicate weak trending
in the +2 to +5 range (BLUE) or -2 to -5 range (ORANGE) indicate moderate trending
above +5 range (GREEN) or below -5 (RED) indicate strong trending
Readings exceeding strong trending levels can indicate overbought or oversold conditions and signal that price action should be monitored closely.
█ B-INDICATOR
The B-Indicator is a banded oscillator that fluctuates between 0 and 100, is calculated by dividing the absolute value of trend by noise added to absolute value of trend, and scaling the result appropriately.
The B-indicator doesn’t show the direction of price movement, but only the existence of the trend and its strength. It requires additional tools for reversal manifestations.
The indicator’s interpretation is simple. The central line suggests that the trend and noise are in equilibrium (trend is equal to noise).
Values:
below 50 (GRAY) indicate ranging market
in the 50 to 65 range (YELLOW) indicate weak trending
in the 65 to 80 range (BLUE) indicate moderate trending
above 80 (GREEN) indicate strong trending
The 65 level can be thought of as the demarcation line of trending and ranging markets and can help determine which type of technical analysis indicator (lagging or leading) is better suited to current market conditions. Readings exceeding strong trending levels can indicate overbought or oversold conditions.

Cyclic RSI High Low With Noise Filter█ OVERVIEW
This indicator displays Cyclic Relative Strength Index based on Decoding the Hidden Market Rhythm, Part 1 written by Lars von Thienen.
To determine true or false for Overbought / Oversold are unnecessary, therefore these should be either strong or weak.
Noise for weak Overbought / Oversold can be filtered, especially for smaller timeframe.
█ FEATURES
Display calculated Cyclic Relative Strength Index.
Zigzag high low based on Cyclic Relative Strength Index.
Able to filter noise for high low.
█ LEGENDS
◍ Weak Overbought / Oversold
OB ▼ = Strong Overbought
OS ▲ = Strong Oversold
█ USAGE / TIPS
Recommend to be used for Harmonic Patterns such as XABCD and ABCD.
Condition 1 (XABCD) : When ▼ and ▲ exist side by side, usually this outline XA, while the next two ◍ can be BC.
Condition 2 (ABCD) : When ▼ and ▲ exist side by side, usually this outline AB, while the next one ◍ can be BC, strong ABCD.
Condition 3 (ABCD) : When ▼ or ▲ exist at Point A, the next two ◍ can be Point B and Point C, medium ABCD.
Condition 4 (ABCD) : When ◍ exist at Point a, the next two ◍ can be Point b and Point c, weak ABCD usually used as lower case as abcd.
█ CREDITS
LoneSomeTheBlue
WhenToTrade

Rebalance OscillatorRebalancing is a common strategy to reduce risk and achieve a constant portfolio ratio between two tokens. It shifts between two values in order to keep a static ratio between them as their value oscillates.
However what is less known about rebalancing is that it provides a way to remove the noise from a signal, effectively showing us the points where to buy and to sell.
This works best in highly volatile tickers, between two tokens that are not correlated and show a high std deviation between them (i.e. XTZUSD is a better signal for this than XTZBTC).
The buying bars are marked in blue, and the selling bars are marked in red, in a similar fashion to Trading View strategy orders.

Efficiency RatioThe efficiency ratio (ER) is described by Perry Kaufman in his book, Trading Systems and Methods.
It works by measuring the momentum of the market, that is, the absolute change from the current price to a past price, and divides it by the volatility, which is the sum of the absolute changes of each bar. That makes this a bounded indicator, going from 0 to 100, like an oscillator. Higher values mean less noise, while lower values mean more.
Eg.: if the market moves from 10.0 to 15.0 in a directional manner, with every bar up, the ER is going to be at 100. However, if it moves up and down, and goes all over the place until finally reaching 15.0, the ER is going to be at around 20. It is very difficult for the ER to be at zero, because that would require 0 volatility, which is almost impossible to occur.
This indicator is useful when planning for trades. If you notice the ER being higher than average, you may choose to increase the position size, because that would mean that the market is directional and has less chance of a whipsaw.
Ehlers Noise Elimination Technology [CC]The Noise Elimination Technology Indicator was created by John Ehlers (Stocks and Commodities Dec 2020 pg 17) and he created this indicator to be used with his version of RSI but I think it works well with any price data or any indicator really.
I'm trying a new signal system due to a request from @luckyCamel58789 so let me know what you think. I now differentiate between a buy and a strong buy when the indicator increases over itself twice and vice versa. Dark green is a strong buy and light green is a regular buy. Dark red is a strong sell and light red is a regular sell.
Let me know what indicators you would like to see me publish!
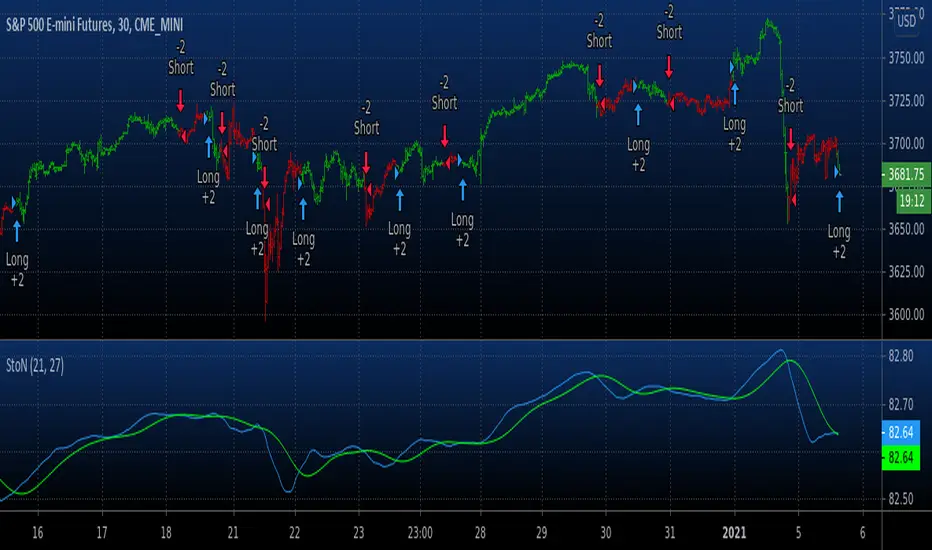
Combo Backtest 123 Reversal & Signal To Noise This is combo strategies for get a cumulative signal.
First strategy
This System was created from the Book "How I Tripled My Money In The
Futures Market" by Ulf Jensen, Page 183. This is reverse type of strategies.
The strategy buys at market, if close price is higher than the previous close
during 2 days and the meaning of 9-days Stochastic Slow Oscillator is lower than 50.
The strategy sells at market, if close price is lower than the previous close price
during 2 days and the meaning of 9-days Stochastic Fast Oscillator is higher than 50.
Second strategy
The signal-to-noise (S/N) ratio.
And Simple Moving Average.
WARNING:
- For purpose educate only
- This script to change bars colors.
Backtest Signal To Noise This source code is subject to the terms of the Mozilla Public License 2.0 at mozilla.org
© HPotter 05/01/2021
The signal-to-noise (S/N) ratio.
And Simple Moving Average.
Thank you for idea BlockchainYahoo
WARNING:
- For purpose educate only
- This script to change bars colors.
Signal To Noise This source code is subject to the terms of the Mozilla Public License 2.0 at mozilla.org
© HPotter 05/01/2021
The signal-to-noise (S/N) ratio.
Thank you for idea BlockchainYahoo

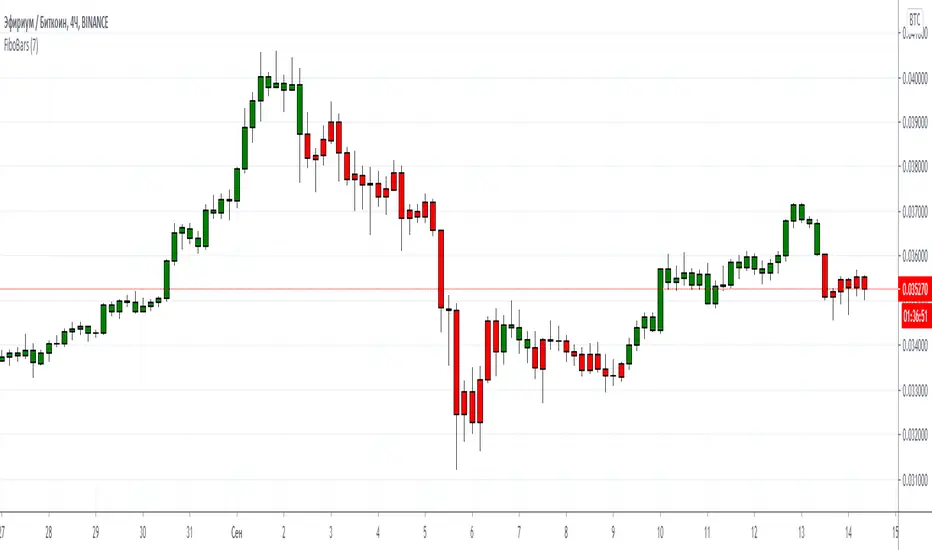
FiboBarsThis indicator is used to remove noise in the price chart. In its logic, it uses the Fibonacci number. To adjust the noise level, there is a "period" field in the settings. The higher the period value, the more noise the indicator absorbs.
Ideal for trending instruments.
Данный индикатор служит для удаления шума в графике цены. В своей логики он использует число Фибоначчи. Для возможности настройки уровня шума, в настройках есть поле "период". Чем выше значение периода, тем больше шумы поглощает индикатора.
Идеально подходит для трендовых инструментов.
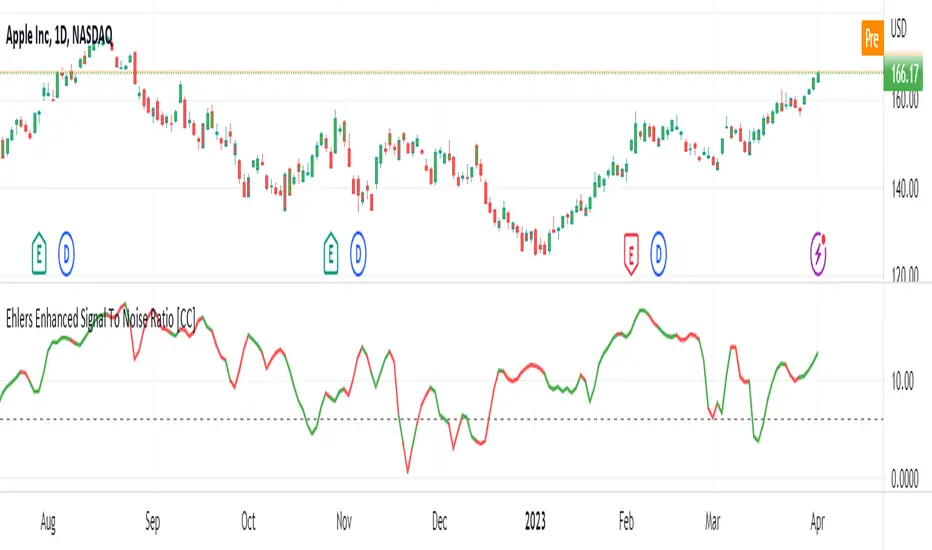
Ehlers Enhanced Signal To Noise Ratio [CC]The Enhanced Signal To Noise Ratio was created by John Ehlers (Rocket Science For Traders pgs 87-88) and this is my favorite Ehlers Signal To Noise Ratio indicator. Scalpers like to use this indicator because when it is above the dotted line then the stock is trending and not trading sideways. Buy when the indicator line is green and sell when it is red.
Let me know when you want to see me publish other indicators or if you want something custom done!
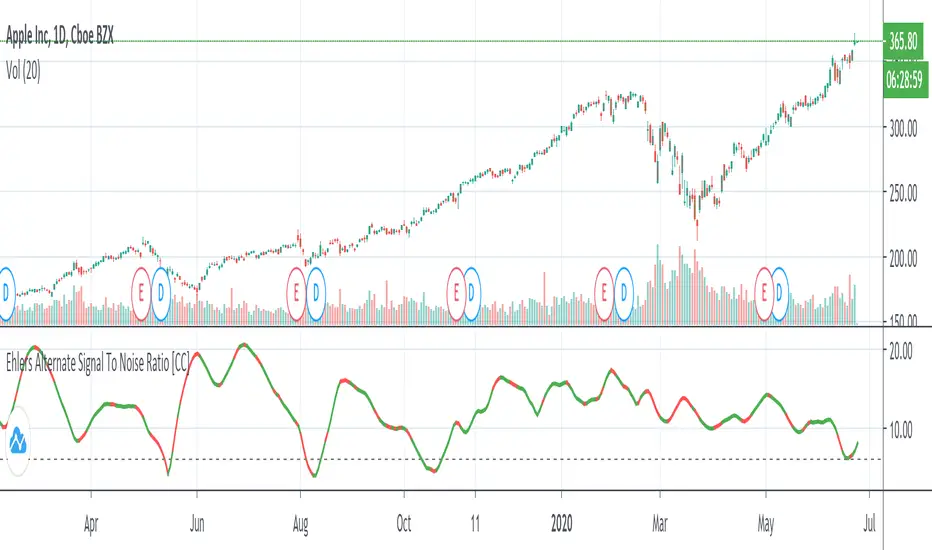
Ehlers Alternate Signal To Noise Ratio [CC]The Alternate Signal To Noise Ratio was created by John Ehlers (Rocket Science For Traders pgs 84-85) and this is a variation of his signal to noise ratio that some scalpers might find more useful than his default signal to noise ratio. You would want to buy and sell when the indicator is above the dotted line because that means the stock is volatile enough to maximize any movement of the trade in either direction. Buy when the indicator line is green and sell when it is red.
Let me know if there are other indicators you would like to see me publish or if you want something custom done!
Ehlers Signal To Noise Ratio [CC]The Signal To Noise Ratio was created by John Ehlers (Rocket Science For Traders pgs 81-82) and this indicator is perfect for all of the scalpers out there! This will let you know when the stock is at a high volatility or not and when to buy or sell. If the indicator crosses over the dotted line then that means the stock is volatile and it is trading flat then it will be below the dotted line. Buy when the indicator line is green and sell when it is red.
This was a custom request so let me know if there are any other scripts you would like me to publish or if you want something custom done!

[LunaOwl] 11 kinds of Adaptive MA Model作品: 11種自適應性平滑模型
It integrates eleven kinds of adaptive moving average method. At first, I just wanted to make a ATR. Later, the price series ±N*ATR mult, to form two series. Then use the concept of support/resistance breakthrough to design it, and then two adaptive series formation channels were formed. Take the average of the two series as the signal. When the price crosses the signal, it's judged to be long or short.
整合了十一種能夠自適應性的移動平均模型。起初只是想要做一個基本款ATR指標,後來將價格加減N個ATR倍數,形成兩條序列形成通道,再使用支撐阻力突破的概念去設計它,再形成兩條自適應性的序列形成通道,再取中間值當成信號。當價格與信號交叉,則判斷作多或者作空。
--------------------------*
Parameter 設置參數
Resolution: The default is "the same as the variety". Is a named constant for resolution input type of input function.
商品分辨率:預設與品種相同。是input函數的時間周期輸入類型的命名常量。
Smoothing: The default is Recursive Moving Average(RMA). It can choose other methods, the table is as follows.
平滑類型:預設是「遞回平均」,可以選擇其它方法,列表如下。
列表 / The table of moving averages is as follows:
//****中英對照表*****##______________________________________
1. 遞回平均 || Recursive Moving Average
2. 簡單平均 || Simple Moving Average
3. 指數平均 || Exponential Moving Average
4. 加權平均 || Weighted Moving Average
5. 船體平均 || Hull Moving Average
6. 成交量加權 || Volume Weighted Moving Average
7. 對稱加權 || Symmetric Weighted Moving Average
8. 雙重指數 || Double Exponential Moving Average
9. 三重指數 || Triple Exponential Moving Average
10. 高斯分佈 || Arnaud Legoux Moving Average
11. 提爾森T3 || Tillson T3 Moving Average
//##_________________________________________________________
Candle Mode: There are three versions, original, two-color and four-color.
燭台模式:預設模式只區分趨勢,可以改成原版蠟燭或四種顏色版本。
Length: The default is 14, usually no need to adjust.
平滑期數:預設值是14,基本上不用理它。
Occurrence: The default is 1. The range is 0~10. The larger the value, the more delayed. If zero will become too sensitive and noise.
滯後性:預設值是1。調整範圍是0~10,數值愈大信號愈延遲,如果值為0,會變得過於敏捷,那將會失去平滑的意義。
N multiple: The default is 0.618, can be set to 1. The range is 0.382~3.000.
倍數N:預設值是0.618,也可以設定1,最低是0.382,最大是3。
--------------------------*
1. Candle Mode can set the original candle, cancel candle trend color changes. However, the background will still be filled.
可以設定顯示原版的蠟燭線,背景與線並不會消失。
2. Four-color version of candles. It shows changes in trends and prices.
四色版本的蠟燭線,可以顯示趨勢與每日收盤價的變化。

[LunaOwl] 智慧型RSI (Smart RSI - a handy tool with less noise)Relative Strength Index is a common technical analysis tool, it is classified as a momentum oscillator, measuring the velocity and magnitude of directional price movements. it is most typically used on a 14-period timeframe, measured on a scale from 0 to 100, with high and low levels marked at 70 and 30.
相對強弱指標是常見的技術分析工具,它被歸類為動量振盪器,用於測量定向價格運動的速度和幅度,通常會使用14期數,擺盪範圍在0到100間,超買超賣分別標記成70、30。
after simple improvement and addition of logical judgment, it becomes a passive judge from subjective judgments, avoid the shortcomings of peoples in watching passivation, and the trade can be more consistent.
經過簡單的改良與添加邏輯判斷,能夠使RSI指標的使用,從主觀的判斷成為被動的確認指標,有效避免人們判斷指標鈍化的主觀缺失,並能夠使得交易更加一致。
--------------------------*
1) parameter
RSI period 1 - default is 14, same as general RSI.
RSI period 2 - default is 5, due to its own formula, the amplitude of the oscillator will become larger and more agile or fast. When the parameter is small.
exponential moving avg of RSI - using the result of RSI period 1 as the source of Ema's formula, the default length is 14, which can filter the excessive agility of RSI period 2 to reduce noise, and compared to using the baseline as the criterion for long and short judgments, The characteristics of exponential moving avg are more suitable to become flexible filtering standards.
Overbought - default is 70, you can set your overbought level.
Oversold - same as above, the default is 30.
2) Options
Open Candle color(開啟蠟燭線趨勢) - choose whether to start the color of the candle.
Open background color(開啟指標背景色) - the default is false, you can turn on.
--------------------------*
1. 設置參數
RSI期數1:預設值是14,是普通的RSI指標。
RSI期數2:預設值是5,由於RSI公式的算法,造成參數愈小擺盪幅度就會變大,反應比較快。
指數平均化的RSI期數1:將RSI期數1的結果帶入指數移動平均公式,預設值14,它能過濾RSI期數2過度敏捷的缺點,減少雜訊,相較於單純使用基準線作為多空判斷標準,用EMA的判斷標準更加因時制宜。
超買線:預設值是70,可以隨意調。
超賣線:預設值是30,一樣的。
2. 設定選項
開啟蠟燭線趨勢:顧名思義。已經幫您開好了。
開啟指標背景色:顏色太淺的話可以調深一點。
--------------------------*
ver.2- adjust new style design and create two options.
修改2: 調整新的樣式設計與建立兩個選項。
--------------------------*
ver.3- Create alert condition. maybe I should refer to the Alert Creation Framework,
there is also room for improvement.
修改3: 建立快訊選項。我應該參考警報創建框架,還有進步空間。
--------------------------*
Indicator Style - 指標樣式
The design uses casual light color style, light gray between overbought and oversold.
--------------------------*
Market Example - 市場範例
1. Bitcoin/Tether, Binance, 1 day
2. Bitcoin/USD, Coinbase, 4 hour
3. EUR/USD, Forex Market, 4 hour
4. GBP/USD, Forex Market, 30 min
5. TAIEX, Taiwan SE Weighted Index, 1 week
--------------------------*
postscript - 後記感想
The purpose of publishing Chinese Scripts is to make Pine close to more Chinese user.
I hope English skills enhancement...staggered writing makes me feel hard.
發布中文腳本的目的,是希望可以讓 Pine 親近更多中文圈的使用者。希望我的英語進步,中英文交錯撰寫有一些困難。
--------------------------*
If you find my works useful, you can give me encouragement. I can buy more books to sophisticated themselves.
如果您發現我的作品有用,可以給我鼓勵。讓我可以買更多書籍來精進自己。
