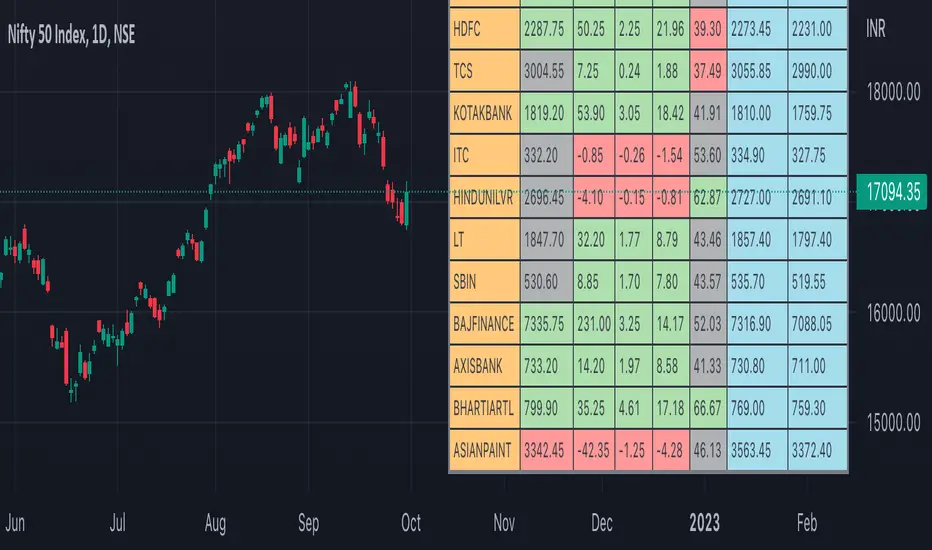
Heavy Weight Stocks for Bank NiftyHeavy Weight Stocks for Bank Nifty
Stocks which are part of Bank Nifty are displayed in the table.
If the %Change > 1 then bold green
If the %Change <1 and >0, then light green
If the %Change < -1 then bold red
If the %Change > -1 and <0 then light green
NSE:BANKNIFTY
NSE:HDFCBANK
NSE:ICICIBANK
NSE:AXISBANK
NSE:KOTAKBANK
NSE:SBIN
NSE:NIFTY
NSE:RELIANCE
NSE:HDFC
NIFTY

Nareshraju CPRHi friends this is Cpr indicator which means central pivot range. it contains supports and resistances to take perfect entry.
Nifty / Banknifty Dashboard by RiTzNifty / Banknifty Dashboard :
Shows Values of different Indicators on current Timeframe for the selected Index & it's main constituents according to weightage in index.
customized for Nifty & Banknifty (You can customize it according to your needs for the markets/indexes you trade in)
Interpretation :-
VWAP : if LTP is trading above VWAP then Bullish else if LTP is trading below VWAP then Bearish.
ST(21,1) : if LTP is trading above Supertrend (21,1) then Bullish , else if LTP is trading below Supertrend (21,1) then Bearish.
ST(14,2) : if LTP is trading above Supertrend (14,2) then Bullish , else if LTP is trading below Supertrend (14,2) then Bearish.
ST(10,3) : if LTP is trading above Supertrend (10,3) then Bullish , else if LTP is trading below Supertrend (10,3) then Bearish.
RSI(14) : Shows value of RSI (14) for the current timeframe.
ADX : if ADX is > 75 and DI+ > DI- then "Bullish ++".
if ADX is < 75 but >50 and DI+ > DI- then "Bullish +".
if ADX is < 50 but > 25 and DI+ > DI- then "Bullish".
if ADX is above 75 and DI- > DI+ then "Bearish ++".
if ADX is < 75 but > 50 and DI- > DI+ then "Bearish+".
if ADX is < 50 but > 25 and DI- > DI+ then "Bearish".
if ADX is < 25 then "Neutral".
MACD : if MACD line is above Signal Line then "Bullish", else if MACD line is below Signal Line then "Bearish".
PDH-PDL : "< PDH > PDL" means LTP is trading between Previous Days High(PDH) & Previous Days Low(PDL) which indicates Rangebound-ness.
"> PDH" means LTP is trading above Previous Days High(PDH) which indicates Bullish-ness.
"< PDL" means LTP is trading below Previous Days Low(PDL) which indicates Bearish-ness.
Alligator : If Lips > Teeth > Jaw then Bullish.
If Lips < Teeth < Jaw then Bearish.
If Lips > Teeth and Teeth < Jaw then Neutral/Sleeping.
If Lips < Teeth and Teeth > Jaw then Neutral/Sleeping.
Settings :
Style settings :-
Dashboard Location: Location of the dashboard on the chart
Dashboard Size: Size of the dashboard on the chart
Bullish Cell Color: Select the color of cell whose value is showing Bullish-ness.
Bearish Cell Color: Select the color of cell whose value is showing Bearish-ness.
Neutral Cell Color: Select the color of cell whose value is showing Rangebound-ness.
Cell Transparency: Select Transparency of cell.
Columns Settings :-
You can select which Indicators values should be displayed/hidden.
Rows Settings :-
You can select which Stocks/Symbols values should be displayed/hidden.
Symbol Settings :-
Here you can select the Index & Stocks/Symbols
Dashboard for Index : select Nifty/Banknifty
if you select Nifty then Nifty spot, Nifty current Futures and the stocks with most weightage in Nifty index will be displayed on the Dashboard/Table.
if you select Banknifty then Banknifty spot, Banknifty current Futures and the stocks with most weightage in Banknifty index will be displayed on the Dashboard/Table.
You can Customise it according to your needs, you can choose any Symbols you want to use.
Note :- This is inspired from "RankDelta" by AsitPati and "Nifty and Bank Nifty Dashboard v2" by cvsk123 (Both these scripts are closed source!)
I'm not a pro Developer/Coder , so if there are any mistakes or any suggestions for improvements in the code then do let me know!

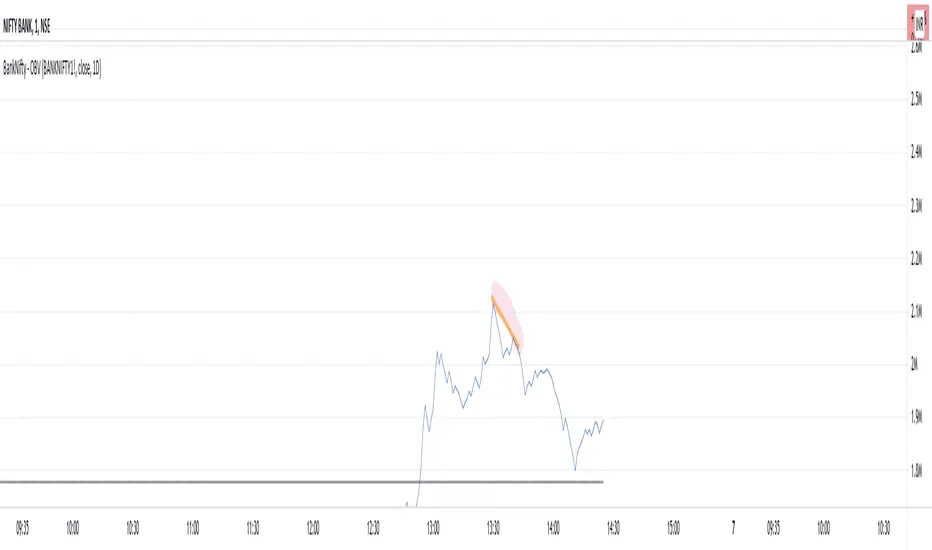
BankNifty - OBVThis script tries to draw OBV for BankNifty using Futures Volume along with Average OBV. For Nifty50 just change the Futures Volume symbol in settings. Look at devations in Price vs OBV or Average OBV breakout.
NSE:NIFTY
NSE:BANKNIFTY
Volume for NiftyBNTo see the volume of Nifty and Banknifty indices we often refer to their Futures chart. With the help of this script, you can directly plot the volume of Nifty Futures over the Nifty chart and Bank Nifty Futures over the Bank Nifty chart.
If the scrip entered is other than Nifty or Bank Nifty it will plot the default volume of that scrip.
Nifty50 Participants - Top 25Nifty50 Index is calculated based on the movements of its participants. Every time you think of why is Index going up/down, who is actively dragging the index either ways, this Indicator gives you answer for the same in realtime!
This indicator will help you in pre-planning your trades based on the movements shown by different stocks of various sectors in Index calculation.
RSI column is an add-on to the participation table which will help you in getting RSI values of different stocks of Nifty 50 at a glance. You will see values getting updated in realtime in live market.
Checkout for customisations in indicator settings.
Note:
1. Participants present in this indicator and their participation percentage is taken from the official NSE website.
2. Table shows Top 25 participants by default. If you want to see less than 25 rows, you can update the input via indicator settings.
Feel free to contribute/comment changes if any! Comment in case of any suggestions :)
- Published by Soham Dixit
Bank Nifty ParticipantsBankNifty Index is calculated based on the movements of its participants. Every time you think of why is Index going up/down, who is actively dragging the index either ways, this Indicator gives you the answer for the same in realtime!
For example : You see HDFCBank and Kotak Bank significantly up while all other banks going down but index reacting in a bullish mode, the answer lies in which Bank is contributing how much to the index! This will help you in pre-planning your trades based on the movements shown by different banks in Index calculation. Or on the other hand, you see HDFCBank on verge of breakout and you have target of 10 points, this indicator will help you in identifying how much the index will react to the 10 points movement shown by HDFC Bank which is the leading participant in Bank Nifty.
RSI column is an add-on to the participation table which will help you in getting RSI values of different banks at a glance. You will see values getting updated in realtime in live market. Checkout for customisations in indicator settings.
Note : Participants present in this indicator and their participation percentage is taken from the official NSE website.
Feel free to contribute/comment changes if any!
- Published by Soham Dixit

Fibonaci Opening Range Candle
Fibonacci Opening Range it is 50% and 0.61% of 5 min or 30min or 1 hour opening candle
search buying opportunities below 0.61
and selling opportunities above 0.50
Also acts as good support and resistance in intraday
BEST RESULTS IN INDEXES
Thanks & Best Regards
Marella Ganesh

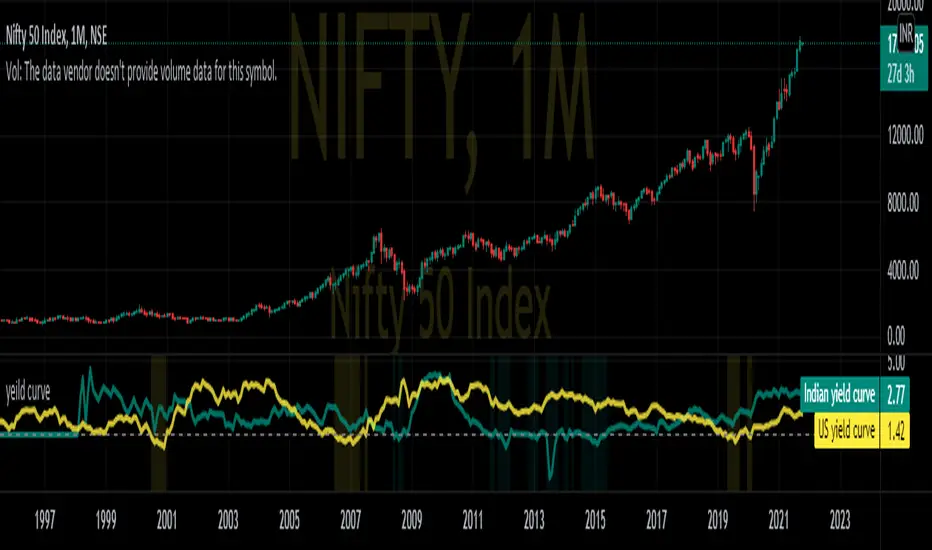
Nifty yield curveREAL-CASE SCENARIO:-
IN10Y(10yr yield t- bill) are govt. backed bonds provide basic interest or coupon rate. If the coupon rate falls below (yield =(1/price) the coupon rates of 3 month bond IN03MY(3m yield t- bill), investors are pessimistic about future growth of the economy.
This pessimistic behavior can be seen in the graph when change in background color.
While optimistic behavior scenario when investors no longer interested in long-term bonds and dumping 10Y T-bills causing yields to raise above short term 3m T-bill .
QuantAnna: Nifty VIX CorrelationNSE:NIFTY
Simple correlation indicator which oscillates around zero
Shows default correlation with NSE:IndiaVix
You can use it to check correlation with any other trading symbol or indices by simply selecting it in the settings.

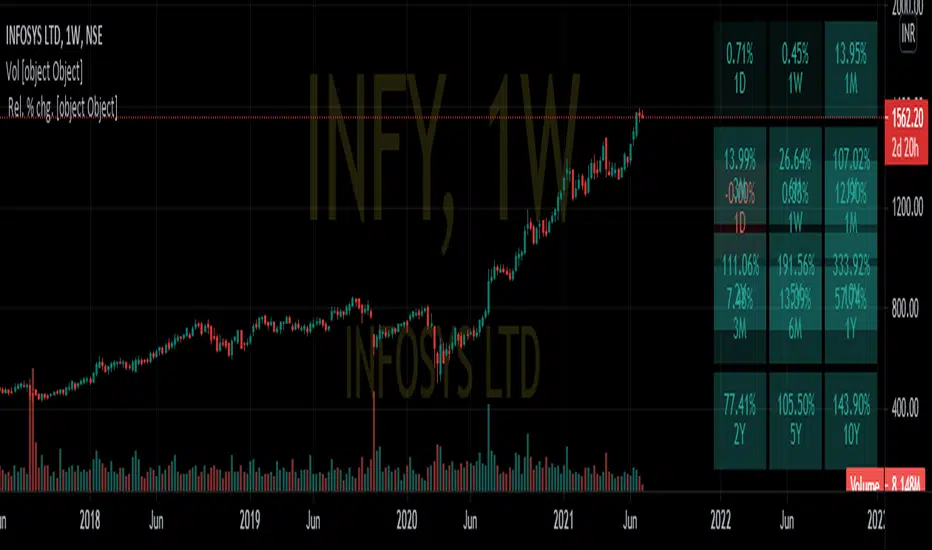
Nifty Relative PerformanceDISCRIPTION:-
This indicator is used to determine relative performance of a stock based on different time intervals as well as compared to benchmark indices as Nifty 50,Nift IT, Nifty auto etc.
USE CASE SCENARIO:-
The top right table provide performance of stock based on different interval
while the bottom table depicts its relative performance compared to an index
eg:-
INFY compared to Nifty 50
&
INFY compared to Nifty IT
DISCLAIMER:-
if using an android device kindly toggle full-screen mode and view it horizontally
In desktop full screen mode may provide better comprehensive view
BankNifty - VWAP + StdDev Bands- By Default the script draws Daily VWAP for Bank Nifty based on Futures Volume or underlying Index Stocks based on user input
- Optionally one may Anchor it to Week/Month etc or anchor it from a particular Time.
- It also draws 3 Standard Deviation Bands from the VWAP based on User Input.
- Optionally draws Previous VWAP Close for and Bullish or Bearish Move.
- It works with NIFTY 50 as well but only using Futures Volume(Pine limitation to number of security calls) . Please change the Symbol and Futures Volume symbol to "NSE:NIFTY" and "NSE:NIFTY1!" NSE:BANKNIFTY NSE:NIFTY

Bank Nifty DashboardThis shows a performance glance of Dow, India Vix and Major Constituents of Bank Nifty. Which will help to take quick decision.
Style settings
Normalized Change Mode: Allows the user to access a different interpretation of the indicator by showing the normalized first differences of each indicator in the dashboard instead of their sign
Dashboard Location: Location of the dashboard on the chart
Dashboard Size: Size of the dashboard on the chart
Text/Frame Color: Determines the color of the frame grid as well as the text color
Bullish Cell Color: Determines the color of cell associated with a rising indicator direction
Bearish Cell Color: Determines the color of cell associated with a decreasing indicator direction
Cell Transparency: Transparency of each cell
Usage
This will help to monitor the banks Performance on various time frames . You can change the stock list according to your usage/Index.
All showing in green indication strong momentum.

Market Movers: Sectoral IndexThe indicator will show the Sectors which are leading or lagging NIFTY50 index based on Alpha & Beta values. Stock selection can be done based on the respective Sectors.
Look for alpha & beta values.
Prefer one with high beta.
Greens are leaders & Blues are lagers.
This don't completely indicates a trend, but it can give the overview of a major trend & market movers.
Gray line is the base index NIFTY50, it is Zero.
Turn on Indicator Name Label in Settings > Chart Settings.
In intraday or positions, in a leading Sector there will be a leading stock, spot it out.
Make a sector wise watchlist of stocks.
Use higher or Daily timeframe for Swing trades.
Detailed descriptions are available in my previous Alpha & Beta indicators.

Wide BarsSimple scripts show the wide range bars within in the look back period, visualizing the bigger momentum.
Added four exponential moving averages which define the trend of the instrument.
Wide range candles in the direction of overall trend on higher timeframes; give confluence of higher participation in the same direction.
Note : Decent volume above the average volume with wide range candle adds more value.

Screener: Alpha & Beta IndexThis is a Index Screener which can short list the major Sectors contributing to NIFTY movement that day.
This helps in sector based trading, in which we can trade in the stocks which falls under that particular sector.
No need to roam around all the stocks in the whole watchlist.
It is recommended to create sector wise watchlist of all sectors. It will be easier to concentrate in only one sector.
For example in IT sector index there are certain stocks which contribute to the movement of IT sector.
This will be available in NSE (or exchange website).
For detailed description check out the descriptions in my previous 2 Alpha and Beta indicators.
Combine and use this screener with my previous Alpha & Beta indicator.

Nifty 20 VolumeThis script computes the volume for Nifty 50 index. I am using top 20 stocks here that constitute about 75% of the Nifty 50. I had used the script created by @shijithlal as a base for this. He has used all 45-50 stocks in his script. You can look that up if you want a more accurate volume.

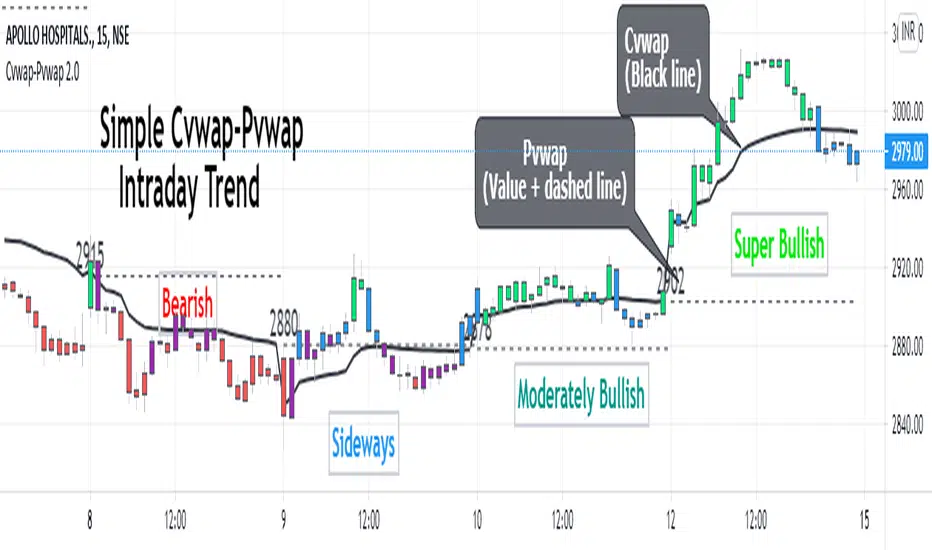
Cvwap-Pvwap 2.0A simple vwap based Intraday trend indicator.
Volume-Weighted Average Price (VWAP) - the average price weighted by volume, starts when trading opens and ends when it closes. This can help institutions buy or sell in large orders, without disturbing the market.
After buying or selling, institutions compare instrument price to closing VWAP values at end of the day.
For big financial institutions;
A buy order executed below the VWAP value, considered a good fill because the security was bought at a below average price.
A sell order executed above the VWAP would be deemed a good fill because it was sold at an above average price.
Simple price based moving average is not helpful for them; = as it doesn't incorporates volume traded. Hence - VWAP :)
So how it helps us in decoding the IntraDay-trend? - Through a 2 day vwap co-relation.
So, Closing value of previous day vwap = Pvwap
Today's running vwap = Cvwap
Defining the IntraDay Trend:
Moderately Bullish = candle closing price above Pvwap but below Cvwap
Super Bullish = Closing price is above both (Cvwap and Pvwap)
Moderately Bearish = Closing price is above Cvwap but below Pvwap
Super Bearish = Closing Price is below both (Cvwap and Pvwap)
A big gap between the Cvwap and the candle closing price defines the strong participation from institutions in that direction. (Strong Trend)
Moving with the smart money, in the overall trend is a wise decision for any intraday trader and this helps at its best.
Custom GAP UP scanner for NIFTY StocksThe security function can be called 40 times in a codescript. We can therefore scan about 40 stocks out of NIFTY 50 stocks with a single script.
This code can be modified to search for other scripts by changing the condition function
condition() => open > (close * 1.0025)
Only stocks which have gap up of 0.25% or more will be reported.

MAST TrendHello Traders !!
This is a simple super trend based MAST trend.
By default the supertrend is 10 period with 3 ATR multiplier.
A moving average is used to benefit from the pullback entries.
Bullish Pullback : Price above Supertrend & below MA
Bullish: Price above Supertrend and above MA
Bearish pullback : Price below Supertrend & above MA
Bearish : Price below Supertrend & below MA
Refer to investopedia or any relevant articles for in detail about Supertrend.

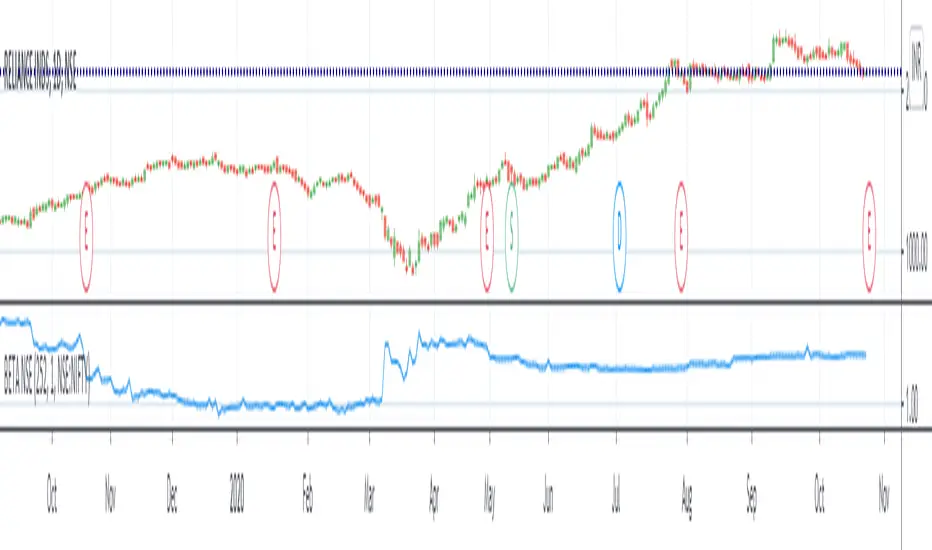
BETA (against any benchmark index - defaulted to NSE:NIFTY)Beta value of a stock relative to benchmark index. Thanks to Ricardo Santos for the original script. This script is adapted from it.
To understand beta, refer Investopedia link: www.investopedia.com
A beta value of 1 means the stock is directly correlated to benchmark index - volatility would be same as overall market.
Beta value less than 1 and greater than 0 means the stock is less volatile than the market.
Beta value more than 1 would mean the stock is more volatile than the market.
A beta value of 1.2 would roughly translate to the stock being 20% more volatile than the overall market.
A negative beta value indicates the stock is inversely correlated to market.
In the example chart, you can see the Beta value change in NSE:RELIANCE with respect to NSE:NIFTY.
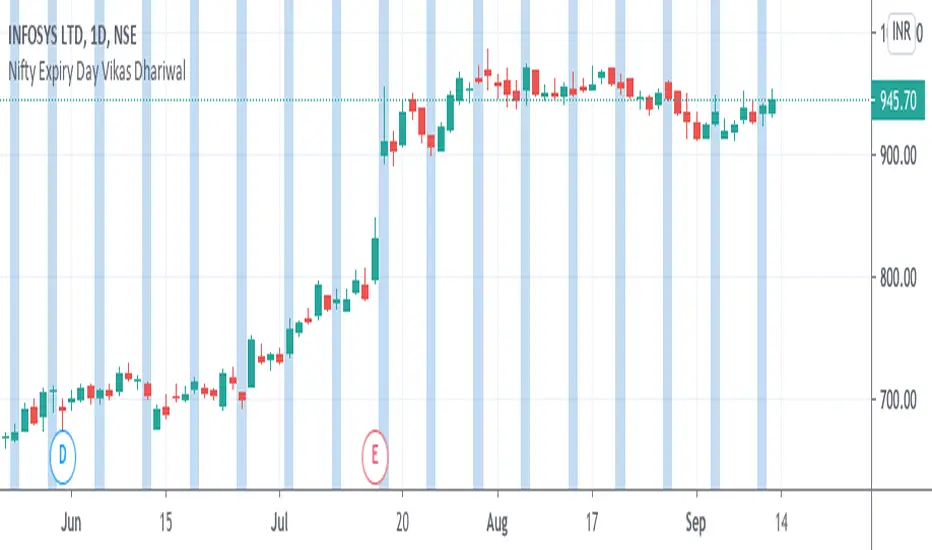
Nifty Expiry Day Vikas DhariwalStrategy for Expiry day plan
Here you can find easy expiry day of nifty and bank nifty
mark Thursday with color to find that day for test any expiry strategy plan
thanks call for more updated 8287335651