OPEN-SOURCE SCRIPT
Güncellendi Nifty50 Participants - Top 25
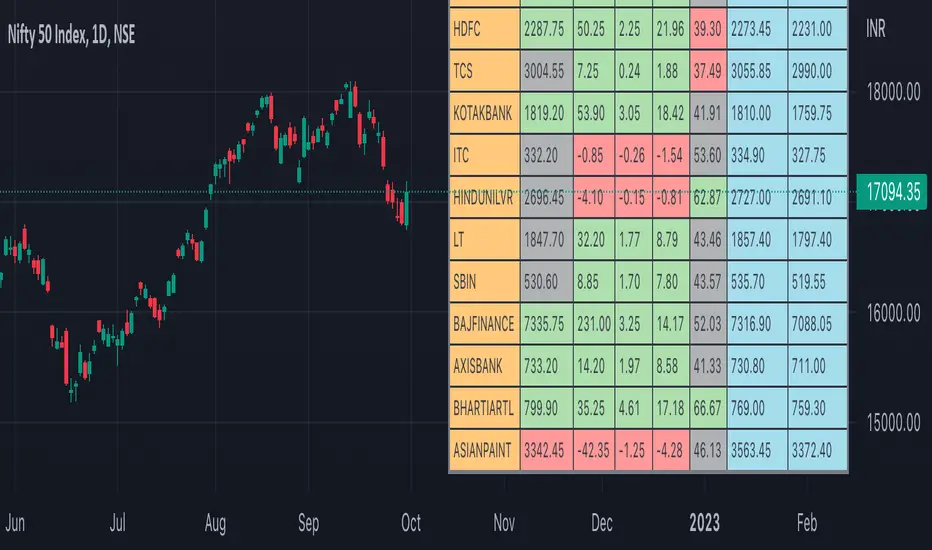
Nifty50 Index is calculated based on the movements of its participants. Every time you think of why is Index going up/down, who is actively dragging the index either ways, this Indicator gives you answer for the same in realtime!
This indicator will help you in pre-planning your trades based on the movements shown by different stocks of various sectors in Index calculation.
RSI column is an add-on to the participation table which will help you in getting RSI values of different stocks of Nifty 50 at a glance. You will see values getting updated in realtime in live market.
Checkout for customisations in indicator settings.
Note:
1. Participants present in this indicator and their participation percentage is taken from the official NSE website.
2. Table shows Top 25 participants by default. If you want to see less than 25 rows, you can update the input via indicator settings.
Feel free to contribute/comment changes if any! Comment in case of any suggestions :)
- Published by Soham Dixit
Sürüm Notları
Fixed issue of variable table length on value changeSürüm Notları
Updated Weightage for Top 25 ParticipantsSürüm Notları
Major Update- Dynamic Weightages (Now you can edit/update weightages) from Script settings
- More columns ? Difficulty in visibility ! Now you have an option to hide/unhide column from settings
- Table Text Color can be changed from settings
Happy Trading :)
Sürüm Notları
Default Colors changedSürüm Notları
- Option to change Text Size- More customisations added in Script settings
Sürüm Notları
Minor Issues FixedSürüm Notları
- Added RSI Min Value. If RSI is between Min and Max Value, rsi column will have neutral color else bull or bear color accordingly- Added optional Previous Day High & Previous Day Low columns. You can switch them on from script settings. Default they are not visible.
- LTP Column will now hold bull, bear or neutral color basis current price
Açık kaynak kodlu komut dosyası
Gerçek TradingView ruhuna uygun olarak, bu komut dosyasının oluşturucusu bunu açık kaynaklı hale getirmiştir, böylece yatırımcılar betiğin işlevselliğini inceleyip doğrulayabilir. Yazara saygı! Ücretsiz olarak kullanabilirsiniz, ancak kodu yeniden yayınlamanın Site Kurallarımıza tabi olduğunu unutmayın.
Feragatname
Bilgiler ve yayınlar, TradingView tarafından sağlanan veya onaylanan finansal, yatırım, işlem veya diğer türden tavsiye veya tavsiyeler anlamına gelmez ve teşkil etmez. Kullanım Şartları'nda daha fazlasını okuyun.