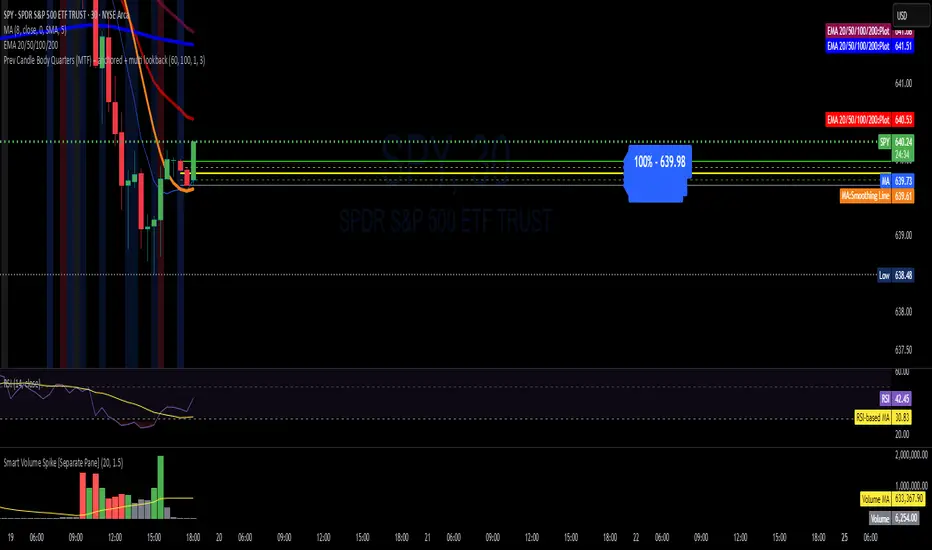
Prev Candle Quarters (MTF) – % + PriceThis TradingView indicator visualizes quarter levels (25%, 50%, 75%, 100%) of the previous candle body from a user-selected higher timeframe, helping traders identify key reaction zones within a candle’s structure.
ulti-Timeframe Input: Choose between 15m, 1H, or 2H candles for your measurement basis.
Body-Based Calculation: Measures from open to close of the previous candle (not wick-to-wick), reflecting where price actually closed.
Precise Quarter Levels: Automatically draws horizontal lines at 25%, 50%, 75%, and 100% of the candle body.
Custom Toggles: Enable or disable each individual level via checkboxes.
Price + % Labels: Each level includes a clean label showing the exact price and corresponding percentage.
Multitimeframe
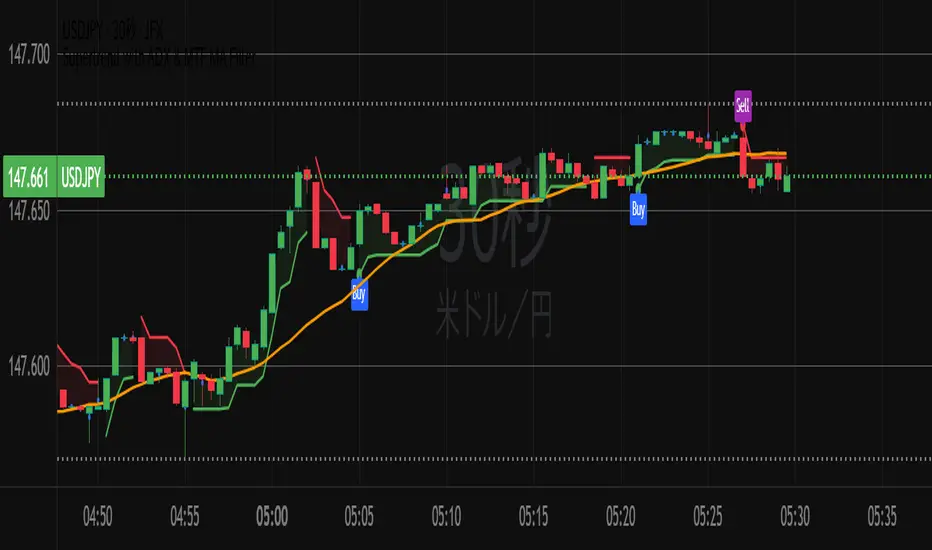
Supertrend with ADX & MTF MA Filter# **Supertrend with ADX & MTF MA Filter - Comprehensive Explanation**
---
## **1. Purpose of This Indicator**
This indicator combines three powerful technical analysis tools to create a robust trading system:
✅ **Supertrend** (Trend-following)
✅ **ADX Filter** (Trend strength confirmation)
✅ **MTF MA Filter** (Multi-timeframe trend direction confirmation)
**Primary Goals:**
✔ **Identify high-probability trend reversals** with confirmation from multiple indicators
✔ **Filter out weak trends** using ADX (Average Directional Index)
✔ **Add higher timeframe context** with MTF (Multi-TimeFrame) Moving Average
✔ **Reduce false signals** by requiring confluence between all three components
---
## **2. Core Logic & Components**
### **A. Supertrend (Base Indicator)**
- **Calculation:**
```pine
up = hl2 - (Multiplier * ATR(Periods))
dn = hl2 + (Multiplier * ATR(Periods))
```
- **Bullish trend** when price > `up` (green line)
- **Bearish trend** when price < `dn` (red line)
- **Why Supertrend?**
- Simple yet effective trend-following system
- Adapts to volatility via ATR (Average True Range)
---
### **B. ADX Filter (Trend Strength Confirmation)**
- **ADX Calculation:**
```pine
= calcADX(adxLength, adxSmoothing)
strongTrend = adxVal >= adxThreshold
```
- **ADX > Threshold (Default: 20)** = Strong trend
- **DI+ > DI-** = Bullish momentum
- **DI- > DI+** = Bearish momentum
- **Why ADX?**
- Avoids trading in choppy markets (low ADX = weak trend)
- Confirms if Supertrend signals occur in a strong trend
---
### **C. MTF MA Filter (Higher Timeframe Trend Alignment)**
- **Moving Average Calculation:**
```pine
= getMA(maSource, maLength, maType, maTF)
```
- **MA Type:** SMA, EMA, WMA, or DEMA
- **Timeframe:** Any (1m, 5m, 1H, 4H, D, W, M)
- **Trend Direction:**
- **Buy Signal:** MA must be **rising**
- **Sell Signal:** MA must be **falling**
- **Why MTF MA?**
- Aligns trades with the **higher timeframe trend**
- Reduces counter-trend entries
---
## **3. How to Use This Indicator**
### **A. Buy Conditions (All Must Be True)**
1. **Supertrend turns bullish** (price crosses above `up` line)
2. **ADX ≥ Threshold** (trend is strong)
3. **Higher timeframe MA is rising** (confirms bullish bias)
### **B. Sell Conditions (All Must Be True)**
1. **Supertrend turns bearish** (price crosses below `dn` line)
2. **ADX ≥ Threshold** (trend is strong)
3. **Higher timeframe MA is falling** (confirms bearish bias)
### **C. Recommended Settings**
| Parameter | Recommended Value | Description |
|-----------|------------------|-------------|
| **ATR Period** | 14 | Sensitivity of Supertrend |
| **Multiplier** | 1.5-3.0 | Adjust for volatility |
| **ADX Threshold** | 20-25 | Higher = stricter trend filter |
| **MA Length** | 20-50 | Smoothness of trend filter |
| **MA Timeframe** | 1H/D | Align with trading style |
---
## **4. Trading Strategies**
### **A. Trend-Following Strategy**
- **Enter:** When all 3 conditions align (Supertrend + ADX + MA)
- **Exit:** When Supertrend flips or ADX drops below threshold
### **B. Pullback Strategy**
- **Wait for:**
- Supertrend in trend direction
- ADX remains strong
- MA still aligned
- **Enter:** On pullback to Supertrend line
### **C. Multi-Timeframe Confirmation**
- **Intraday traders:** Use 4H/D MA for trend bias
- **Swing traders:** Use D/W MA for trend bias
---
## **5. Advantages Over Standard Supertrend**
✔ **Fewer false signals** (ADX filters weak trends)
✔ **Higher timeframe alignment** (avoids trading against larger trends)
✔ **Customizable MA types** (SMA, EMA, WMA, DEMA)
✔ **Works on all markets** (stocks, forex, crypto)
---
### **Final Thoughts**
This indicator is designed for traders who want **high-confidence trend signals** by combining:
🔹 **Supertrend** (entry trigger)
🔹 **ADX** (trend strength filter)
🔹 **MTF MA** (higher timeframe trend alignment)
By requiring all three components to align, it significantly improves signal quality compared to standalone Supertrend systems.
**→ Best for:** Swing trading, trend-following, and avoiding choppy markets.
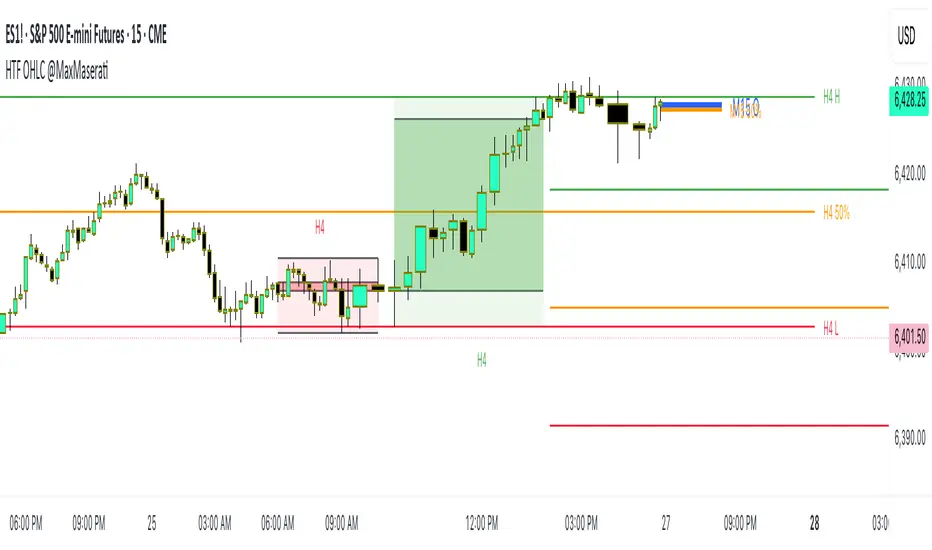
HTF OHLC Candle + 50% @MaxMaseratiHTF OHLC Candle + 50% @MaxMaserati
This advanced multi-timeframe indicator displays higher timeframe OHLC data as visual candle boxes and extended key levels on lower timeframe charts, providing essential context for institutional trading decisions.
Core Functionality:
Multi-Timeframe Box Display:
Main Timeframe Box (Default H4): Shows complete higher timeframe candles as colored boxes with separate body and wick visualization, including bullish (green) and bearish (red) candle representation with customizable transparency levels.
Independent Box 2 (Default M15): Secondary timeframe display with lime/fuchsia color scheme, allowing traders to monitor intermediate timeframes simultaneously with different visual styling.
Independent Box 3 (Default H1): Third independent timeframe with blue/orange color scheme, providing additional context for multi-timeframe analysis and confluence identification.
OHLC Level Analysis:
Each timeframe box includes individual Open, High, Low, and Close level lines with customizable colors and visibility settings. These levels act as key support and resistance zones that institutional traders often respect.
50% Retracement Levels:
Automatic calculation and display of 50% levels between each timeframe's high and low, representing critical equilibrium zones where price often finds support or resistance during retracements.
Extended Line System:
Current Live Timeframe Extended Lines: Real-time extension of the forming candle's Open, High, Low, and 50% levels with customizable line weights and label positioning.
TF2 Extended Lines (Default H4): Previous completed candle's key levels extended forward, showing immediate higher timeframe reference points for current price action.
TF3 Extended Lines (Default Daily): Longer-term reference levels from daily or weekly timeframes, providing macro trend context and major institutional levels.
Key Features:
Smart Timeframe Detection: Only displays boxes for timeframes higher than the current chart timeframe, preventing redundant information and maintaining chart clarity.
Global Box Limit Control: Intelligent cleanup system that maintains optimal performance by limiting total displayed elements while preserving the most recent and relevant timeframe periods.
Comprehensive Customization: Full control over colors, transparency, line weights, label sizes, and visibility for each timeframe component, allowing personalized setups for different trading styles.
Label System: Automatic timeframe identification labels (H4, M15, D1, etc.) positioned on each box for instant timeframe recognition and clear multi-timeframe organization.
Current Candle Options: Optional display of forming/current candles for each timeframe, enabling real-time monitoring of developing price action and potential setup completion.
This indicator is essential for traders utilizing multi-timeframe analysis, institutional trading concepts, and higher timeframe confluence strategies, providing clear visual representation of key levels and candle structures that drive major market movements.
Triple Momentum Core v1🧠 Technical Structure:
Triple Momentum Core analyzes the underlying wave of price movement through a three-stage system:
1. 🔵 Follow Line – The First Spark of Momentum:
Constructed using Bollinger Bands and ATR, this line detects the very first signs of directional price expansion. It gently whispers when the market begins stretching with force in one direction.
2. 🟢 SuperTrend – Confirmation and Directional Validation:
After the initial move, SuperTrend acts as the second checkpoint — validating whether the price action is evolving into a genuine trend or fading out. It confirms whether the impulse has the strength to sustain.
3. 🔴 PMax – Core Trend & Structural Anchor:
Based on Moving Average and ATR logic, PMax tracks the heartbeat of the trend. It serves as a dynamic structural boundary — critical for identifying trend continuation and managing risk.
4. 🟡 PMax MA Line – Smooth Trend Pulse & Adaptive Guide:
This yellow moving average line within the PMax system softly follows the overall trend flow, without reacting to sharp price noise. It acts as a balanced, stable guide to gauge the solidity of the trend’s body structure.
(If you prefer a cleaner view without any moving average lines, you can disable it from the settings.)
🧠 Technical Structure:
Triple Momentum Core analyzes the underlying wave of price movement through a three-stage system:
1. 🔵 Follow Line – The First Spark of Momentum:
Constructed using Bollinger Bands and ATR, this line detects the very first signs of directional price expansion. It gently whispers when the market begins stretching with force in one direction.
2. 🟢 SuperTrend – Confirmation and Directional Validation:
After the initial move, SuperTrend acts as the second checkpoint — validating whether the price action is evolving into a genuine trend or fading out. It confirms whether the impulse has the strength to sustain.
3. 🔴 PMax – Core Trend & Structural Anchor:
Based on Moving Average and ATR logic, PMax tracks the heartbeat of the trend. It serves as a dynamic structural boundary — critical for identifying trend continuation and managing risk.
4. 🟡 PMax MA Line – Smooth Trend Pulse & Adaptive Guide:
This yellow moving average line within the PMax system softly follows the overall trend flow, without reacting to sharp price noise. It acts as a balanced, stable guide to gauge the solidity of the trend’s body structure.
(If you prefer a cleaner view without any moving average lines, you can disable it from the settings.)
💡 Why “Triple Momentum Core”?
Because this indicator doesn’t just detect movement — it breaks it down into its essential phases:
Ignition, validation, and confirmation.
Each layer captures a unique and essential part of price behavior:
The first reaction (Follow Line) ignites the initial spark.
The second reaction (SuperTrend) confirms whether that spark will become a real trend.
The third and final layer (PMax) structurally anchors and follows that trend.
That’s why we call it Triple Momentum Core:
A synchronized 3-engine momentum system working in harmony to capture the lifecycle of a trend — from spark to structure.

S&R Zones MTF (TechnoBlooms)S&R Zones MTF – Multi-Timeframe Support & Resistance Boxes
🔍 Overview
S&R Zones MTF is a professional-grade yet beginner-friendly indicator that dynamically plots Support & Resistance zones across multiple timeframes, helping traders recognize high-probability reversal areas, entry confirmations, and price reaction points.
This tool visualizes structured zones as colored boxes, allowing both new and experienced traders to analyze multi-timeframe confluence with ease and clarity.
🧠 What Is This Indicator?
S&R Zones MTF automatically detects the most significant support and resistance levels from up to four custom timeframes, using a configurable lookback period. These zones are displayed as colored horizontal boxes directly on the chart, making it easy to:
Spot where price has historically reacted
Identify potential reversal or breakout zones
Confirm entries with institutional-style precision
🛠️ Key Features
✅ Multi-Timeframe Zone Detection (up to 4 timeframes)
📦 Auto Plotted Boxes for Support (Blue) & Resistance (Pink)
🧱 Dynamic Height based on average price range or fixed input
🏷️ Timeframe Labels to instantly identify zone origin
🎛️ Customizable inputs: Lookback length, box color, height style
🔁 Real-time updates as price structure changes
🎓 Educational & Easy to Use
Whether you’re a new trader learning about price structure, or a professional applying institutional concepts, this tool offers an educational layout to understand:
How price respects historic zones
Why multi-timeframe zones offer stronger confluence
How to use zones for entry, exit, or risk placement
📈 How to Use (Multi-Timeframe Strategy)
Select Your Timeframes – Customize up to 4 higher timeframes (e.g., 1m, 5m, 15m, 1h).
Observe Overlapping Zones – When multiple timeframes agree, those zones are more significant.
Entry Confirmation – Wait for price to reach a zone, then look for reversal patterns (engulfing candle, pin bar, etc.)
Combine with Other Tools – Use alongside indicators like RSI, MACD, or Order Blocks for added confidence.
💡 Pro Tips
Zones from higher timeframes (1H, 4H) are often more powerful and reliable.
Confluence matters: If a 15m support zone aligns with a 1H support zone — that's a high-probability reaction area.
Use break-and-retest strategies with zone rejections for sniper entries.
Enable "Auto Height" for a more adaptive, volatility-based zone display.
🌟 Summary
S&R Zones MTF blends precision, clarity, and professional analysis into a visual structure that’s easy to understand. Whether you're learning support & resistance or optimizing your MTF edge — this tool will bring clarity to your charts and confidence to your trades.

Daily Weekly Monthly Highs & Lows [Dova Lazarus]Daily Weekly Monthly Highs & Lows
📊 Overview
This Pine Script indicator displays key support and resistance levels by plotting the highs and lows from Daily, Weekly, and Monthly timeframes on your current chart. It's designed as an educational tool to help traders understand multi-timeframe analysis and identify significant price levels.
🎯 Key Features
Multi-Timeframe Support & Resistance
- Daily Levels: Shows previous daily highs and lows
- Weekly Levels: Displays weekly highs and lows
- Monthly Levels: Plots monthly highs and lows
- Smart Display: Only shows relevant timeframes based on your current chart timeframe
Fully Customizable Appearance
- Individual Colors: Set unique colors for each timeframe
- Line Styles: Choose between Solid, Dashed, or Dotted lines
- Line Width: Adjust thickness from 1-4 pixels
- Lookback Periods: Control how many historical levels to display
User-Friendly Options
- Enable/Disable: Toggle any timeframe on/off
- Line Extension: Option to extend lines into the future
- Clean Interface: Organized settings groups for easy configuration
🔧 Settings
Timeframes Group
- Show Daily/Weekly/Monthly Levels: Enable or disable each timeframe
- Lookback Periods: Number of historical levels to display (1-10)
Line Settings Group
- Color: Choose custom colors for each timeframe
- Style: Select line appearance (Solid/Dashed/Dotted)
- Width: Set line thickness (1-4 pixels)
Display Options Group
- Extend Lines Forward: Project lines 20 bars into the future
📈 How to Use
1. Add to Chart: Apply the indicator to any timeframe chart
2. Configure Timeframes: Enable the timeframes you want to see
3. Customize Appearance: Set colors and line styles for easy identification
4. Identify Levels: Use the plotted levels as potential support/resistance zones
5. Plan Trades: Look for price reactions at these key levels
💡 Trading Applications
- Support & Resistance: Identify key price levels where reversals may occur
- Entry Points: Look for bounces or breaks at these levels
- Stop Loss Placement: Use levels to set logical stop losses
- Target Setting: Previous highs/lows can serve as profit targets
- Multi-Timeframe Analysis: Understand the bigger picture context
🎓 Educational Value
This indicator is perfect for:
- Learning Pine Script: Clean, well-commented code structure
- Understanding Multi-Timeframe Analysis: See how different timeframes interact
- Practicing Technical Analysis: Identify key support/resistance concepts
- Code Study: Full variable names and detailed comments for learning
⚙️ Technical Details
- Version: Pine Script v6
- Overlay: True (plots directly on price chart)
- Max Lines: 500 (handles multiple timeframes efficiently)
- Compatibility: Works on all timeframes (shows relevant levels only)
🔍 What Makes This Different
- Educational Focus: Designed for learning with clear code structure
- Simplified Interface: Easy-to-use settings without overwhelming options
- Visual Clarity: Clean line display with customizable appearance
- Practical Application: Real trading tool, not just a demonstration
📋 Requirements
- TradingView account (any plan)
- Basic understanding of support/resistance concepts
- Any chart timeframe (indicator adapts automatically)
🚀 Quick Start
1. Add indicator to your chart
2. Default settings work great out of the box
3. Customize colors if desired (Green=Daily, Orange=Weekly, Red=Monthly)
4. Watch for price reactions at the plotted levels
5. Use as part of your technical analysis toolkit
---
*This indicator is designed as an educational tool and should be used in conjunction with other forms of analysis. Past performance does not guarantee future results.*

BB with Heikin Ashi + Reversal CheckThis indicator combines Bollinger Bands (BB) with Heikin Ashi candles to detect potential reversal points after price breaks the BB boundaries. It works on any symbol and timeframe, retrieving Heikin Ashi data via request.security().
Core Features
Heikin Ashi Candle Plot
Smooths price action by using Heikin Ashi candles instead of regular candles.
Candles are plotted directly on the chart with green (bullish) and red (bearish) colors.
Bollinger Bands (BB)
Calculated from Heikin Ashi close price.
Includes Basis (MA), Upper Band, and Lower Band, with customizable MA type, length, and standard deviation multiplier.
Break & Reversal Detection
The indicator tracks whether the price has broken above the Upper Band (p1) or below the Lower Band (p2).
It remembers the last breakout direction until the opposite breakout occurs (mutually exclusive logic).
Signal Logic
Long Signal (▲):
Price was previously below the Lower Band and then reversed upward (BB Lower rising + Heikin Ashi candle rising).
Short Signal (▼):
Price was previously above the Upper Band and then reversed downward (BB Upper falling + Heikin Ashi candle falling).
Alerts
Custom alert conditions trigger when Long or Short signals occur, allowing automated notifications or bot integration.
Use Cases
✅ Swing Trading / Trend Reversal – Identify potential bottom/top reversals after BB breakouts.
✅ Mean Reversion Strategies – Enter trades when the price reverts to the BB mean after an extreme breakout.
✅ Multi-Timeframe Analysis – Works with any timeframe and symbol via request.security().
Customization
MA Type: SMA, EMA, RMA, WMA, VWMA
BB Length & StdDev Multiplier
Timeframe & Symbol Selection

[Pandora] Laguerre Ultimate Explorations MulticatorIt's time to begin demonstrations differentiating the difference between known and actual feasibility beyond imagination... Welcome to my algorithmic twilight zone .
INTRODUCTION:
Hot off my press, I present this Laguerre multicator employing PSv6.0, originally formulated by John Ehlers for TASC - July 2025 Traders Tips. Basically I transcended Ehlers' notions of transversal filtration with an overhaul of his Laguerre design with my "what if" Pandora notions included. Striving beyond John Ehlers' original intended design. This action packed indicator is a radically revamped version of his original filter using novel techniques. My aim was to explore whether providing even more enhanced responsiveness and lesser lag is possible and how. Presented here is my mind warping results to witness.
EHLERS' LAGUERRE EXPLAINED:
First and foremost, the concept of Ehlers' Laguerre-izing method deserves a comprehensive deep dive. Ehlers' Laguerre filter design, as it functions originally, begins with his Ultimate Smoother (US) followed by a gang of four LERP (jargon for Linear intERPolation) filters. Following a myriad of cascading LERPs is a window-like FIR filter tapped into the LERP delay values to provide extra smoothness via the output.
On a side note, damping factor controlled LERP filters resemble EMAs indeed, but aren't exactly "periodic" filters that would have a period/length parameter and their subsequent calculations. I won't go into fine-grained relationship details, but EMA and LERP are indeed related in approach, being cousins of similar pedigree.
EXAMINING LAGUERRE:
I focused firstly on US initialization obstacles at Pine's bar_index==0 with nz() in abundance. The next primary notion of intrigue I mostly wondered about was, why are there four LERP elements instead of fewer or more. Why not three or why not two LERPs, etc... 1-4-6-4-1, I remember seeing those coefficients before in high pass filters.
Gathering my thoughts from that highpass knowledge base, I devised other tapped configuration modes to inspect their behavior out of curiosity. Eureka! There is actually more to Laguerre than Ehlers' mind provided, now that I had formulated additional modes. Each mode exhibits it's own lag/smoothness characteristics better than the quad LERPed version. I narrowed it down to a total of 5 modes for exploration. Mode 0 is just the raw US by itself.
ANALYZING FILTER BEHAVIORS:
Which option might be possibly superior, and how may I determine that? Fortunately, I have a custom-built analyzer allowing me to thoroughly examine transient responses across multiple periodicities simultaneously, providing remarkable visual insights.
While Ehlers has meagerly touched upon presenting general frequency responses in his books, I have excelled far beyond that. This robust filter analysis capability enables me to observe finer aspects hidden to others, ultimately leading to the deprecation of numerous existing filters. Not only this, but inventing entirely new species of filtration whether lowpass, highpass, or bandpass is already possible with a thorough comprehensive evaluation.
Revealing what's quirky with each filter and having the ability to discover what filters may be lacking in performance, is one of it's implications. I'm just going to explain this: For example US has a little too much overshoot to my liking, along with nonconformant cutoff frequency compliance with the period parameter. Perhaps Ehlers should inspect US coefficients a bit closer... I hope stating this is not received in an ill manner, as it's not my intention here.
What this technically eludes to is that UltimateSmoother can be further improved, analogous to my Laguerre alterations described above. I will also state Laguerre can indeed be reformulated to an even greater extent concerning group delay, from what I have already discussed. Another exciting time though... More investigative research is warranted.
LAGUERRE CONCLUSIONS:
After analyzing Laguerre's frequency compliance, transient responses, amplitudes, lag, symmetry across periodicities, noise rejection, and smoothness... I favor mode 3 for a multitude of reasons over the mode 4 configuration, but mostly superb smoothing with less lag, AND I also appreciated mode 1 & 2 for it's lower lag performance options.
Each mode and lag (phase shift) damping value has it's own unique characteristics at extremes, yet they demonstrate additional finesse in it's new hybrid form without adding too much more complexity. This multicator has a bunch of Laguerre filters in the overlay chart over many periodicities so you can easily witness it's differing periodic symmetries on an input signal while adjusting lag and mode.
LAGUERRE OSCILLATOR:
The oscillator is integrated into the laguerreMulti() function for the intention of posterity only. I performed no evaluation on it, only providing the code in Pine. That wasn't part of my intended exploration adventure, as I'm more TREND oriented for the time being, focusing my efforts there.
Market analysis has two primary aspects in my observations, one cyclic while the other is trending dynamics... There's endless oscillators, but my expectations for trend analysis seems a little lesser explored in my opinion, hence my laborious trend endeavors. Ehlers provided both indicator facets this time around, and I hope you find the filtration aspect more intriguing after absorption of this reading.
FUNCTION MODULES EXPLAINED:
The Ultimate Smoother is an advanced IIR lowpass smoothing filter intended to minimize noise in time series data with minimal group delay, similar to a traditional biquad filter. This calculation helps to create a smoother version of the original signal without the distortions of short-term fluctuations and with minimal lag, adjustable by period.
The Modified Laguerre Lowpass Filter (MLLF) enhances the functionality of US by introducing a Laguerre mode parameter along side the lag parameter to refine control over the amount of additional smoothing/lag applied to the signal. By tethering US with this LERPed lag mechanism, MLLF achieves an effective balance between responsiveness and smoothness, allowing for customizable lag adjustments via multiple inputs. This filter ends with selecting from a choice of weighted averages derived from a gang of up to four cascading LERP calculations, resulting with smoother representations of the data.
The Laguerre Oscillator is a momentum-like indicator derived from the output of US and a singular LERPed lowpass filter. It calculates the difference between the US data and Laguerre filter data, normalizing it by the root mean square (RMS). This quasi-normalization technique helps to assess the intensity of the momentum on any timeframe within an expected bound range centered around 0.0. When the Laguerre Oscillator is positive, it suggests that the smoothed data is trending upward, while a negative value indicates a downward trend. Adjustability is controlled with period, lag, Laguerre mode, and RMS period.

The Visualized Trader (Fractal Timeframe)The **The Visualized Trader (Fractal Timeframe)** indicator for TradingView is a tool designed to help traders identify strong bullish or bearish trends by analyzing multiple technical indicators across two timeframes: the current chart timeframe and a user-selected higher timeframe. It visually displays trend alignment through arrows on the chart and a condition table in the top-right corner, making it easy to see when conditions align for potential trade opportunities.
### Key Features
1. **Multi-Indicator Analysis**: Combines five technical conditions to confirm trend direction:
- **Trend**: Based on the slope of the 50-period Simple Moving Average (SMA). Upward slope indicates bullish, downward indicates bearish.
- **Stochastic (Stoch)**: Uses Stochastic Oscillator (5, 3, 2) to measure momentum. Rising values suggest bullish momentum, falling values suggest bearish.
- **Momentum (Mom)**: Derived from the MACD fast line (5, 20, 30). Rising MACD line indicates bullish momentum, falling indicates bearish.
- **Dad**: Uses the MACD signal line. Rising signal line is bullish, falling is bearish.
- **Price Change (PC)**: Compares the current close to the previous close. Higher close is bullish, lower is bearish.
2. **Dual Timeframe Comparison**:
- Calculates the same five conditions on both the current timeframe and a user-selected higher timeframe (e.g., daily).
- Helps traders see if the trend on the higher timeframe aligns with the current chart, providing context for stronger trade decisions.
3. **Visual Signals**:
- **Arrows on Chart**:
- **Current Timeframe**: Blue upward arrows below bars for bullish alignment, red downward arrows above bars for bearish alignment.
- **Higher Timeframe**: Green upward triangles below bars for bullish alignment, orange downward triangles above bars for bearish alignment.
- Arrows appear only when all five conditions align (all bullish or all bearish), indicating strong trend potential.
4. **Condition Table**:
- Displays a table in the top-right corner with two rows:
- **Top Row**: Current timeframe conditions (Trend, Stoch, Mom, Dad, PC).
- **Bottom Row**: Higher timeframe conditions (labeled with "HTF").
- Each cell is color-coded: green for bullish, red for bearish.
- The table can be toggled on/off via input settings.
5. **User Input**:
- **Show Condition Boxes**: Toggle the table display (default: on).
- **Comparison Timeframe**: Choose the higher timeframe (e.g., "D" for daily, default setting).
### How It Works
- The indicator evaluates the five conditions on both timeframes.
- When all conditions are bullish (or bearish) on a given timeframe, it plots an arrow/triangle to signal a strong trend.
- The condition table provides a quick visual summary, allowing traders to compare the current and higher timeframe trends at a glance.
### Use Case
- **Purpose**: Helps traders confirm strong trend entries by ensuring multiple indicators align across two timeframes.
- **Example**: If you're trading on a 1-hour chart and see blue arrows with all green cells in the current timeframe row, plus green cells in the higher timeframe (e.g., daily) row, it suggests a strong bullish trend supported by both timeframes.
- **Benefit**: Reduces noise by focusing on aligned signals, helping traders avoid weak or conflicting setups.
### Settings
- Access the indicator settings in TradingView to:
- Enable/disable the condition table.
- Select a higher timeframe (e.g., 4H, D, W) for comparison.
### Notes
- Best used in trending markets; may produce fewer signals in choppy conditions.
- Combine with other analysis (e.g., support/resistance) for better decision-making.
- The higher timeframe signals (triangles) provide context, so prioritize trades where both timeframes align.
This indicator simplifies complex trend analysis into clear visual cues, making it ideal for traders seeking confirmation of strong momentum moves.

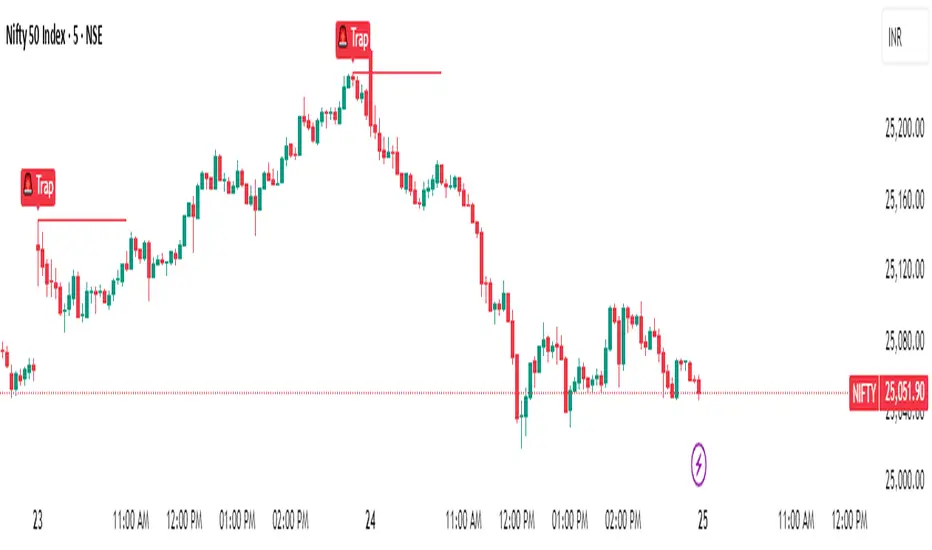
Magnet Zones: Trap Detection & Flow Map [@darshakssc]This script detects potential bull and bear trap candles—price actions that may appear strong but are likely to reverse—based on:
🔺 Wick structure
📊 Volume spike behavior
💡 RSI confirmation logic
⏳ Signal cooldown filter to reduce false positives
The indicator then plots:
🟥 Red “🚨 Trap” labels above candles showing possible bull traps
🟩 Green “🧲 Trap” labels below candles showing possible bear traps
➖ Horizontal zone lines to mark these trap levels as “magnet zones,” which may act as future support or resistance
🧠 How It Works:
1. Volume Spike Detection
2. The script first checks for unusually high volume (1.5× the average volume over the last 20 candles).
3. Trap Candle Structure
4. A trap is suspected when there is a long wick opposite the direction of the candle body, signaling a failed breakout or price manipulation.
5. RSI Confirmation
6. Bull Traps: RSI must be above 60
7. Bear Traps: RSI must be below 40
✅ This helps validate whether the price was overbought or oversold.
✅ Cooldown Mechanism
✅ After a trap is detected, it waits for 10 bars before allowing another signal—this reduces noise and overfitting.
✅ How to Use It:
1. Apply on any timeframe, especially effective for intraday trading (e.g. 5m, 15m, 1h).
2. Use the trap signals as early warnings to avoid fake breakouts.
3. Combine with your own strategy or trend-following system for confirmation.
4. The trap lines (magnet zones) can be used as dynamic support/resistance levels for future pullbacks or reversals.
⚠️ Important Note:
This script is for educational purposes only and is not financial advice.
Always use traps in combination with your personal discretion, risk management, and other confluence tools.
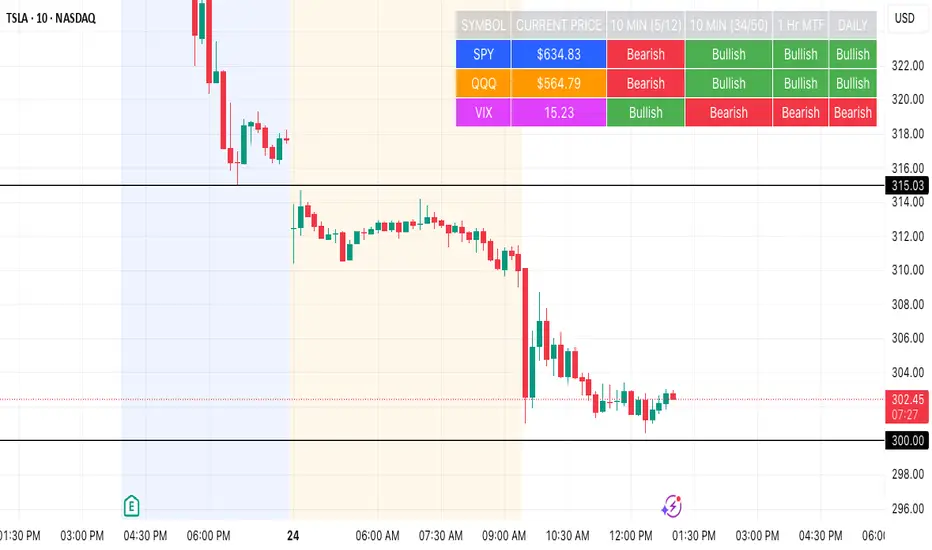
SPY, QQQ, VIX Status TableBased on Ripster EMA and 1 hour MTF Clouds, this custom TradingView indicator displays a visual trend status table for SPY, QQQ, and VIX using multiple timeframes and EMA-based logic to be used on any stock ticker.
🔍 Key Features:
✅ Tracks 3 symbols: SPY, QQQ, and VIX
✅ Multiple trend conditions:
10-min (5/12 EMA) Ripster cloud trend
10-min (34/50 EMA) Ripster cloud trend
1-Hour Multi-Timeframe Ripster EMA trend
Daily open/close trend
✅ Color-coded trend strength:
🟩 Green = Bullish
🟥 Red = Bearish
🟨 Yellow = Sideways
✅ TO save screen space, customizations available:
Show/hide individual rows (SPY, QQQ, VIX)
Show/hide any trend column (10m, 1H MTF, Daily)
Change header/background colors and font color
Bold white top row for readability
✅ Auto-updating table appears on your chart, top-right
This tool is great for active traders looking to quickly scan short-term and longer-term momentum in key market instruments without having to go back and forth market charts.
cd_sweep&cisd_CxOverview:
When the price is at a significant zone/level on a higher time frame (HTF), and it sweeps (breaks through and then closes back below/above) the high or low of the previous HTF candle, it is common to look for a Change in State of Delivery (CISD) on a lower time frame (LTF) to enter a trade.
This model can be summarized as:
HTF Sweep → LTF CISD (Optional: SMT / Divergences)
________________________________________
Working Principle & Details:
1. The indicator monitors price action on the selected HTF and tracks any sweep (violation) of the previous HTF candle's high or low. Simultaneously, it identifies CISD levels on the LTF. If SMT is enabled, it will appear as a label on the chart.
When both HTF sweep and LTF CISD conditions are met, the indicator marks the chart at the open of the next candle and triggers an alert if set.
CISD levels are tracked and updated whenever a new HTF high/low is formed.
2. The indicator monitors the formation of entry models on up to six selected pairs, displaying results in two separate tables:
o HTF Sweep Query Table: Monitors live HTF candles and reports pairs that meet the sweep condition.
o CISD Table: Displays the pairs where a valid entry model has formed. A "🔥" symbol indicates the condition has occurred.
3. Bias Visualization:
Based on the selected HTF, a visual band is shown at the bottom of the chart using the chosen bullish/bearish colors.
Bias is determined by:
o Candle closing above/below the previous one suggesting continuation.
o A failed close after a sweep implying potential reversal.
4. HTF Candles:
Displays HTF candles based on the user-defined time frame.
5. Optional SMT (Smart Money Technique):
Must be enabled in the menu and requires the correlated pair to be entered correctly for accurate results.
Displayed only as a visual confirmation, not a requirement for model formation.
If the currently open symbol sweeps the previous candle while the correlated symbol does not (or vice versa), an "SMT" label appears on the chart.
6. Color & Table Positioning:
Controlled via the settings menu.
________________________________________
Warnings:
• The indicator only marks CISDs that form at HTF high/low zones.
• Entering every time the model forms does not guarantee profitability.
• Waiting for the model to appear at significant HTF levels/zones increases the likelihood of success.
• HTF and LTF selections should follow commonly accepted combinations or user-tested time frames.
• If you want to trigger alerts only for symbols entered in the indicator, ensure the "Use indicator alerts" option is enabled.
• To set alerts for the TradingView watchlist instead, disable the "Use indicator alerts" option.
________________________________________
Feel free to share your thoughts and suggestions.
Happy trading! 💫

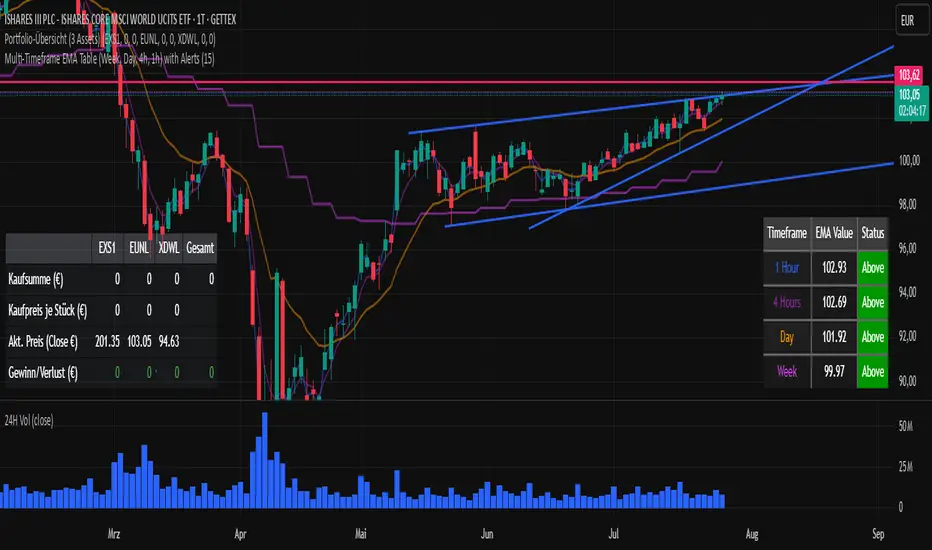
Multi-Timeframe EMA Table (Woche, Tag, 4h, 1h)Title: Multi-Timeframe EMA Table (Weekly, Daily, 4h, 1h)
Description:
This Pine Script indicator provides a concise and clear Multi-Timeframe (MTF) Exponential Moving Average (EMA) analysis directly on your TradingView chart. It displays the EMA values for the 1-hour, 4-hour, 1-day, and 1-week timeframes in a customizable table.
Features:
Clear Table Display: Shows the current EMA values for predefined higher timeframes (1h, 4h, Day, Week).
Dynamic Status: The status column immediately visualizes whether the current price of your chart is above (Green) or below (Red) its respective Multi-Timeframe EMA.
Customizable EMA Length: The length of the EMA can be easily adjusted via the indicator settings, allowing you to tailor it to your preferred analysis.
Visual Confirmation: The corresponding Multi-Timeframe EMA lines are optionally plotted directly on the chart to visually confirm the table values.
Non-Repainting: The displayed EMA values and lines are programmed to be non-repainting, meaning their values do not change on already closed candles.
This indicator is a useful tool for traders who want to quickly get an overview of the EMA's position across different timeframes without constantly switching their chart timeframe. It's ideal for confirming trends and identifying support and resistance levels from a higher perspective.
Cross-Correlation Lead/Lag AnalyzerCross-Correlation Lead/Lag Analyzer (XCorr)
Discover which instrument moves first with advanced cross-correlation analysis.
This indicator analyzes the lead/lag relationship between any two financial instruments using rolling cross-correlation at multiple time offsets. Perfect for pairs trading, market timing, and understanding inter-market relationships.
Key Features:
Universal compatibility - Works with any two symbols (stocks, futures, forex, crypto, commodities)
Multi-timeframe analysis - Automatically adjusts lag periods based on your chart timeframe
Real-time correlation table - Shows current correlation values for all lag scenarios
Visual lead/lag detection - Color-coded plots make it easy to spot which instrument leads
Smart "Best" indicator - Automatically identifies the strongest relationship
How to Use:
Set your symbols in the indicator settings (default: NQ1! vs RTY1!)
Adjust correlation length (default: 20 periods for smooth but responsive analysis)
Watch the colored lines:
• Red/Orange: Symbol 2 leads Symbol 1 by 1-2 periods
• Blue: Instruments move simultaneously
• Green/Purple: Symbol 1 leads Symbol 2 by 1-2 periods
Check the table for exact correlation values and the "Best" relationship
Interpreting Results:
Correlation > 0.7: Strong positive relationship
Correlation 0.3-0.7: Moderate relationship
Correlation < 0.3: Weak/no relationship
Highest line indicates the optimal timing relationship
Popular Use Cases:
Index Futures : NQ vs ES, RTY vs IWM
Sector Rotation : XLF vs XLK, QQQ vs SPY
Commodities : GC vs SI, CL vs NG
Currency Pairs : EURUSD vs GBPUSD
Crypto : BTC vs ETH correlation analysis
Technical Notes:
Cross-correlation measures linear relationships between two time series at different time lags. This implementation uses Pearson correlation with adjustable periods, calculating correlations from -2 to +2 period offsets to detect leading/lagging behavior.
Perfect for quantitative analysts, pairs traders, and anyone studying inter-market relationships.

🟡🔵🟢🔴Beginner's Assistant by carljchapman🟡🔵🟢🔴
Overview
This indicator dynamically marks highs and lows of the premarket (4:00am-9:30amEST) and opening range. It displays Fair Value Gaps, 9 and 21 period Exponential Moving Averages (EMA) and the Volume Weighted Average Price (VWAP). To really help beginners, it marks suggested entry points on the chart with green or red triangles, when a reasonable trend appears.
Features
Automatically draws blue lines for Premarket High and Low values
Dynamically marks the opening Range region
Visual entry signals for long and short opportunities
Primarily used for stocks/funds , but works with forex and crypto
Quick configuration settings to tailor details for your experience level
Mobile friendly mode
Supports alerts
How To Use
Open your chart, and select a 1 or 2 minute timeframe.
Watch for green triangles and red triangles, hinting at entries for long or short positions. Pay particular attention to the price action as it approaches the bounds of the opening range and the premarket levels. I suggest also using a MACD indicator for confirmation of the trend.
For scalping 0dte Options, switch frequently between the 1 ,2 and 5 minute or higher timeframes. Do this so you will not miss an entry opportunity or be unaware of the overall trend.
As a beginner, until you have refined your strategy and develop risk management, take profits as low as 10%. A small profit can quickly become a much larger loss. With 0dte options, time will devour your profits even when the price doesn’t budge.
What makes this indicator so beginner friendly?
Charts with too many lines and colors are are a nightmare for beginners! And empty charts do not tell the whole story. Simple checkboxes in the configuration settings let you turn on and off features to match your comfort level. As you become more familiar you might try turning off the suggested entries to see if you would have selected the same or better ones yourself. Just one example of how you will learn and verify your knowledge. You will quickly spot Opening Range Breakouts and more.
Why are the triangle pointers not simply above or below the bars?
As a beginner, I like to review charts to see how much the price changed, then estimate how much a contract would move based on its delta. A mouthful, I know. But what price does an arrow pointing up below a bar reflect? Would I have entered at the open or close, low or high? This indicator helps by putting the marker close to the price when indicated. It can even display the actual price on the bar. This is helpful for you to make fast calculations without a measuring tool.
I am an experienced trader. Can this help me make winning trades?
Sure. It can also help you make losing ones! Profit is not guaranteed with any indicator or strategy. This indicator is designed to assist you as you learn and while you trade. You won't see the words BUY or SELL. This is not a signal bot! It is merely a tool to assist you. You can learn a lot by spending time observing price movement using this indicator without ever making a single trade.
🟡🔵🟢🔴

Multi-Timeframe SMTSummery
The Multi-Timeframe SMT indicator is designed to identify and visualize Higher Timeframe (HTF) data on a Lower Timeframe (LTF) chart, allowing traders to see the broader market context without changing their current chart's resolution. It accurately draws pivots and SMT divergences from higher timeframes on the corresponding candles of your current lower timeframe chart.
Its core features include:
Multi-Timeframe Analysis: Configure and monitor pivots on up to four independent timeframes, from intraday to monthly.
Customizable Pivot Detection: Define the strength of pivots by adjusting the number of bars to the left and right.
SMT Divergence: Automatically identifies bullish and bearish SMT divergences by comparing the price action of the main chart symbol with a chosen correlated asset.
Early SMT Detection: A unique feature that monitors a lower "detection timeframe" to provide early warnings of potential SMT setups before they're confirmed on the main timeframe. Note that this early detection is only shown on timeframes equal to or lower than the "Detection timeframe" you have set.
Visual Cues & Alerts: Clear on-chart labels, lines, and fully customizable alerts notify you of confirmed pivots and SMT divergences, ensuring you don't miss key opportunities.
Important Nuance Regarding Pivot Label Display
Due to a self-imposed limit within this script's drawing management logic, the indicator might quickly reach its drawing capacity if you enable pivot crosses for multiple timeframes simultaneously. When this internal drawing limit is exceeded, the script is designed to automatically remove the oldest drawings to make space for new ones.
Therefore, to ensure optimal performance and visibility of the most recent and relevant pivots, it's highly recommended to only enable the "Show Pivot Crosses" option for one timeframe at a time. If you wish to view pivots for a different timeframe, simply disable the pivot crosses for the currently active timeframe and then enable them for your desired one. This approach prevents the rapid cycling and disappearance of pivot labels, providing a clearer and more stable visual experience.
In-Depth Explanation of the Logic
This script is built on two primary concepts: pivot points and Smart Money Technique (SMT) divergence. It systematically collects historical data on multiple timeframes, identifies pivots, and then compares them between two assets to find divergences.
Pivot Point Identification
A pivot is a turning point in the market. A pivot high is a candle that has a higher high than the candles to its immediate left and right. Conversely, a pivot low is a candle with a lower low than its neighbors.
How it Works in the Script:
The script tracks the highest high and lowest low for each period of the selected timeframe (e.g., for each 4-hour candle). When a new high-timeframe candle closes, it stores that high/low value and its bar index in an array. The checkForPivot() function then checks if a recently stored high or low qualifies as a pivot.
Key Inputs:
Left Strength (leftBars1): The number of candles to the left that must have a lower high (for a pivot high) or higher low (for a pivot low).
Right Strength (rightBars1): The number of candles to the right that must meet the same criteria.
For example, with Left Strength and Right Strength both set to 3, a pivot high is only confirmed when its high is greater than the highs of the 3 previous high-timeframe candles and the 3 subsequent high-timeframe candles. Increasing these values will identify more significant, longer-term pivots.
Smart Money Technique (SMT) Divergence
SMT Divergence is a concept popularized by The Inner Circle Trader (ICT). It occurs when two closely correlated assets fail to move in sync. For instance, if Asset A makes a higher high but Asset B fails to do so and instead makes a lower high, this creates a bearish SMT divergence. It suggests that the "smart money" may not be supporting the move in Asset A, signaling a potential reversal.
Bearish SMT: Main asset makes a higher high, while the correlated asset makes a lower high. This is a potential sell signal.
Bullish SMT: Main asset makes a lower low, while the correlated asset makes a higher low. This is a potential buy signal.
How it Works in the Script:
Data Request: For each timeframe, the script uses the request.security() function to fetch the high and low data for both the main chart symbol (syminfo.tickerid) and the chosen Comparison Asset.
Pivot Comparison: When a new pivot is confirmed on the main asset, the script checks if a corresponding pivot also formed on the comparison asset at the same time.
Divergence Check: It then compares the direction of the pivots. For a bearish SMT, it checks if the main asset's new pivot high is higher than its previous pivot high, while the comparison asset's new pivot high is lower than its previous one. The logic is reversed for bullish SMT.
Visualization: If a divergence is found, the script draws a red (bearish) or green (bullish) line connecting the two pivots on your chart and places an "SMT" label.
Early SMT Detection
This is a proactive feature designed to give you a heads-up. Waiting for a 4-hour or daily pivot to form can take a long time. The early detection system looks for SMT divergences on a much smaller, user-defined Detection timeframe (e.g., 15-minute).
How it Works in the Script:
Awaiting Setup: After a primary pivot (Pivot A) is formed on the main timeframe (e.g., a Daily pivot high), the script begins monitoring.
Intraday Monitoring: It then watches the Detection timeframe (e.g., 15-minute) for smaller intraday pivots.
Potential Divergence: It looks for an intraday pivot that forms a divergence against the primary Pivot A.
Watchline & Alert: When this "potential" divergence occurs, the script draws a dashed white line and triggers a "Potential SMT" alert. This isn't a confirmed SMT on the main timeframe yet, but it's a powerful early warning that one may be forming.
Drawing & Object Management
To keep the chart clean and prevent performance issues, the script manages its drawings (lines and labels) efficiently. It stores them in arrays and uses a drawing limit to automatically delete the oldest drawings as new ones are created, ensuring your TradingView remains responsive.
How to Use the Indicator
Configuration
Enable Timeframes: Use the checkboxes (Enable Timeframe 1, Enable Timeframe 2, etc.) to activate the timeframes you want to monitor. It's often best to start with one or two to keep the chart clean.
Select Timeframes: Choose the higher timeframes you want to analyze (e.g., 240 for 4-hour, D for Daily, W for Weekly).
Set Pivot Strength: The default of 3 for Left/Right strength is a good starting point. Increase it to find more significant market structure points or decrease it for more frequent, shorter-term pivots.
Configure SMT:
Check Enable SMT for the timeframes where you want to detect divergence.
Enter a Comparison Asset . This is crucial. Ensure the assets are correlated.
To use the early warning system, check Enable early SMT detection and select an appropriate Detection timeframe (e.g., 15 or 60 minutes for a Daily analysis).

Order-Flow Market StructureOrder-Flow Market Structure by The_Forex_Steward
A precision tool for visualizing internal shifts, swing structure, BOS events, Fibonacci levels, and multi-timeframe alerts.
What It Does
The Order-Flow Market Structure indicator intelligently tracks and visualizes price structure using higher timeframe candles. It automatically detects:
• Internal bullish and bearish structure shifts
• Swing highs and lows (HH, HL, LH, LL)
• Break of Structure (BoS) confirmations
• Fibonacci retracement levels from recent swing moves
• Real-time alerts across LTF, MTF, and HTF modes
It’s a complete tool for traders who follow Smart Money Concepts, ICT, or institutional price action strategies.
How It Works
• You select a Higher Timeframe (HTF) to set the structural context
• Internal shifts are identified using HTF candle closes
• The indicator scans for swing highs/lows after each internal shift
• Breaks of previous swing points confirm BoS and plot horizontal lines
• Zigzag lines visually connect structural points (swings and BoS)
• Fibonacci levels are drawn between the latest swings
• Alerts can be configured for structure shifts, BoS events, and fib level breaks
How to Use It
Set your preferred HTF (e.g., 1H while trading on 5-minute)
Enable Fibonacci levels to visualize retracement zones
Watch for:
• Bullish internal shifts → HL to HH
• Bearish internal shifts → LH to LL
• BOS → Breakout confirmation
Enable alerts to catch structural events in real-time
Adjust the "Safe History Offset" if working with long lookbacks or volatile assets
Who It's For
• Traders using Smart Money, ICT, or market structure-based systems
• Scalpers, day traders, and swing traders
• Anyone needing precise structural insight across multiple timeframes
Features
• BoS detection with custom line styles and width
• HH, HL, LH, LL label plotting
• Optional Fibonacci retracement zones
• Custom alerts for swing shifts and fib level breaks
• LTF, MTF, and HTF alert modes
Stay aligned with structure, trade with precision, and get alerted to key shifts in real time.

RSI, CCI, ADX Panel (Custom TF for Each)RSI, CCI, and ADX Combined – Multi-Timeframe, Fully Customizable Panel Indicator for TradingView
Overview
This Pine Script indicator integrates the Relative Strength Index (RSI), Commodity Channel Index (CCI), and Average Directional Index (ADX) into a single, clean panel for effortless technical analysis. Each indicator operates independently, with customizable length, smoothing, and time frame for maximum flexibility. Traders can now monitor momentum, trend strength, and overbought/oversold conditions across different time frames—all in one place.
Key Features
Independent Controls: Set length, smoothing (ADX), and time frame individually for each indicator via the settings panel.
Multi-Timeframe Support: Each oscillator (RSI, CCI, ADX) can be calculated on its own time frame, enabling nuanced inter-timeframe analysis.
Customizable Visualization: Adjust line color and thickness for each indicator to match your chart style.
Clean, Non-Overlay Display: All three indicators are plotted in a dedicated panel beneath the price chart, reducing clutter.
Reference Levels: Includes standard reference lines for oversold/overbought (RSI, CCI) and trend threshold (ADX) for quick visual cues.
Usage Ideas
Swing Trading: Compare short- and long-term momentum using different time frames for RSI, CCI, and ADX.
Trend Confirmation: Use ADX to filter RSI and CCI signals—only trade overbought/oversold conditions during strong trends.
Divergence Hunting: Spot divergences between time frames for early reversal signals.
Scalping: Set RSI and CCI to lower time frames for entry, while monitoring higher timeframe ADX for trend context.
How to Install
Paste the script into the Pine Editor on TradingView.
Add to chart. Adjust settings as desired.
Save as a template for quick reuse on any chart—all your custom settings will be preserved.
Customization
Edit lengths and time frames in the indicator’s settings dialog.
Toggle reference lines on/off as needed.
Fine-tune line appearance (color, thickness) for clarity.
Note:
This indicator does not provide automated buy/sell signals. It is a customizable analytical tool for manual or semi-automated trading. Use in combination with other technical or fundamental analysis for best results.
Combine Momentum, Trend, and Volatility—Seamlessly and Visually—With One Indicator.

Advanced Correlation Monitor📊 Advanced Correlation Monitor - Pine Script v6
🎯 What does this indicator do?
Monitors real-time correlations between 13 different asset pairs and alerts you when historically strong correlations break, indicating potential trading opportunities or changes in market dynamics.
🚀 Key Features
✨ Multi-Market Monitoring
7 Forex Pairs (GBPUSD/DXY, EURUSD/GBPUSD, etc.)
6 Index/Stock Pairs (SPY/S&P500, DAX/NASDAQ, TSLA/NVDA, etc.)
Fully configurable - change any pair from inputs
📈 Dual Correlation Analysis
Long Period (90 bars): Identifies historically strong correlations
Short Period (6 bars): Detects recent breakdowns
Pearson Correlation using Pine Script v6 native functions
🎨 Intuitive Visualization
Real-time table with 6 information columns
Color coding: Green (correlated), Red (broken), Gray (normal)
Visual states: 🟢 OK, 🔴 BROKEN, ⚫ NORMAL
🚨 Smart Alert System
Only alerts previously correlated pairs (>80% historical)
Detects breakdowns when short correlation <80%
Consolidated alert with all affected pairs
🛠️ Flexible Configuration
Adjustable Parameters:
📅 Periods: Long (30-500), Short (2-50)
🎯 Threshold: 50%-99% (default 80%)
🎨 Table: Configurable position and size
📊 Symbols: All pairs are configurable
Default Pairs:
FOREX: INDICES/STOCKS:
- GBPUSD vs DXY • SPY vs S&P500
- EURUSD vs GBPUSD • DAX vs S&P500
- EURUSD vs DXY • DAX vs NASDAQ
- USDCHF vs DXY • TSLA vs NVDA
- GBPUSD vs USDCHF • MSFT vs NVDA
- EURUSD vs USDCHF • AAPL vs NVDA
- EURUSD vs EURCAD
💡 Practical Use Cases
🔄 Pairs Trading
Detects when strong correlations break for:
Statistical arbitrage
Mean reversion trading
Divergence opportunities
🛡️ Risk Management
Identifies when "safe" assets start moving independently:
Portfolio diversification
Smart hedging
Regime change detection
📊 Market Analysis
Understand underlying market structure:
Forex/DXY correlations
Tech sector rotation
Regional market disconnection
🎓 Results Interpretation
Reading Example:
EURUSD vs DXY: -98.57% → -98.27% | 🟢 OK
└─ Perfect negative correlation maintained (EUR rises when DXY falls)
TSLA vs NVDA: 78.12% → 0% | ⚫ NORMAL
└─ Lost tech correlation (divergence opportunity)
Trading Signals:
🟢 → 🔴: Broken correlation = Possible opportunity
Large difference: Indicates correlation tension
Multiple breaks: Market regime change

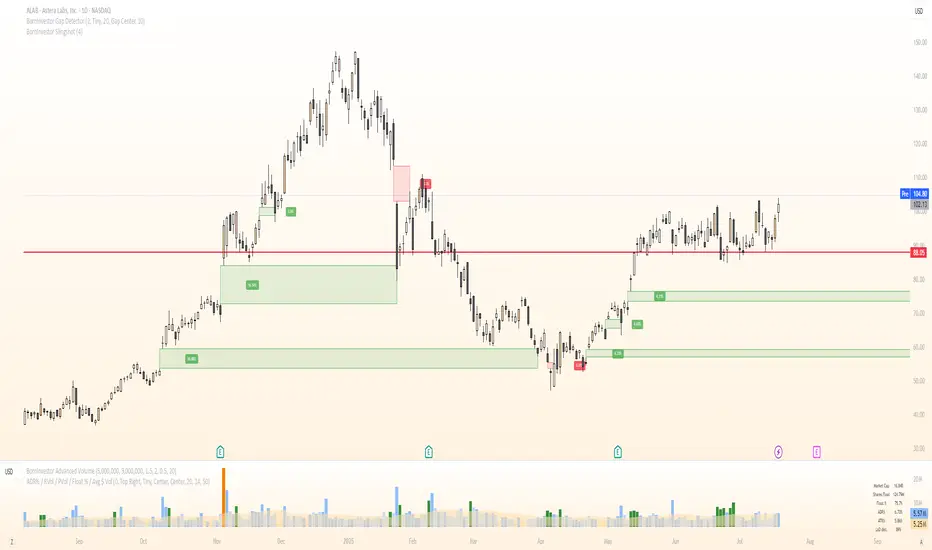
BornInvestor Gap Detector📈 BornInvestor Gap Detector
The BornInvestor Gap Detector is a powerful visual tool for identifying and analyzing price gaps on any chart. It automatically detects up and down gaps, highlights them with customizable boxes, and offers detailed labeling and alerting functionality.
🔍 Key Features:
Automatic Detection of bullish and bearish gaps based on customizable deviation settings.
Visual Highlighting of gaps using colored boxes with optional trail length limitation.
Gap Size Labels showing the percentage size of the gap, with the ability to display them only on the most recent N gaps.
Alerts for:
New gap appearance
Gap fully or partially closed
Price entering a gap zone (ideal for breakout/backfill strategies)
Customizable Colors for up/down gap borders and backgrounds.
Optional Message when no gaps are found on the current chart.
💡 Usefulness:
Gaps are an edge. They frequently act as support or resistance—especially on the first retest—when aligned with high-volume areas or other key price zones. Many strong stock moves begin with gaps, a concept central to strategies like Episodic Pivots.
This indicator helps you:
Identify gaps as potential entry zones on secondary setups
Quantify gaps via percentage size
Filter gaps based on size to suit your specific trading approach
Set alerts when price enters a gap or meets your custom criteria
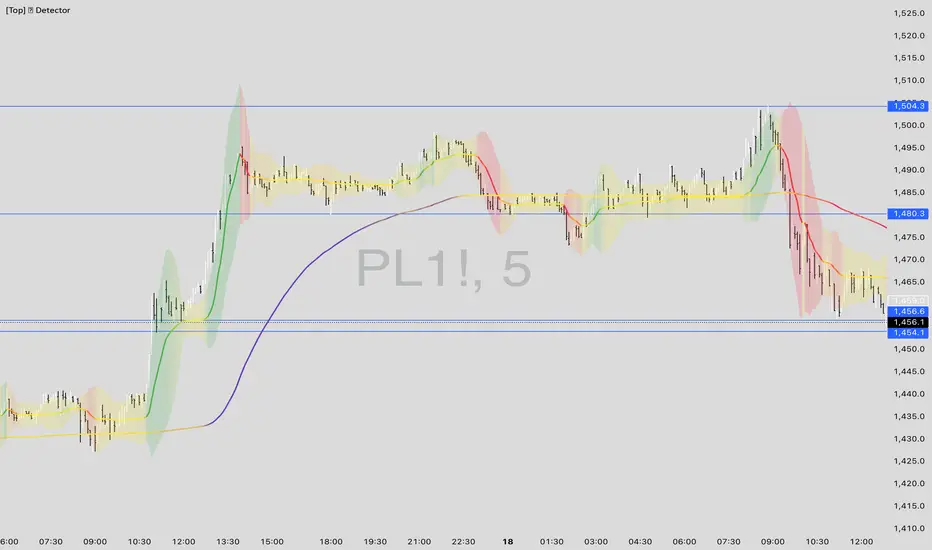
[Top] LHAMA Consolidation DetectorIntroducing the Low-High Adaptive Moving Average (LHAMA 🦙), a powerful tool designed to help traders visually distinguish between trending and consolidating market phases. Unlike traditional moving averages that can produce false signals in choppy markets, the LHAMA is engineered to flatten out during periods of consolidation and become more responsive when a clear trend emerges.
This indicator's primary function is to act as a "Consolidation Detector." When the LHAMA line goes flat and adopts its "Flat Color," it serves as a clear visual cue that the market is range-bound. Conversely, when the line begins to slope and changes to its Bullish or Bearish color, it signals a potential breakout or the start of a new trend.
How It Works
The LHAMA is a type of adaptive moving average. Its adaptiveness is derived from a unique calculation that measures market "trendiness." It does this by tracking whether new highs or new lows are being made within a specified lookback period.
In a Trending Market: When the price consistently makes new highs or lows, the indicator's responsiveness increases, causing the LHAMA to track the price much more closely and responsively.
In a Consolidating Market: When the price is range-bound and fails to make new highs or lows, the responsiveness decreases significantly. This causes the LHAMA to flatten out and become less sensitive to minor price fluctuations, effectively filtering out market noise.
Key Features
Adaptive Calculation: The core engine of the indicator, which automatically adjusts its smoothing based on trend strength.
Slope-Based Coloring: The line's color dynamically changes based on its slope, providing an at-a-glance view of market conditions: bullish, bearish, or flat.
Multi-Line & Multi-Timeframe (MTF): You can enable up to six fully customizable LHAMA lines. Each line can be configured with its own length, colors, and can even be set to a different timeframe, allowing for comprehensive multi-timeframe analysis on a single chart.
Volatility Clouds: Each LHAMA can display an optional cloud around it. The cloud's width is based on your choice of either the Average True Range (ATR) or Standard Deviation (StdDev), offering a visual representation of volatility.
Volume Weighting: An option to incorporate volume into the adaptive calculation, making the LHAMA even more responsive during high-volume price movements.
How to Use
Identify Consolidation: The primary use case. A flat and consistently colored LHAMA line is a strong indication of a sideways or consolidating market. This can help traders avoid taking trend-following trades in choppy conditions.
Confirm Trends: When the LHAMA begins to slope upwards or downwards and changes to its trend color, it can be used to confirm the direction and strength of a new trend. The steeper the slope, the stronger the momentum, and more solid the directional color.
Dynamic Support & Resistance: Like other moving averages, the LHAMA can act as a dynamic level of support in an uptrend or resistance in a downtrend. The optional cloud can further define these zones.
Multi-MA Ribbon Strategy: By enabling multiple LHAMAs with different lengths (e.g., Fibonacci sequence like 14, 21, 34, 55), you can create a ribbon. The expansion of the ribbon indicates a strong trend, while its contraction signals a weakening trend or consolidation.
Settings Explained
Enable 🦙 Line: A simple checkbox to turn each of the six LHAMA lines on or off.
Length: The lookback period for the LHAMA calculation. Shorter lengths are more responsive, while longer lengths are smoother.
Timeframe: Set a specific timeframe for each LHAMA. Leave blank to use the chart's current timeframe.
Volume Weight: If checked, adds volume weighting to make the LHAMA more responsive to high-volume moves.
Colors (Bullish, Bearish, Flat): Customize the colors for each market state. To only see the line during consolidation, set the Bullish and Bearish colors to 100% transparency. To hide the line during consolidation, set the Flat color to 100% transparency.
Color Sensitivity: This is a crucial setting. Because price scales (tick sizes) vary widely between symbols, this setting allows you to adjust the sensitivity of the slope detection. A lower value requires a steeper slope to trigger a trend color, while a higher value is more sensitive.
Recommended settings are provided in the input tooltip as a starting point:
$5 Tick: 0.25 Sensitivity
$1 Tick: 0.75 Sensitivity
$0.25 Tick: 3 Sensitivity
$0.01 Tick: 50 Sensitivity
$0.005 Tick: 100 Sensitivity
Cloud Settings:
Show Cloud: Toggles the visibility of the volatility cloud around the LHAMA.
Width Based On: Choose between "ATR" or "StdDev" to calculate the cloud's width.
Cloud Length & Width: Set the lookback period and multiplier for the ATR/StdDev calculation to control the size of the cloud.
Candle Ghosts: MTF 3 Candle Viewer by Chaitu50cCandle Ghosts: MTF 3 Candle Viewer helps you see candles from other timeframes directly on your chart. It shows the last 3 candles from a selected timeframe as semi-transparent boxes, so you can compare different timeframes without switching charts.
You can choose to view candles from 30-minute, 1-hour, 4-hour, daily, or weekly timeframes. The candles are drawn with their full open, high, low, and close values, including the wicks, so you get a clear view of their actual shape and size.
The indicator lets you adjust the position of the candles using horizontal and vertical offset settings. You can also control the spacing between the candles for better visibility.
An optional EMA (Exponential Moving Average) from the selected timeframe is also included to help you understand the overall trend direction.
This tool is useful for:
Intraday traders who want to see higher timeframe candles for better decisions
Swing traders checking lower timeframe setups
Anyone doing top-down analysis using multiple timeframes on a single chart
This is a simple and visual way to study how candles from different timeframes behave together in one place.

