MRhythm - Fib/Elliott/Candle/Flow Day Strategy (Aiden Ryu)creates buy signals with TP's on all asset classes. tested for es1 and XAU. ENJOY!!!
Multitimeframe

SFP + TP/SL + WT JSON BOT (Touch/Return)Smart Reversal Engine with Automated TP/SL & WunderTrading Integration
This invite-only indicator is designed for traders seeking highly responsive reversal detection and fully automated execution.
It combines multiple market conditions into a single confirmation system that identifies high-probability turning points with minimal delay.
The tool provides:
🔷 Key Features
✔ Real-time reversal detection
Signals are generated the moment specific market conditions align—no need to wait for candle closures.
This allows extremely early entries with minimal lag.
✔ Auto-calculated TP/SL levels
Profit-taking and protection levels are dynamically generated based on market structure.
Visual TP/SL lines appear directly on the chart for clarity.
✔ Backtesting suite
Last N trades statistics
Monthly performance summary (last 4 months)
Estimated PnL based on user-defined capital & leverage
On-chart TP/SL markers
Everything updates automatically as new signals appear.
✔ Fully automated execution through WunderTrading
When enabled, the indicator automatically sends structured JSON alerts compatible with WT bots:
Enter Long
Enter Short
Exit All
Including:
Market orders
Position size based on your capital settings
Exchange-level TP/SL placement
This allows the chart signals to translate directly into live trading actions.
🔷 Customization
Users can freely adjust:
Entry behavior mode
TP/SL model
Capital allocation
Leverage settings
Backtest window
Without exposing or modifying the underlying logic.
🔷 Notes
This script does not repaint after confirmation.
Real-time signals may update during candle formation (normal for intrabar processing).
Strategy logic is proprietary and not disclosed.
Access is invite-only.
If you would like access, contact me directly through TradingView messages.
Setup guide and WT integration instructions are provided for all subscribers.
智能反转引擎(Smart Reversal Engine)+ 自动 TP/SL + WunderTrading 全自动交易接口
这是一个 邀请制(Invite-Only) 指标,专为追求高响应性反转信号、自动化交易执行的用户打造。
它将多重市场条件整合成统一的判定系统,在极短延迟下识别潜在的高概率转折点。
不会披露策略逻辑、指标原理或内部结构。
🔷 主要功能
✔ 实时反转信号(无需等待收线)
当关键市场条件同时满足时,系统会即时给出提醒。
适用于希望提前布局、减少延迟的交易者。
✔ 自动计算 TP / SL
止盈/止损根据市场位置自动生成,图表上清晰显示,仅需跟随即可。
无需手动测量价格距离。
✔ 完整回测统计系统
最近 N 笔交易统计
最近 4 个月月度表现
根据本金与杠杆估算的 PnL
每一笔 TP / SL 自动打标
所有统计数据均实时更新。
✔ 完整支持 WunderTrading 全自动下单
启用后可自动发送结构化 JSON 信号,包括:
开多
开空
全部平仓
并自动附带:
市价单
依照用户设置的手数 / 杠杆
交易所级别 TP / SL 挂单
实现从图表信号 → 自动交易执行的全流程自动化。
🔷 自定义设置
你可以自由调整:
入场模式
TP/SL 比例
本金
杠杆
回测窗口长度
无需触碰或理解核心逻辑。
🔷 注意事项
指标在信号确认后不会重绘
实时信号在未收线时可能动态变化(属正常现象)
核心算法为私有内容,不会公开
采用 Invite-Only 授权方式

RSI SFP + flexi TP/SL + WT JSON bot RSI SFP + Smart TP/SL + Auto-Trading JSON for WunderTrading
Precision reversal detection for fully automated long/short execution
RSI SFP is a next-generation reversal detection engine combining market structure (Swing Failure Pattern) with RSI divergence confirmation.
It is designed for professional users who require fast, non-repainting, and broker-integrated signals that can be used for automation.
This Invite-Only script offers:
🔷 Core Features
✔ Real-time SFP detection (no candle close required)
The algorithm triggers as soon as price touches previous swing high/low and RSI forms a confirmed divergence.
Ideal for users who want the earliest, most reactive entries.
✔ RSI Divergence Engine
Bullish RSI divergence at prior lows
Bearish RSI divergence at prior highs
Adjustable divergence threshold (RSI difference)
Ultra-low latency decision logic
✔ Smart TP/SL Automation
TP = ±1% fixed profit from entry (configurable)
SL based on swing structure or user-defined %
TP/SL displayed visually on the chart
No repainting once triggered
✔ Full Backtesting Module
Tracks wins/losses across last N trades
Displays monthly statistics (last 4 months)
Tracks estimated P&L using user leverage model
Built-in visual tags for every TP / SL hit
✔ Integrated Auto-Trading for WunderTrading
When enabled, the indicator automatically sends structured JSON signals through TradingView alerts.
Supported actions:
Enter Long
Enter Short
Exit All
Each entry includes:
Market order
Position size based on capital & leverage
Exchange-level TP & SL placement
Your bot on WunderTrading can mirror the exact chart signals in real time.
🔷 Use Cases
Full automation using TradingView → Webhook → WunderTrading
Intraday reversal trading
Swing trading
Multi-exchange automated bot execution
Reversal scalping with tight stops
🔷 Important Notes
This indicator does not repaint after signal confirmation.
Real-time signals may flash while the candle is forming (normal for non-close divergence detection).
Only Invite-Only users can access the script.
No source code is shared.
If you want access, please message me directly on TradingView.
A full setup guide, alerts template, and WT bot configuration are included for subscribers.
🇨🇳 中文版(专业销售版)
RSI SFP + 智能 TP/SL + WunderTrading 自动交易 JSON 引擎
专为自动化反转交易打造的实时 SFP + RSI 背离策略
RSI SFP 指标将 Swing Failure Pattern(SFP 假突破结构)与 RSI 背离进行整合,
用于捕捉极早期的反转机会。
本脚本专为需要 实时、无重绘、可自动化执行 的专业交易者设计。
这是一个 Invite-Only(仅邀请)脚本,专供订阅用户授权使用。
🔷 核心功能
✔ 实时信号(不需要 K 线收盘)
只要价格触及前高/前低 + RSI 背离确认,
立即给出 Long / Short 反转信号,属于极短延迟结构逻辑。
✔ 高级 RSI 背离系统
价格 vs RSI 顶背离
价格 vs RSI 底背离
最小 RSI 差值可调
精准且稳定,不重绘
✔ 智能 TP / SL 自动管理
固定 TP = ±1%(可调)
SL 支持 swing 结构或固定百分比
图表上自动绘制 TP/SL 虚线
信号一旦触发后不重绘
✔ 强大回测统计系统
可追踪最近 N 笔交易
最近 4 个月的月度统计
盈亏汇总表(含杠杆模型)
每次 TP/SL 都自动标注在图表上
✔ 内置 WunderTrading 自动化 JSON
启用后,指标会自动通过 TradingView Alerts → Webhook
向 WT 机器人发送标准化 JSON:
开多(Enter Long)
开空(Enter Short)
全部平仓(Exit All)
并自动包含:
市价下单
杠杆
手数
TP/SL 自动挂单
完全同步图表上的信号。
🔷 适用人群
想要全自动交易(TV → WT → 交易所)
反转交易 / SFP 策略
日内 / 轻量级高频反转
Swing 反转捕捉
需要稳定 TP/SL 的量化用户
🔷 注意事项
信号不会在收盘后重绘,但在 K 线形成中可能闪烁(实时逻辑正常现象)
脚本为 Invite-Only 私密指标,源码不会公开
订阅用户可随时获得使用授权
提供详细 WT 机器人设置教程
如需访问权限,请通过 TradingView 私信联系我。
订阅用户将获得完整的使用指南与设置模板。


Estrategia TEMA Pro [Límite Ops por Ventana]good money
jucale
keep faith
dont stop working
eat vegatables


TheStrat: Timeframe Continuity Failed 2This indicator highlights TheStrat Failed 2 reversals only when the market is in Full Time Frame Continuity (FTFC) based on your chosen timeframes.
It is designed for high-probability directional trades with strong trend confirmation.
⸻
What It Detects
Failed 2 (Reversal Setup)
A Failed 2 occurs when price breaks one side of the previous candle, then fails and closes in the opposite direction:
• Failed 2D → Bullish reversal
• Failed 2U → Bearish reversal
This produces trapped breakout traders, often leading to explosive continuation.
FTFC measures whether price is above or below the opening price of higher timeframes.
If selected timeframes are all aligned, trend conviction is strong.
You can toggle ON/OFF each timeframe to define FTFC:
• 1H
• 1D
• 1W
• 1M
• 1Q
• 1Y
Only the timeframes you select must agree.
⸻
Modes for Different Styles
This indicator supports different trading horizons.
Swing Mode (Recommended for Options 1–5 Days Out)
Focus: Fast multi-day trend continuation
Ideal holding: 1–5 days
Best for: Weekly option expirations
Enable:
• 1H → Entry trigger timeframe
• 1D → Short-term direction
• 1W → Swing trend
• 1M → Macro push behind the move
• Q / Y not required
You end up catching the 1H reversal ignition, with Daily/Weekly/Monthly backing it.
Great for:
• Tuesday–Thursday continuation plays
• Multi-day directional runs
• “Ride the weekly magnitude”
Macro Mode (Long-Term Trend Filter)
Focus: Broad market bias
Ideal holding: weeks to months
Best for: Equity swing traders, leaps, ETF positioning
Enable:
• 1W
• 1M
• 1Q
• 1Y
• 1H / 1D not required
Used to ensure you’re riding institutional trend, not counter-trend noise.
Can be paired with a lower-TF entry tool like this indicator running in Swing Mode.
Label Up “F2D FTFC↑!” —— Bullish Failed-2 triggers FTFC → long setup
Label Down “F2U FTFC↓!” —— Bearish Failed-2 triggers FTFC → short setup
Small Circles —— Failed-2 continuation while FTFC remains intact
Optional Intrabar Alerts when price begins to form a Failed-2.
All plotted entries are close-confirmed unless you enable intrabar alerts.

Daily Open Range - TatoshiDisplays a daily open range for both current and previous days. Gives users the flexibility to adjust the number of minutes that the daily open range is determined by. I personally use the first 30 minutes, but adjust at your discretion.
Another GOAT of a indicator. I don't use as much as my monthly open inidcator but for trading lower time frames, this allows the user to easily set their bias for the day and extremely simple to build a strategy around.

Weekly Open Range - TatoshiDisplays a weekly open range for both current and previous weeks. Gives users the flexibility to adjust the number of hours that the weekly open range is determined by. I personally use the first 3 hours, but play around with it.
A GOAT of a indicator, allows the user to easily set their bias for the week and extremely simple to build a strategy around.

Monthly Open Range - TatoshiDisplays a monthly open range for both current and previous months. Gives users the flexibility to adjust the number of hours that the monthly open range is determined by. I personally use the first 10 hours, but play around with it.
A GOAT of a indicator, allows the user to easily set their bias for the month and extremely simple to build a strategy around.

SenxseAiSenxseiAI is a fully modular, multi-framework trading system designed for precision, clarity, and ease of use.
This tool blends market structure, dynamic S/R mapping, trend-logic, and session-based liquidity levels into a unified visual workflow. It highlights real-time entry signals with clean rays and labeled flags, while optional session, daily, and weekly highs/lows anchor traders to key liquidity points. A comprehensive theme engine—with multiple color packs and custom overrides—allows the interface to adapt to any chart style or user preference.
The UI is intentionally minimal, using toggle-based controls instead of overwhelming parameter lists, making the script beginner-friendly while maintaining professional depth.

DANCE WITH WOLVES VN ALL TO 1DANCE WITH WOLVES VN is a smart-money volume indicator designed for stocks and crypto.
Main features:
• logic to detect Distribution, No Demand, Absorption and Exhaustion.
• Automatically builds smart Support/Resistance zones from high-volume price leaders.
• Regression trend channel to see the short-term trend and trading range.
• Dashboard table that shows the top high/low price bars with buy/sell volume and group labels.
• Alert conditions for Breakout above resistance and At Support Area so you don’t need to watch the chart all the time.
You can use it on any symbol and timeframe. Just add the script to your chart and follow the zones (red = resistance, green = support) together with the P/L labels and the status line.
Smart Money Volume + Support/Resistance + Trend Channel.
Tự động vẽ vùng hỗ trợ/kháng cự theo volume mạnh/yếu, label (Distribution, No Demand, Absorption, Exhaustion) và kênh xu hướng.
Cách dùng:
Uptrend: ưu tiên mua ở gần cạnh dưới kênh hoặc vùng hỗ trợ.
Downtrend: ưu tiên bán/short ở gần cạnh trên kênh hoặc vùng kháng cự.
Sideway: đánh range – mua gần support, bán gần resistance, cẩn thận false break.
P… = vùng giá cao → nhìn kiếm setup chốt lời / short / tránh FOMO.
L… = vùng giá thấp → nhìn kiếm setup bắt nhịp hồi / entry buy an toàn hơn.

DTR SL-TPDTR SL-TP is a simple risk-management indicator designed to automatically plot stop-loss and take-profit levels based on the current market price. It helps traders visualize their risk-to-reward setup directly on the chart, making trade planning faster and more consistent.
The indicator uses two main inputs: a Stop Loss Percentage and a Take Profit Multiplier. The stop loss is calculated by reducing the current price by the chosen percentage. The take profit level is set by multiplying that same percentage by the Take Profit Multiplier and adding it to the current price. This creates a dynamic stop-loss and take-profit pair that updates with every candle.
The stop-loss line is plotted in red, and the take-profit line is plotted in green for immediate visual clarity. Traders can adjust the percentage and multiplier to match their personal risk tolerance or strategy requirements.
DTR SL-TP is useful for any style of trading that requires predefined exit levels, including scalping, day trading, and swing trading. It helps maintain discipline, enforce consistent risk management, and quickly evaluate whether a potential trade offers an acceptable reward-to-risk ratio.

DANCE WITH WOLVES VN ALL TO 1DANCE WITH WOLVES VN is a smart-money volume indicator designed for stocks and crypto.
Main features:
• logic to detect Distribution, No Demand, Absorption and Exhaustion.
• Automatically builds smart Support/Resistance zones from high-volume price leaders.
• Regression trend channel to see the short-term trend and trading range.
• Dashboard table that shows the top high/low price bars with buy/sell volume and group labels.
• Alert conditions for Breakout above resistance and At Support Area so you don’t need to watch the chart all the time.
You can use it on any symbol and timeframe. Just add the script to your chart and follow the zones (red = resistance, green = support) together with the P/L labels and the status line.
Vietnamese note: Indicator dùng volume + để vẽ vùng hỗ trợ/kháng cự thông minh, label phân phối / hấp thụ / cạn lực bán và kênh xu hướng. Dùng được cho cả stock và crypto. tot nhat dung khung 5 den 15 phut

Byrd Combo Indicator v2.5Simplify your trading with the Byrd Combo Indicator — a professional, all-in-one trading tool designed to identify high-probability bullish and bearish patterns across multiple timeframes. Whether you’re a position trader, swing trader, or intraday trader, this indicator automatically analyzes trend strength, momentum, and volume to deliver clear, actionable signals — no complex calculations required.
Key Features:
Detects strong bullish and bearish candlestick patterns automatically.
Works on multiple timeframes: from intraday charts to weekly charts.
Includes dynamic signal labeling and optional signal bars for easy visualization.
Filters out weak setups using advanced trend and volume analysis (fully automated).
Customizable settings for personal trading preferences.
The Byrd Combo Indicator v2.5 is perfect for traders who want a simple, actionable, and reliable tool to guide entries, exits, and overall trade management.

High/Low Sweep Dashboard Heatmap/Table (Final v4)The High/Low Sweep Dashboard v6 is a versatile TradingView indicator that analyzes the past N candles to track how many times the high, low, both, or neither levels were taken out. It provides a clear visual summary through either a table or heatmap, with percentages for each category.
Key Features:
- Toggle between Table or Heatmap display.
- User-selectable dashboard position: Upper Right or Lower Right.
- Track sweep data over a custom number of candles.
- Optional markers on the chart for when both or none of the levels are taken.
- Clear percentage breakdowns for each sweep type.
This indicator is ideal for traders who want a quick overview of high/low sweeps and candle behavior over a defined historical window.

Local Watchlist Gauge v6The Local Watchlist Gauge displays a compact monitoring table for a user-defined list of symbols, showing their current trend status and performance relative to their 52-week high.
The indicator presents a table that simultaneously tracks multiple symbols and displays:
• Trend direction for each symbol, determined by whether the closing price is above or below a user-defined moving average
• Percentage distance from the 52-week high, providing a clear measure of recent performance relative to the yearly peak
Each symbol is displayed with:
Trend indicator showing whether the symbol is in an uptrend (above moving average) or downtrend (below moving average)
Distance from 52-week high expressed as a percentage, with color coding to indicate proximity to recent highs
Green indicates symbols trading within 5% of their 52-week high, orange indicates symbols between 5% and 20% below their 52-week high, and red indicates symbols trading more than 20% below their 52-week high.
The table provides an at-a-glance summary of the trend status and relative performance of all symbols in the specified watchlist, allowing users to quickly identify which instruments are maintaining trend strength near their recent highs and which have experienced significant pullbacks from their yearly peaks.

XAU Power Meter + HTF FVG SystemWhat is this?
XAU Power Meter + HTF FVG System is an execution-support tool for XAUUSD that combines:
Local trend & momentum on your entry timeframe (e.g. 5m)
Volatility regime (ATR)
Higher-timeframe FVG bias (e.g. 1H)
The goal is simple: filter out low-quality trades and size up only when the market actually moves.
Core Components
1. LTF Trend (MA Stack 20 / 50 / 200)
The indicator builds a “stacked trend” using three MAs:
Bullish trend → price > MA20 > MA50 > MA200
Bearish trend → price < MA20 < MA50 < MA200
Anything else → RANGE
This gives a clean directional bias for intraday execution.
2. CCI Impulse (“Power”)
The CCI block measures the strength of the current move via |CCI| and classifies it into 4 bands:
LOW – weak momentum, usually not worth it
MEDIUM – acceptable impulse
HIGH – strong impulse
EXTREME – very strong, potential blow-off / late entry zone
These bands are used both for signal quality (Grade) and for position size guidance.
3. ATR Volatility Regime
ATR(14) is compared against its own SMA(100) to classify volatility:
QUIET – ATR < K * ATR_slow
NORMAL
ACTIVE – ATR > K * ATR_slow
You don’t want to size up in a dead market. ATR regime is used inside the Grade calculation.
4. Grade System (A / B / C / X)
The indicator compresses Trend + CCI + ATR into a single Grade:
A – In trend, strong impulse (HIGH/EXTREME), active volatility → top setups
B – In trend, at least MEDIUM impulse, acceptable volatility → good setups
C – In trend, but weaker conditions → borderline, be selective
X – Out of trend or no momentum → avoid
Internally, execution signals require Grade ≥ B for two bars in a row, to avoid one-bar “fake” spikes.
5. HTF FVG Bias (e.g. 1H)
On a higher timeframe (default: 1H), the script runs a Fair Value Gap engine with:
EMA 50/200 trend filter
ATR-based body filter (minimum candle strength)
Wilder ADX filter (trend strength)
Deep retest requirement inside the FVG zone
Optional zone auto-expiry and delete-on-use
It returns:
BUY (bullish HTF FVG confirmed)
SELL (bearish HTF FVG confirmed)
NONE (no valid zone active)
You can control how strict this bias is used via a “Strict: require active HTF FVG for entry” checkbox:
Strict OFF (default) → HTF bias can block trades against a strong HTF signal, but allows trades when HTF is neutral.
Strict ON → LTF entries are allowed only when HTF has an active FVG in the same direction (very selective).
HTF events are shown on the chart as HTF BUY / HTF SELL markers.
Execution Signals (LTF LONG / SHORT)
On your entry timeframe (e.g. 5m), the script generates LONG / SHORT arrows when:
Trend is clearly bullish or bearish (MA stack aligned),
Grade ≥ B for two consecutive bars,
HTF bias conditions are satisfied (depending on the strict mode).
These arrows are not a full auto-strategy, but a high-quality execution cue:
“Trend OK + Momentum OK + Volatility OK + HTF not against you.”
Dashboard
A compact dashboard in the corner shows, in real time:
Trend – UP / DOWN / RANGE (20/50/200 stack)
Impulse (CCI) – LOW / MEDIUM / HIGH / EXTREME
Volatility (ATR) – QUIET / NORMAL / ACTIVE
Size Multiplier – suggested risk sizing factor based on impulse
Grade – A / B / C / X
HTF FVG – BUY / SELL / NONE
This lets you sanity-check the context before pressing the button, not after the loss.
Recommended Use
Instrument: XAUUSD
Timeframe: 5m (scalping / intraday), but can be tested on 15m/1H as well
HTF: 1H by default (can experiment with 4H)
Focus on:
Grade A/B only
Strict mode ON for more institutional, fewer but higher-quality trades
Size up only when both impulse and volatility are supportive
Disclaimer
This script is a decision-support tool, not financial advice and not a guarantee of profit.
Always forward-test, understand the logic, and use your own risk management.

Adaptive Support and Resistance LevelsAdaptive Support and Resistance Levels
This indicator is a comprehensive institutional-grade trading tool designed to visualize Auction Market Theory (AMT), Support and Resistance concepts directly on the price chart. It is built for traders who require a deep understanding of market structure without the visual clutter of standard retail indicators.
Key Features:
1] Fractal Adaptive Engine:
The indicator automatically adjusts its calculations based on your timeframe.
-Intraday (1m-15m): Displays Daily Levels.
-Swing/Positional (30m-1H): Displays Weekly Levels.
-Long Term (Daily+): Displays Monthly Levels.
2]Untested Levels:
-Identifies levels from previous sessions that have not been tested by price.
-Extends these levels forward as "Magnets" until price touches them.
-Touch-Delete Logic: Once price interacts with a magnet, the line is automatically removed to keep the chart clean.
3] Institutional Dashboard:
- A "Flight Deck" table in the top-right corner provides real-time metrics:
-Context: Are we inside, above, or below the previous value zone?
-Auction State: Is the current market balanced or imbalanced?
-IB Status: Initial Balance (first 60 mins) breakout/breakdown status.
-Fuel Gauge: Measures current range vs. ADR (Average Daily Range) to gauge exhaustion.
-Volume Flow: Detects high-aggression volume relative to the average.
How to Use:
Trend Following: Look for price breaking out of the (Static Lines) , Pullback rejection, Rejection from the lines.
Reversion: Use the lower lines for bulls reversal and Upper lines for bears reversal ( Kind of reversal candle formation )
Risk Management: Use the ADR Fuel Gauge to avoid buying extended markets (>100% ADR).
Disclaimer: This tool is only for educational and analytical purposes only. Not any recommendation.

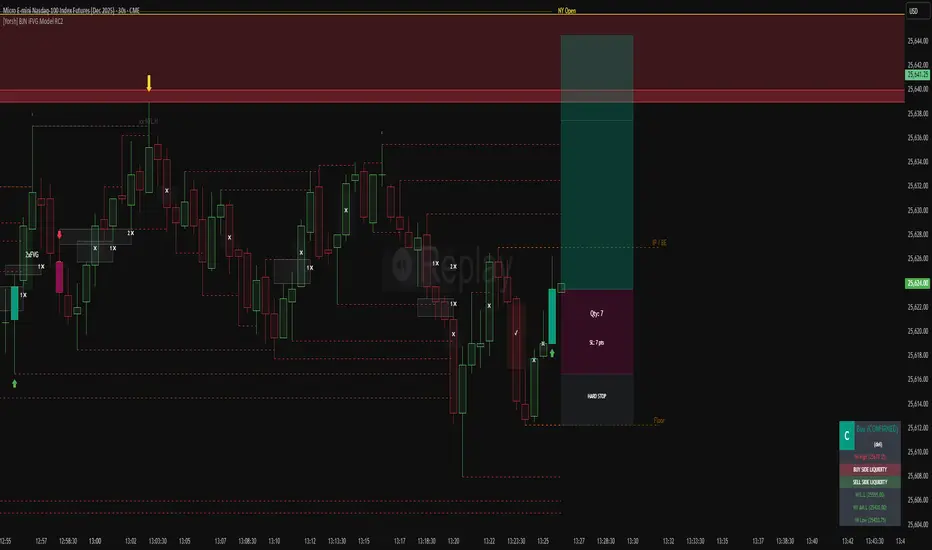
[Yorsh] BJN iFVG Model RC1 BJN iFVG Model - Mechanical Trading System
Description:
The BJN iFVG Model is not just an indicator; it is a full-scale, semi-automated trading architecture designed to mechanically execute the specific "BJN" Inverted FVG strategy.
Designed for precision traders operating on Lower Timeframes (1m to 5m), this script eliminates the cognitive load of manual analysis. It automates every single step of the mechanical model—from Higher Timeframe narrative building to tick-perfect structural validation and risk calculation.
This tool transforms your chart into a professional trading cockpit, split into three intelligent engines:
1. The Matrix (Context Engine)
Before looking for an entry, you must understand the narrative. The Matrix handles the heavy lifting of multi-timeframe analysis without cluttering your chart:
Real-Time Delivery State: Automatically detects if price is reacting from valid HTF PD Arrays (1H, 4H, Daily) to confirm a "Delivery" state.
Liquidity Sweeps: Tracks Fractals across three dimensions (1H, 15m, and Micro-Structure) to identify liquidity raids instantly.
Advanced SMT Divergence: A built-in, multi-mode SMT engine scans for correlation breaks (Pivot SMT, Adjacent Wick SMT, and FVG SMT) between NQ/ES (or custom tickers) in real-time.
Time & Macro Tracking: Automatically visualizes Killzones and highlights high-probability Macro windows.
2. The Executioner (Entry Engine)
Once the context is set, the Executioner handles the specific Inverted FVG (iFVG) entry model with strict mechanical rules:
Structural Integrity: Automatically identifies the Invalidation Point (IP), Floor/Ceiling, and Break-Even levels for every setup.
Hazard Detection: The script proactively scans the "Trading Leg" for opposing unmitigated FVGs (Hazards). If the path isn't clean, the trade is flagged or invalidated.
Composite Logic: Intelligently merges "noisy" price action into Composite FVGs to reduce false signals.
Integrated Position Sizer: When a trade is confirmed, a visual box appears showing your precise Entry, Stop Loss, Hard Stop, and Take Profit levels, along with a calculated Contract Quantity based on your risk tolerance.
3. The Ranking System (Quality Control)
Not all trades are created equal. This system grades every single confirmed setup in real-time based on confluence factors:
Grades: Ranges from A++ (Perfect Confluence) to C (Low Probability).
Confluence Check: Checks for Delivery, Sweeps (HTF/LTF), SMT, and Macro alignment at the exact moment of the trigger.
Live Status Panel: A dashboard on your chart displays the current live trade status (Armed, Triggered, Confirmed) and its Rank, so you never miss a beat.
Optimization & Performance
Trading on the 1-minute timeframe requires speed. This script has been rigorously optimized for high-frequency environments:
Smart Garbage Collection: The script manages its own memory, cleaning up old data arrays to prevent lag, ensuring the chart remains fluid even after days of data accumulation.
Tunnel Vision: Calculations are strictly focused on the relevant trading leg, ignoring historical noise to maximize execution speed.
Zero-Repaint: All historical analysis is strictly non-repainting to ensure backtesting reliability.
How to Use
Timeframes: Optimized for 1m, 2m, 3m, 4m, 5m execution.
Alerts: Configure the robust alert system to notify you only when setups meet your standards (e.g., "Alert only on Rank B+ or higher").
Strategy: Wait for the Status Panel to show a "CONFIRMED" signal. Use the on-screen Position Sizer to execute the trade with the displayed risk parameters.
Stop analyzing; start executing. Welcome to mechanical trading.
----------------------------------------------------------------------------------------------------------------
RISK DISCLAIMER:
The content, tools, and signals generated by this script are strictly for educational and informational purposes only. This script does not constitute financial advice, investment recommendations, or a solicitation to buy or sell any securities, futures, or other financial instruments.
Trading financial markets involves a high degree of risk and is not suitable for all investors. The "Position Sizer" and "Trade Setups" displayed are hypothetical simulations designed to demonstrate the mechanics of the BJN methodology; they do not guarantee future performance.
Use this tool at your own risk. The author assumes no responsibility or liability for any trading losses or damages incurred in connection with the use of this script. Always consult with a qualified financial advisor and practice proper risk management.
MSS(5m) + HTF(1h) OB & Sweep Strategy (heuristic) v6My first (hopefully) working strategy. Have fun printing guys

Yash RSI Bars - timeframe alartOnly bar coloring - No extra plots or lines
✅ Custom timeframe - Colors bars based on RSI from your selected timeframe
✅ White bars - When RSI is above overbought level (default 70)
✅ Yellow bars - When RSI is below oversold level (default 30)
✅ No color - When RSI is in neutral zone
✅ Overbought → Normal - Alert fires when white bars stop and RSI falls back below 70
✅ Oversold → Normal - Alert fires when yellow bars stop and RSI rises back above 30
✅ No alert on entry - Only alerts when bars return to normal/no color
Add the indicator to your chart
Click the bell icon ⏰ on the indicator
Select which alerts you want:
"RSI: Overbought to Normal"
"RSI: Oversold to Normal"
Choose: Notify, Email, SMS, or Webhook

Yash RSI Bars - Multi Timeframersi time frame testing
Only bar coloring - No extra plots or lines
✅ Custom timeframe - Colors bars based on RSI from your selected timeframe
✅ White bars - When RSI is above overbought level (default 70)
✅ Yellow bars - When RSI is below oversold level (default 30)
✅ No color - When RSI is in neutral zone
Clean and simple! 🎯
