Mtf Supertrend Table
english
It is a study of how the supertrend indicator looks on multiple timeframes. You can see the Supertrend direction in Multiple Timeframes by looking at the chart
Türkçe
supertrend indikatörünün çoklu zaman dilimdlerinde nasıl göründüğü yönünde bir çalışmadır. Tabloya bakarak Çoklu Zaman dilimlerinde Supertrend yönünü görebilirsiniz
Multitime

2TimeFrame Candles by EsIstTurnt//Not my original idea, Ive pretty much just doubled the code to have 2 Candles .All Credit goes to the creator of "Multi-Time Period Charts" as I have it saved in my library. I cant find it anymore and searching the script doesn't appear it seems so if its you let me know (and ill credit you). Why did I opt to plot 2 candles you say? 2*candles=(info)*2. 3 if we count the regular plot. Anything more than that and its too busy/blurring to really visualize trends but this was a bit of a game changer no more switching timeframes back and forth .

Multi Timeframe MACDThis will show you the MACD (no Signal Line) of the higher timeframes (up to 4h). Current Timeframe is colored blue, higher timeframes are colored from light gray to darker gray (you can change that).

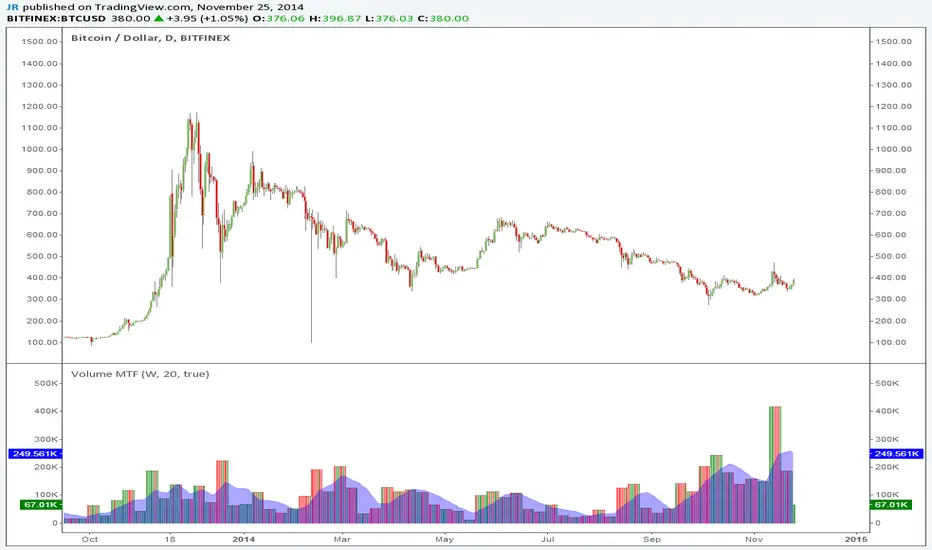
Volume MTFThis is a simple indicator you can use to separate volume from price on your chart. You can also select different time frames (MTF).
Thanks to LazyBear for cleaning up my previous messy code.