Multiple Moving Averages in one indicatorHi, that's an "enhanced" version of this indicator gently published by myfye13 .
Here's the things I've implemented:
Up to 8 moving averages
Now you can set the source of each moving average
Now you can set the length of each moving average.
Hope this will help especially those who have an indicato limit or who use multiple emas and don't wan't to see a stack of indicators list on the upper left of the chart.
Multiplemovingaverage

Multiple Ma with Bollinger band and MacDIt is a simple inclusion of the basic 3 types of indicators most commonly used.
*4 x Multiple Moving averages
*Bollinger Band
*MacD indicator.
The indicator lines are set up to display names to avoid any confusion.
This will free up space to better understand and learn how these indicators interact with price action.
Please note: this indicator makes use of standard indicator calculations and scripts and have no additional edge on the current built in ones, that is freely available within the Trading view platform

EMA 20/100/200 alwaysThis script will always show the EMA 20/100/200 daily values across any time frame chart (e.g. showing daily 20 EMA while viewing the 5 minute chart)

Multiple Moving Averages {Cybernetwork}Multiple moving average (MA) plots in a single script.
Can select between different MA types, and enable/disable a particular MA in the settings.
Enjoy. :)

8/8/8 Moving Averages
Total of 24 individual moving averages. There are 3 groups, and each group has 8 moving averages. Each group can be set the different sources and different moving average types(SMA, EMA, RMA, WMA).

Adedeji_Edge_v1.0This tool was developed to capture good entries for long and short positions. It utilizes moving averages to find best times to executive trades (long or short) and it overlays same on the chart thus minimizing chart noise i.e. no need for indicators. New traders can use this without any hassle or confusion.
In addition to the long (buy or strong buy) and short (sell or strong sell) overlays, the tool also indicates, with the background colour, areas and periods of potential upside or downside movements.
1. Blue background shows areas most conducive for potentially sustained upside price action;
2. Red background shows areas most conducive for potentially sustained downside price action.
Back-testing:
Results show that the indicator is more profitable than “Buy and Hold” (aka hodl). The back-test period was from the beginning of BTC bear market (17th December 2017) to date (10th Nov. 2019). 10% equity on $1,000 was applied to all back-test trades. Using 100% equity gives even better results.
Control conditions:
- Start date: 17th Dec 2016 (BTC ATH)
- Buy and Hold ROE: about 51% loss
Strategy script condition 1:
- Start date: Same as control date
- TF 4H
- Initial Capital $1,000
- Order size: 10% of equity
- ROE: approx. 131%
Strategy script condition 2:
- Start date: Same as control date
- TF 4H
- Initial Capital $1,000
- Order size 100% of equity
- ROE: approx. 67,000%
How to use:
Simply add the indicator to your chart, WAIT FOR CANDLE with the signal (buy or sell) to CLOSE before you go long or short .
Please note that this version 1.0 is suitable for ONLY 4H and 6H timeframes. Subsequent version(s) will include more TFs.
This tool can be used in isolation, however using it in conjunction with
1. A Moving Average (preferably the 32 EMA) gives users more information about ongoing price-action.
2. Applying trendlines (horizontal and/or dynamic support and resistance) give users better overview of the space and where sudden price bursts or reversals may occur.
Possible scenarios:
a. Buy signals (buy or strong buy) above the EMA is very bullish;
b. Sell signals (sell or strong sell) below the EMA is extremely bearish.
Variant conditions that do not confirm to the above two conditions may occur.
This tool was developed SPECIFICALLY for XBTUSD pair on Bitmex. It may be used for other trading pairs and exchanges although primary back-testing was not extended to other pairs or exchanges.
Development/improvement is a continuous thing!
Disclaimer:
Past performance does not guarantee future results. This tool/indicator is for educational purposes. As always you should fully understand there are high risks involved when trading cryptocurrencies and other digital instruments.

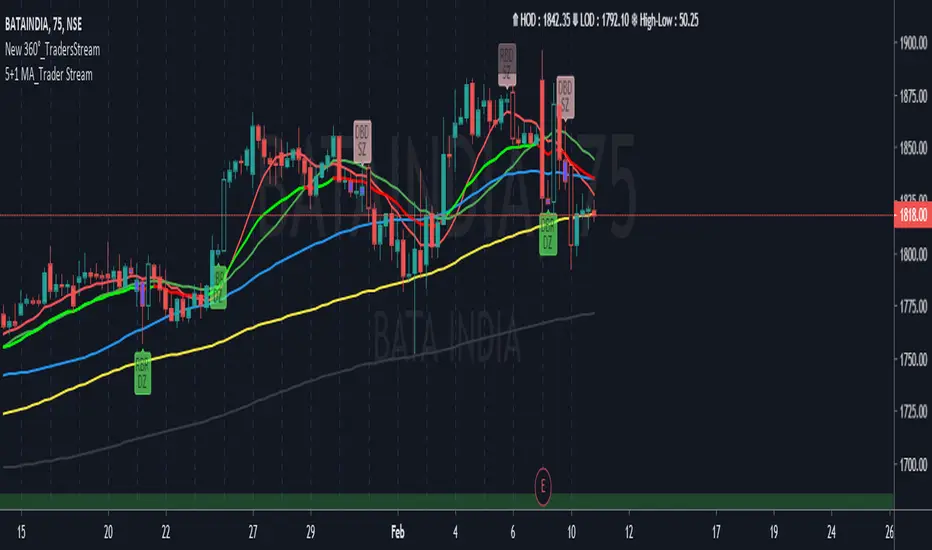
Moving Averages Traders StreamHello Guys this is a new set of Multiple Moving Averages with Bullish and Bearish coloured. Our Tool Includes SMA, EMA, RMA, VMA and VWMA. So if any comments than please.......
EMA/SMA Combos-DayCoderCombination of standard EMAs and SMAs for users who do not have a pro tradingView


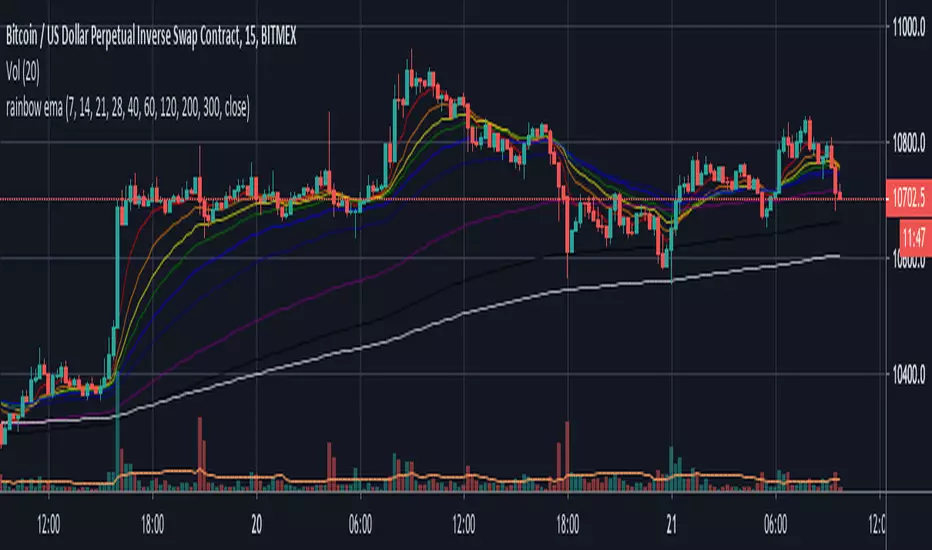
rainbow emaHi guys,
This is a multiple EMA script. Editing is free for use if you swap ema to sma as a base setting.
You can use several ema lines by adding one indicator only, and I put 7,14,21,28,40,60,120,200,300 as a threshold which I frequently use.
It is made as an open source at any time possible, so that you are free for playing with it.
Cheers,
JB

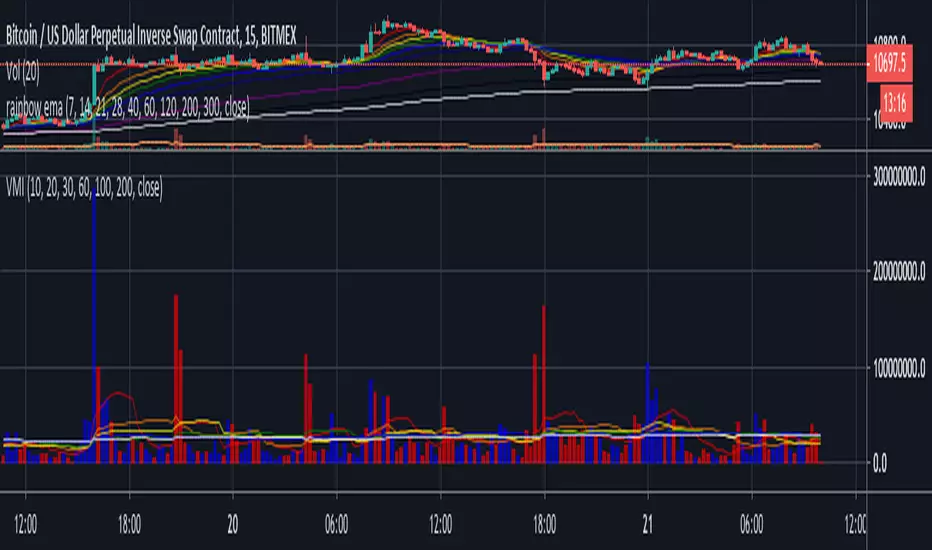
Volume moving indicatorHi guys,
This is a multiple Volume MA script. Editing is free for use.
You can use several ma lines by adding one indicator only, and I put 10,20,30,60,100,200 as a threshold which I frequently use.
It is made as an open source at any time possible, so that you are free for playing with it. Even you can add more if you are keen to do so.
Cheers,
JB
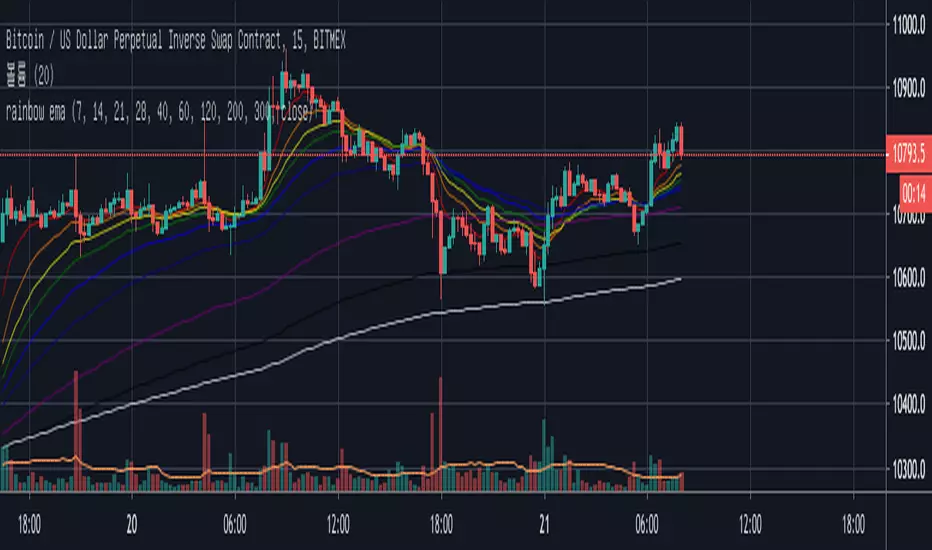
rainbow emaHi guys,
This is a multiple EMA script. Editing is free for use if you swap ema to sma as a base setting.
You can use several ema lines by adding one indicator only, and I put 7,14,21,28,40,60,120,200,300 as a threshold which I frequently use.
It is made as an open source at any time possible, so that you are free for playing with it.
Cheers,
JB
Volume moving indicatorJB가 만든 거래량 이평선 모음입니다.
하나의 지표 추가 만으로 여러개의 거래량 이평선들을 사용하실 수 있고, 제가 자주 사용하는 10,20,30,60,100,200선 넣어 놨습니다.
에디트 언제든 가능하시게 오픈소스로 구성되어있으니 매매에 도움되시길 바랍니다.

rainbow ema갤럭시님 이평선 토대로 JB가 에디트한 지수이평선 모음입니다. 편집하시면 일반 이평선으로도 사용이 가능합니다.
하나의 지표 추가 만으로 여러개의 지수이평선을 사용하실 수 있고, 제가 자주 사용하는 7,14,21,28,40,60,120,200,300선 넣어 놨습니다.
에디트 언제든 가능하시게 오픈소스로 구성되어있으니, 즐겨찾기 넣어 두시고 매매하실때 유용하게 사용하시면 됩니다.
Multi Timeframe Moving Average Collection | Swing [aamonkey]This is a Multi Timeframe Moving Average Collection (Swing Edition).
Why use it?
- Spot cluster of MAs on one chart
- See support and resistance
- Spot "freefall zones"
In the default settings you will get:
20, 100 and 200 MA of the 1D, W, and the W chart.
The color indicates significance!
From weaker to stronger support/resistance:
green(1D),yellow(W),red(M)
- Length of the MAs is modifiable
- Timeframes of the MAs is modifiable
- Which MAs you want to see
- Colors
Why use this if there is a Swing edition, that can do the same?
You can use this Swing Edition if you don't want to change between the Swing and Scalp timeframes in the settings.
Just turn on of the two on or off.

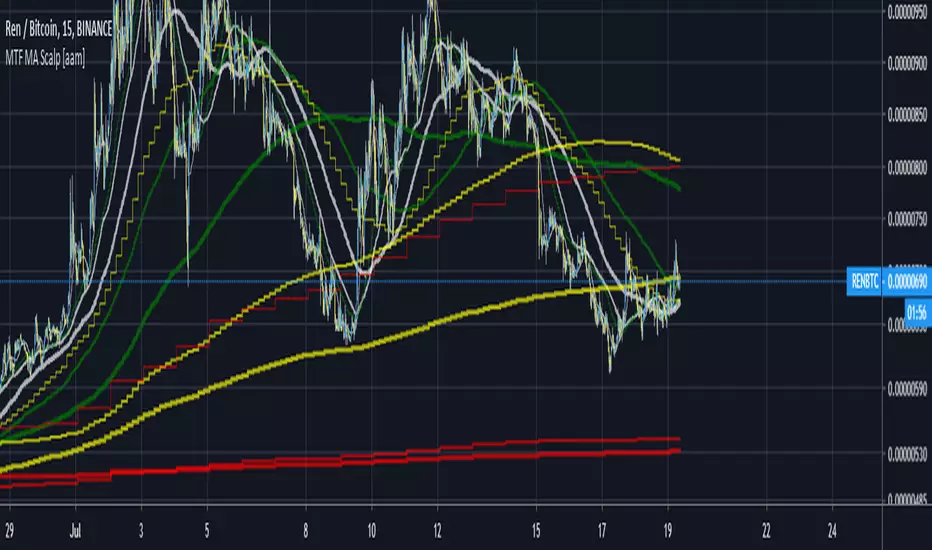
Multi Timeframe Moving Average Collection | Scalp [aamonkey]This is a Multi Timeframe Moving Average Collection (Scalp Edition).
Why use it?
- Spot cluster of MAs on one chart
- See support and resistance
- Spot "freefall zones"
In the default settings you will get:
20, 100 and 200 MA of the 15min, 1h, 4h, and the 1D chart.
The color indicates significance!
From weaker to stronger support/resistance:
white(15min), green(1h),yellow(4h),red(1D)
- Length of the MAs is modifiable
- Timeframes of the MAs is modifiable
- Which MAs you want to see
- Colors
Triple Moving Averages with Bollinger BandsCombines 3 moving averages with Bollinger Bands. Each moving average can be configured to be SMA or EMA.

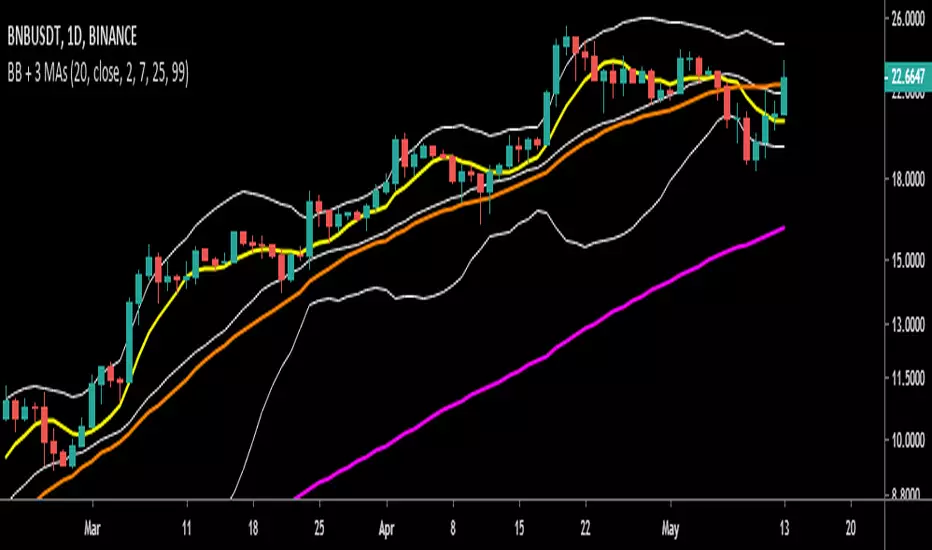
Bollinger Bands and 3 Moving Average lines in one IndicatorThe Bollinger Bands (BB) and 3 Moving Average (MA) lines in ONE indicator.
Default values were employed from Binance settings, which are:
- The BB: MA 20 and multiply by 2.
- The 3 MAs: 7, 25 and 99 periods.
The values can be modified to meet one's strategy.

Moving Average x10 (SMA, EMA)10 configurable Simple and Exponential moving averages combined in one indicator

Multiple lines EMA/SMA [AKUBI] Ver.2 - 5本の指数平滑・移動平均線単純移動平均線と指数平滑移動平均線(SMA/EMA)を最大5本引けるインジケーターです。
これまでのものとの違いは
・線の太さ
・名前の変更←これ重要
です。いままでのものをそのまま使用いただいても、問題はありません。
通常、トレーディングビューでは、
移動平均線を5本同時に表示させるには「5つのインジケーターを必要とします」。
しかし、 このインジケーターは1つ使えば最大5本まで同時に表示させることができます 。
また、余計なオプションは一切ありませんので、 どなたにでも、すぐにご使用いただけます 。
1)まず、この画面の右下にある「お気に入りに追加」をクリックしてください。
そうすると、インジケーターの「お気に入り」からいつでも呼び出せます。
もしくはインジケーターの検索欄から「AKUBI」と検索しても見つけられます。
使い方は簡単。
2)EMA(指数平滑移動平均線)か SMA(単純移動平均線)のいずれかを選択。
3)その後、お好きな期間を入力してください。
単純移動平均線(SMA)というのは、「5」と入力すれば、5本分のローソク足の終値の平均が表示され、それを結んだ線です。
指数平滑移動平均線(EMA)というのは、少し計算を複雑にして、より素早い動作を実現したものです。
デフォルトでは期間として(7,28,84,100,500)の5種類があらかじめ入力されています。
このまま使っても問題ありませんが、ネットで「移動平均線 設定」と検索すれば、いろいろな設定が紹介されていますので、参考にしてみてください。
不要な線があれば、チェックを外すだけです。
とっても簡単、便利です。
It is all in one. You can use 5 moving average lines with this one indicator only.
It is so easy. Just add this indicator. Next step, please add your favorite periods.
If you think this is an unnecessary line, you just remove in the check box.
Thank you!


