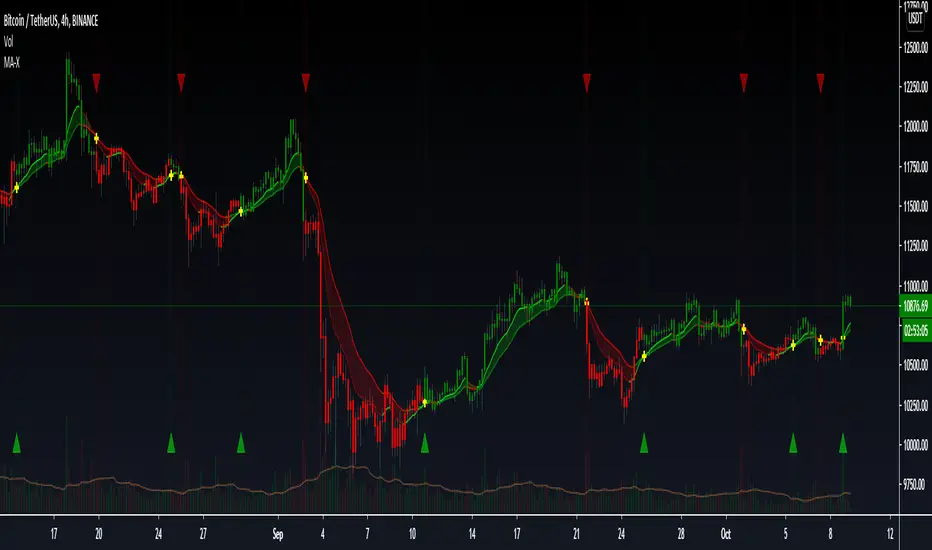
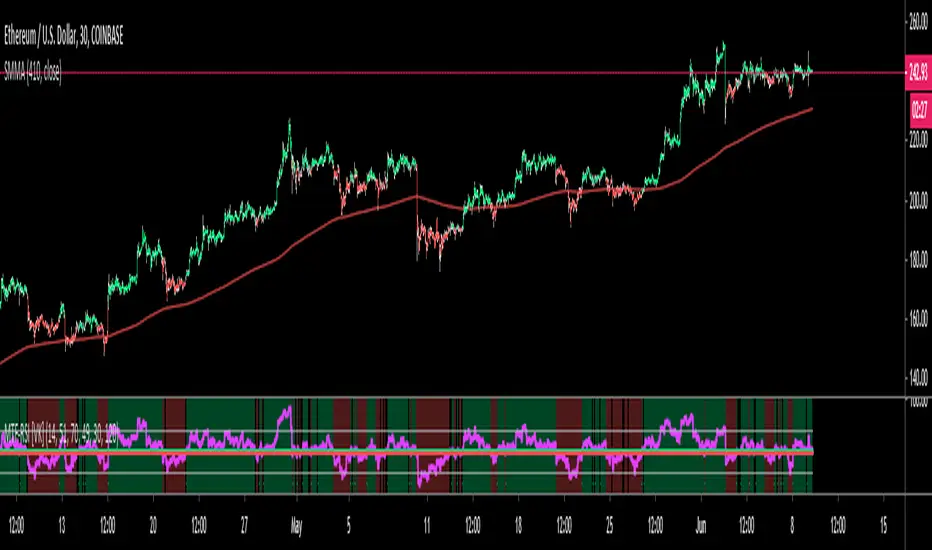
MA MTF Momentum HistogramMy own interpretation indicator which i call multi time frame moving averages momentum with NO LAG EMA support (Optional).
The indicator is calculated by subtracting the long-term EMA from the short-term EMA .
This pretty much resembles the MACD moving averages calculation but without the smoothing of the histogram.
Can also be used to find divergences.
The background shows the main trend with higher time frame which can be set in the settings.
Aimed to use with Higher time frame (Double or more) but can also work with lower time frame.
How to use the indicator?
==Histogram==
Green: Momentum of asset is positive and increasing.
Lighter Green: Momentum of asset is still positive but decreasing and can revert to negative momentum.
Red: Momentum of asset is negative and increasing.
Lighter Red: Momentum of asset is still negative but increasing and revert to positive momentum.
==Background Color - Main Trend==
Green: HTF (Higher time frame) momentum is positive.
RED: HTF momentum is negative.
Feel free to comment and Follow to stay updated with upcoming scripts: www.tradingview.com
NOTE: BARS ARE COLORED BY DEFAULT WITH HISTOGRAM COLORS! (Can be changed in settings)
Mtf

Supertrend Screener PanelScript to display Supertrend trend state of 8 different securities in a panel. Timeframe & Tickers which are to be displayed can be configured from settings.
Part of code is from the ADX DI Monitoring Panel script by u/wugamlo with his permission. Thanks to him for that and do please check out his work also.

TheStrat MTF High/LowI just started learning about #TheStrat by Rob Smith. I created this tool as it helps me see the bigger TFs over my short TF periods. It plots the Highs and Lows of the current and past Quarter, Month, Week, Day, 6hour, and 1hour. (I added the 6 hour for myself for use with cryptos which run 24 hours). It leaves the previous Highs/Lows plotted as well so you can see how the candles are moving within the bigger candlestick . Example, if you select the 15 minute candlestick , it will also list the current high/low for the 1h, 6h, D, W, M, and Q.
It has customization that will disable whatever TF's you are not interested in.
It has auto-detect and disable lower TFs that are less than or equal to the current selected TF. This function will only work to disable when one of the above mentioned periods is selected. Example, if you select the M candle, it will disable the M, W, D, 6h, and 1h. Only the bigger TF of the Q will be visible. Example of when function wont work, if you selected the 2 Month candle it will not disable any of the TFs.
I am open to any ideas that you experienced Stratters offer. As soon as I get better at the system and generate some income for myself, I will likely make it open source. Hope this helps.

RSI on VWAP Upgraded strategyFirst of all, the idea of apply RSI to VWAP was inspired by XaviZ; at least, that where I first saw that.
I simply applied the idea and searched for apply this on lower timeframe (M15) to increase the number of positions and improve the profit factor.
The conditions to enter are the same :
long : enter on RSI crossover oversold level
short : enter on RSI crossunder oversell level
To close position, I found a little change to apply :
long : close position when RSI(VWAP) went in overbought zone and crossunder the overbought level OR after being at least x bars in the overbought zone (parameter is 28 by default) => when the first condition happens
short : close position when RSI(VWAP) went in oversold zone and crossover the oversold level OR after being at least x bars in the oversell zone (parameter is 28 by default) => when the first condition happens
With this change, I got better results specially on BTCUSDTPERP (M15) where I reach a 6.8 profit factor with 119 trades closed. Not BAD !
The defaults parameters are the best found for BTCUSDTPERP (M15), but the strategy works fine for other pairs if you take time to find the rights combinations.
In this strategy you can change (with defaults in () ):
RSI length (28)
RSI overbought level (85)
RSI oversell level (30)
Number of bars before leaving as explain above (28)
The choice to take longs only, shorts only or both
The number of coin/token by position
The start date for backtesting
Please note that the script use a pyramiding parameter of 3 (can be changed in the first line of the script); that means that you can take up to 3 positions before closing. It lets you improve average enter price but increase the risk. 3 is the best I found to improve profit factor without expose myself too much.
This script would be better if automated because of the conditions of buy and sell.
It's only for educative purpose, not an advice to invest.
All my free scripts here : fr.tradingview.com
Leave a message and don't forget to follow me ;) !

MA Cross - Multi-Timeframe The MA cross is probably one of my favourite strategies because of its simplicity but it often gets overlooked for more complex strategies.
The original author of this script is ChartArt, I have just added some extra controls and functions which are outlined below. I would just like to add that this is my first published script, everything I have learned about coding has been from studying and tinkering with many of the publicly available scripts on TV so I would like thank all the authors who give out this knowledge so freely!
Updates
- Converted to v4
- Made some graphical changes and provided more control over plots
- Added RMA and VWMA
- Added alerts
Original script can be found here
London Open Range Breakout by KviateqThis script is what I currently use to day trade forex on a 5-minute timeframe.
The script features Multi-timeframe EMA20 that uses timeframe multipliers and is smoother by the factor by which you're multiplying your current timeframe.
Default settings are set to display EMA20 on the current (M5) timeframe, as well as M15, H1, H4 and D1 timeframes.
The background color changes intensity based on how many conditions are met - are all EMAs in the right order, is the current close above/below all the EMAs.
Featured is also a range set to 1 hour since the London breakout (can be changed to M15, or however long you'd like - my current setting is 30 minute).
Also featured are levels that I find to be of most importance - such as Daily and Weekly Open, Previous Day's and Week's Highs.
The idea is to only take trades when all stars align - EMAs, break above/below the Opening Range and not to long/short into an important level.

KK_MA_MTFThis is multitimeframe Hull moving average
you can change offset to 0 if you want realtime data

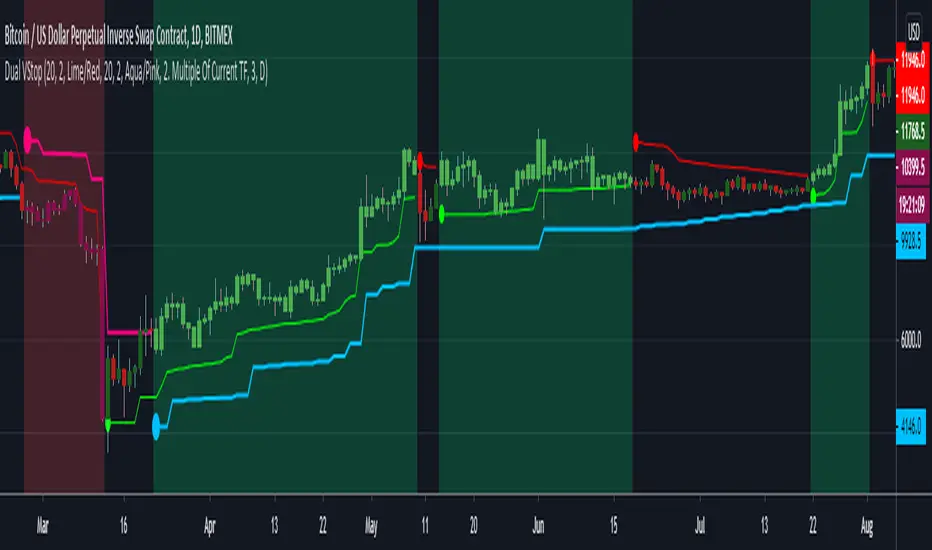
Dual Volatility StopThis merges Volatility Stop & its MTF version both published by u/TradingView . Background is colored green or red when both the current timeframe Vstop and higher timeframe Vstop point in same direction. Aim is to take the standard Vstop script which differentiates market from only uptrend/downtrend to uptrend/downtrend/sideways. There is a tradeoff with this, that there is no need for the Vstop to be always in a position which reduces trade time & frees up capital. However this leads to situations where it takes slightly more time to catch on to a trend after a reversal.
Green Background = Buy
Red Background = Sell
No Background = Flat
MTF Stoch RSI ScreenerDisplays when multiple timeframes of Stochastic RSI are overbought/oversold. Multiple consecutive timeframes being overbought/oversold can signify a short term top or bottom.
Thanks to Micse in Pinescripters telegram who helped remove a few errors from this.

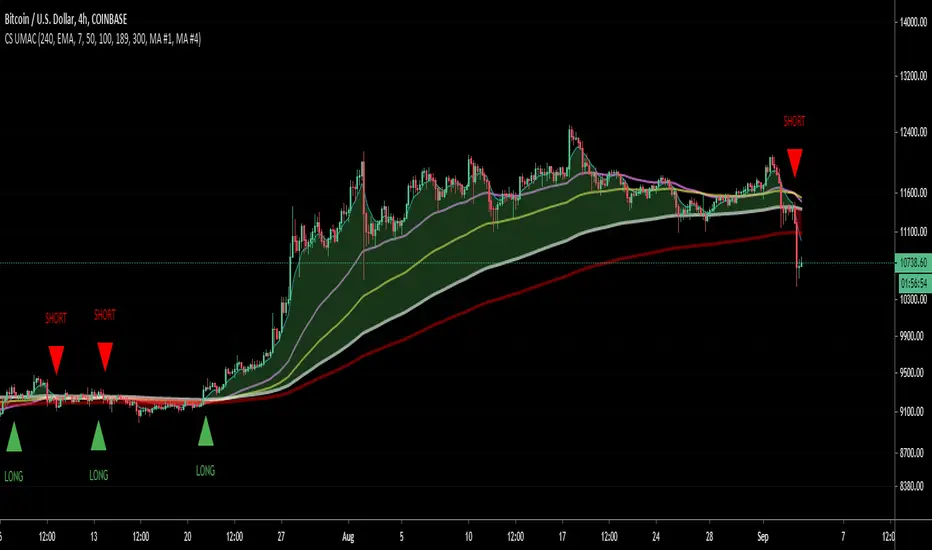
CS Ultimate MA CrossThis indicator adds 5 Moving Averages on your chart. You can select the MA Type: SMA, EMA, RMA or VWMA.
By selecting a Fast MA and a Slow MA you can also draw a cloud to make the Bull or Bear bias more visual. Possibility to add on the chart Long/Short signal.
MTF possible by changing the range which is particularly useful for HTF analysis while looking a LTF price action.
MTF SMA on specific timeframe(5M-4H)Japanese below. 日本語の説明は下記
This is multi time frame simple moving average that is shown only on the specific timeframe; 5M, 15M, 30M, 1H, 4H.
Problem of conventional MTF moving average is that MTF MA is sometimes annoying especially when you look at upper timeframe such as daily chart and/or weekly chart.
e.g. You set 20 MA of 4 hour chart into 1 hour chart, however, when you look at daily chart, daily chart also shows 20MA of 4 hour chart which is unnecessary.
This is why I have developed this MTF SMA indicator shown only on the timeframe from 5M to 4 hour.
With this indicator, even if you set MA of upper timeframe(such as 4 hour) into Lower timeframe, that MA will not be shown on above daily chart.
You can customize adding or removing below code;
timeframe.period == “X”? security(syminfo.tickerid, res, sma(src, ma_len))
X is the timeframe that you would add/remove from the indicator.
——————————————————————————————
特定の時間軸にのみ表示されるマルチタイムフレーム移動平均線のインジケーターです。
従来のマルチタイムフレーム移動平均線の問題点は、上位足に切り替えた時にもマルチタイムフレーム移動平均線の設定が表示され、チャートが見にくくなる点でした。
例: 4時間足の20MAをマルチタイムフレーム移動平均線としてセットしたとします。この場合、1時間足などの下位足で4時間足の20MAが表示されることになりますが、同時に日足や週足といった上位足チャートを見る時にも、この4時間足の20MAが表示されてしまいます。
このインジケーターでは、従来のマルチタイムフレーム移動平均線と同様に、設定元となる上位足の時間軸(4時間、日足など)を選択し、期間とソースを設定することができる一方で、表示されるのは5分足、15分足、30分足,1時間足、4時間足のみとなります。
スクリプトのMAの取得部分に以下コードを追加することで、必要な時間軸を追加・削除することが可能です。
timeframe.period == “X”? security(syminfo.tickerid, res, sma(src, ma_len))
Xは表示したい時間軸です。4時間足チャートからこのインジケーターを削除したい場合は
timeframe.period == “240”? security(syminfo.tickerid, res, sma(src, ma_len))
を削除してください。

Efficient Support & Resistance LevelsThis script is a mixture of my two previous scripts "True Strong Classical Support/Resistance Levels" and "Hidden Supports & Resistances + Round Levels". This combination brings on better identification of the most efficient support/resistance levels.
Note that "Hidden SnR Levels" part of the code is only expected to work on Forex charts, but apart from that, the other parts could be applied to any chart.
The script may:
- Draw classical support/resistance levels which retraced the price previously, aided by multi-timeframe analysis
- Draw hidden support/resistance levels based on psychological patterns of the price
- Adjust to wicks better than Pine Script built-in pivot functions
- Differ the levels color based on chart reactions
- Merge nearby classical levels to avoid congestion on the chart
Feel free to use it and send me your thoughts.

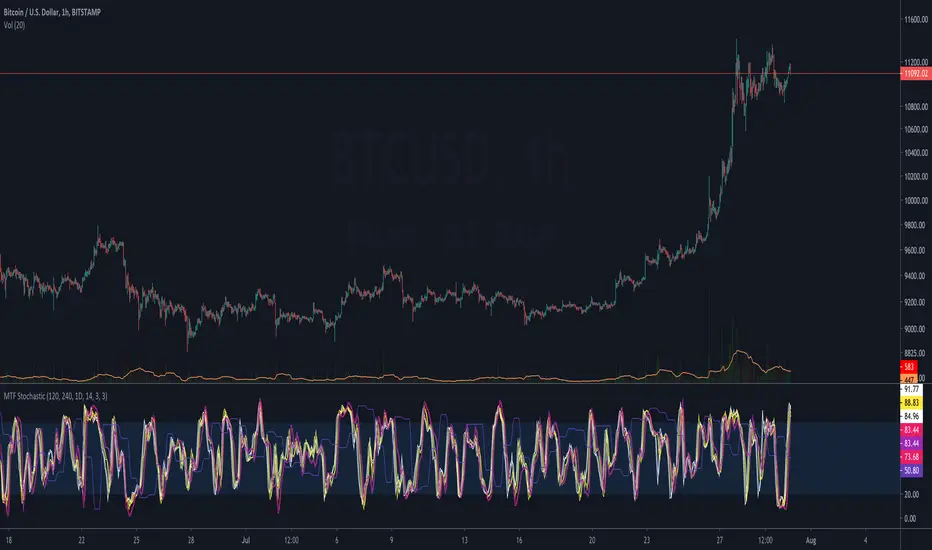
Multi-TF Stochastic - KingThiesStandard Stochastic Script with 3 Additional Time-Frames available to add.
For Accurate Results, be sure to leave your chart on a lower TF than the higher requested TF's.
Change the inputs to your preference, recommended to use intra-day TFs on intraday charts and the higher ones above 1D mainly when your chart is 1D or higher.
Turn off higher plots and change colors accordingly, to your preference
Users can adjust the input values to their preference. All Inputs for the smooth K and smooth D are input to each time-frame input
Meander Indicator + fibo MTFI made Meander Indicator with fibo.
It also has MTF.
I haven't made the actual strategy yet, but it reacts quite well to short term, hourly or more.
Have a good day :)

Multi Timeframe VWAPsThis is a Multi Timeframe VWAP indicator.
All timeframes are customizable.
Thanks to volume weighting you can get a clear view of some important levels that may not be easily identifiable otherwise.
Multi timeframe VWAP breaks and bounces can help identify higher timeframe reversals/rejections.
You can apply this study to virtually any market with available volume data and it will give you meaningful insights as to where price is in relation to various timeframe VWAPs.
Default timeframes are set to:
30min
60min
1 day
1 week
1 month
Quarterly (3 month)
Yearly (12 month)
Generally these settings will suffice most market conditions, however you may like to set the shorter timeframes (30min, 60min) to 2 or 3 day timeframes.
Enjoy

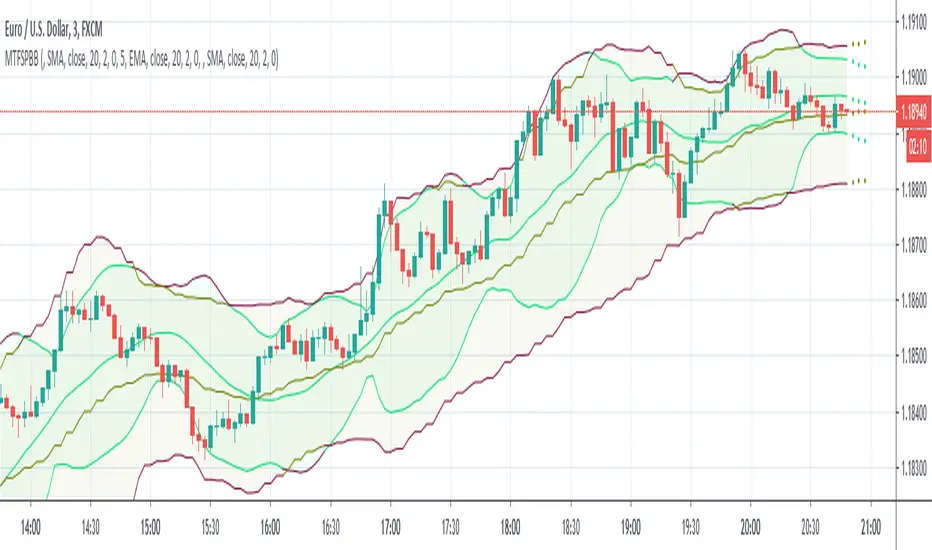
MultiTimeFrame Shifting Predictive Bollinger BandsThis is the optimized version of my MTFSBB indicator with capability of possible bands prediction in case of negative shifting (to the left).
Make me happy by using it and sending me your ideas about the prediction.
Ichimoku ++ public v0.9Description:
The intention of this script is to build/provide a kind of work station / work bench for analysing markets and especially Bitcoin . Another goal is to get maximum market information while maintaining a good chart overview. A chart overloaded with indicators is useless because it obscures the view of the chart as the most important indicator. The chart should be clear and market structure should be easy to see. In addition, some indicator signals can be activated to better assess the quality of signals from the past. The chart environment or the chart context is important for the quality of a signal.
The intention of this script is not to teach someone how to trade or how to use these Indicators but to provide a tool to analyse markets better and to help to draw conclusions of market behaviour in a higher quality.
A general advise:
Use the included indicators and signals in a confluent way to get stoploss, buy and sell entry points. SR clusters can be identified for use in conjunction with fractals as entry and exit pints. My other scripts can also help. Prefer 4 hours, daily and a longer time frame. There is no "Holy Grail" :).
If someone is new to trading you should learn about the indicators first. Definitely learn about Ichimoku Cloud Indicator.
Integrated indicators are:
Ichimoku Cloud and signals
Parabolic SAR and signal
ATR stop
Bollinger Bands
EMA / SMA and background color as signal
Williams Fractals and signal
Puell Multiple signal

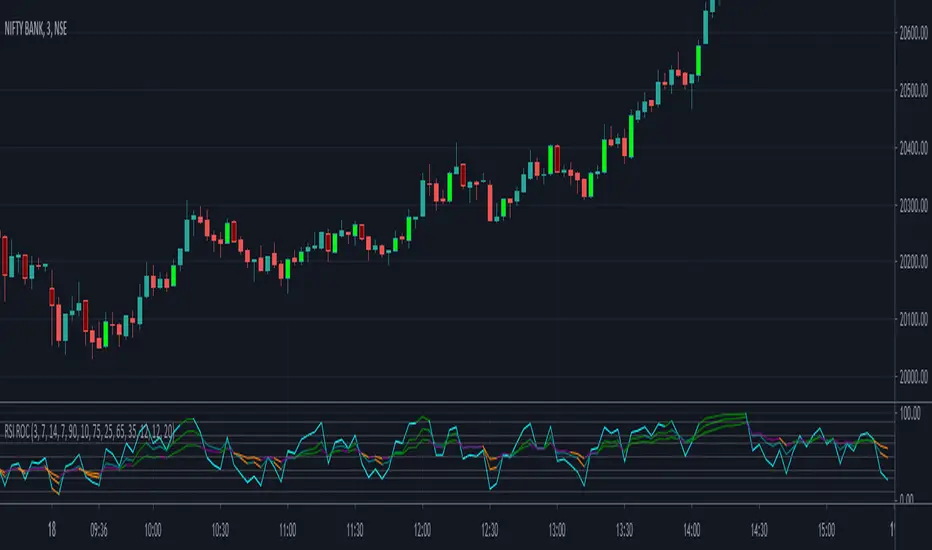
RSI - Rate of ChangeCode based on RSI lower value crossing over higher value
RSI Rate of Change of different lengths used in all parts of code
ADX and CCI use is limited in V1.0
Script provides 3 RSIs and overbrought and oversold for each of these RSIs. When RSI cross over each other clearly Buy and Sell signals are fired.
Lime is buy and Maroon means sell. Use it along with EMA
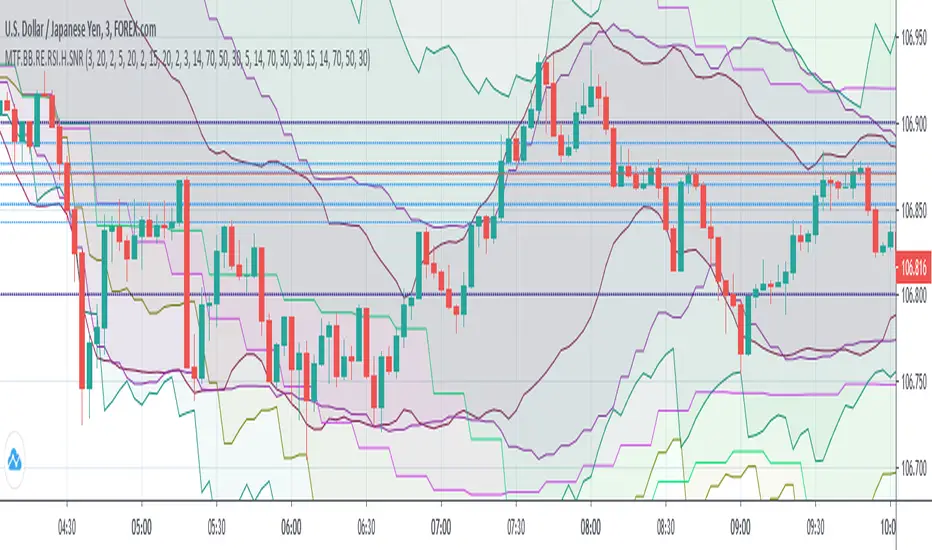
(MTF) Bollinger Bands + RE RSIs + Hidden Supports & ResistancesI merged some of my previous written indicators, because a combination of multi-timeframe Bollinger Bands, RE RSI and Resistance/Support levels could help a lot.
Don't forget to add my other useful indicator (Classical SnR) to the chart to maximize your profit!
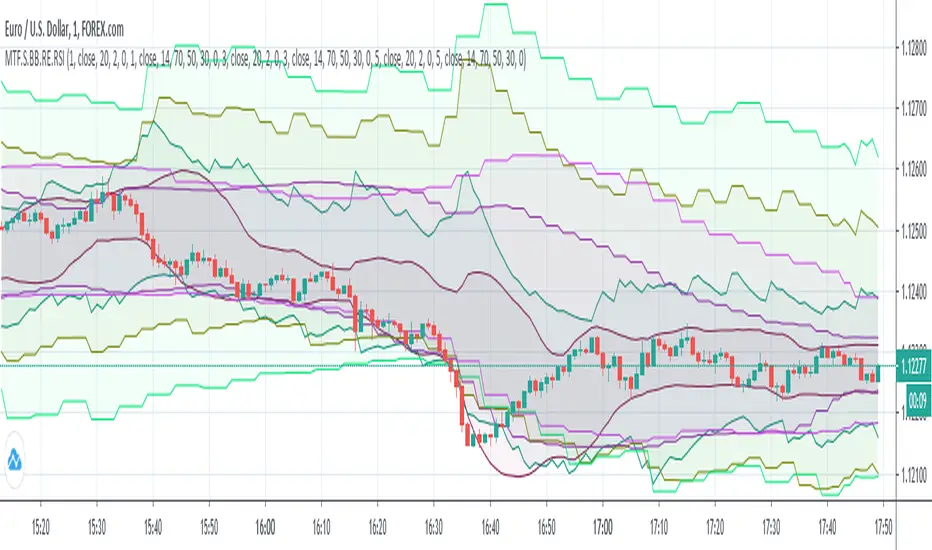
MTF Shifting BBs + Reverse Engineering RSIs Overlay on ChartAnother multi-timeframe indicator presents 3 MTF (each) Bollinger Bands and 3 MTF (each) Reverse Engineering RSI and of course with shifting (left/right) capability.
RERSI in a simple term is the RSI but on the main chart alongside with candles.
There are many adjustable options like:
- Show/Hide each BB
- Show/Hide each MA
- Non-integer BB deviation values
- Positive/Negative shifting values
- Show/Hide each RSI
- Show/Hide each RSI Mid Level
- Adjustable Overbought, Oversold and Mid Levels values
I wrote this after my first script MTFSBB, because it's very useful to have BBs and RSIs together on a chart.
Calculating RERSIs will take some time, so be patient with it and feel free to use it.
MTF-RSI+Candles [VK]This is the strategy where we buy when RSI is above 51 line and sell below 49 line
Ability to change RSI TF
Ability to change default value of RSI/upline/lowline/oversold/overbought lines
Ability to switch show/hide backgrount color
Ability to switch on/off candle colors when RSI crosses up/upline down/lowline
Ability to plot B/S signals when RSI crosses up/upline down/lowline
alerts added
can also be used as standard RSI
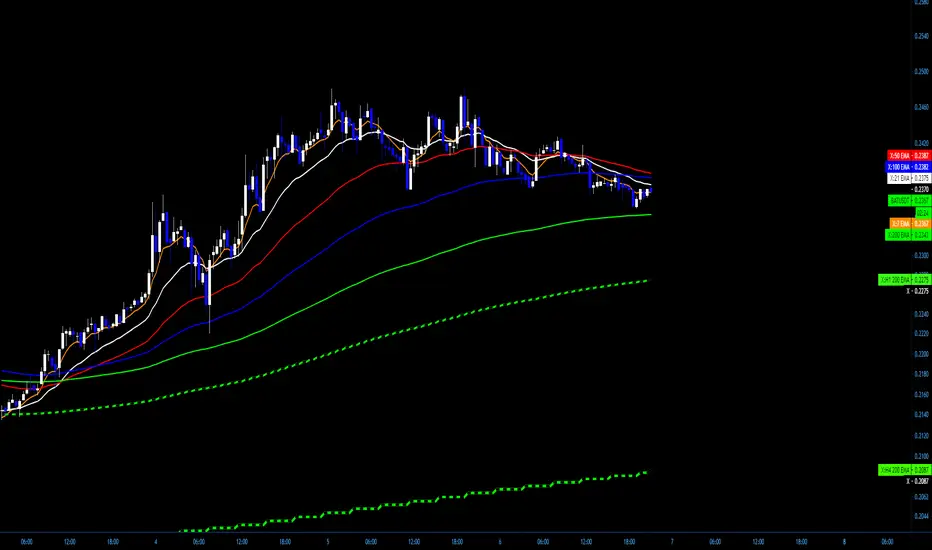
X+ - SMA/EMA Suite with MTF
I often use a mix of EMAs and SMAs in my analysis and turning them on and off and adding and removing them from the chart becomes a bit of a burden.
In this script you'll find the most common EMAs and SMAs that I use on just about every chart I look at.
If the feature ever becomes available to save settings as templates from within the script, then I will do that but for now there are two work-arounds.
www.dropbox.com
Work-Around 1: Create the suite that you want recalled by selecting what Moving Averages you want and then SAVE AS AN INDICATOR TEMPLATE. This has a fairly quick recall and you'll be able to access one that says "all EMA's" or "all SMAs" or "SMA/EMA for H4 Chart with MTF". Whatever you want.
That may work for some traders but others don't want the fuss of having their other indicators in the way or being added or removed from their templates, etc.
Work-Around 2: Add two instances or even three, whatever. I personally use two because the select on and select off can be a hassle when dealing with so many options.
I essentially use one that I have selected when I am looking at Daily or Higher Charts and then I hide that one an unhide the other one that is already setup for lower timeframe charts, from the M1 to the H4.
This allows me to run two full suites. I was looking for a way to save settings like we can with the Fibonacci tool but I simply could not find a solution. So, this will have to do.
The MTF - Multi-Time-Frame
I have it coded to display the 20 SMA from the M30, H1 and H4 Charts - no matter what timeframe you are currently viewing.
I also have the 200 EMA from the same charts (M30, H1, H4)
The Settings can be changed but the readout on the scales will stay 20 and 200.
www.dropbox.com
You can change the SMA and the EMA to whatever you want as well as the Source, an offset if desired and the timeframe from which it will display from.
Above is a screenshot of an H4 Chart with only the MTFs. So you will see the 20 SMA from the M30 as well as the H1 and H4. They have a checkered style to them that can be customized in the settings. Those are White and Black.
The Green and Black are the 200 EMAs from the M30 and the H1 and H4.
www.dropbox.com
If you want to be able to see the Label on the scale, you can head to Settings/Scales and Tick on "Indicator Name Label"
www.dropbox.com
www.dropbox.com
I have a pretty specific color format that I follow but I do a lot of teaching. For me, it's far easier to have the readout of what line is what right on the chart:
7 EMA is the 7 EMA and not just "EMA" or something even longer that takes up a good portion of your screen when you turn on the indicator name label option.
Anyway, I hope somebody finds a use for this and if so, Awesome.
Above are just some ideas of how I use it.
MultiTimeFrame Shifting Bollinger BandsJust 3 Bollinger Bands with different adjustable timeframes plus shifting (left/right) capability and non-integer deviation values.
I wrote this because I couldn't find the perfect BB indicator that matches my needs. Feel free to use it.
