MA Crossovers (EMA + SMA)A versatile Moving Average tool designed to spot trends using a hybrid EMA/SMA setup. It provides clear visual signals and an on-chart trade simulator to track potential performance.
Features:
Hybrid Setup: Combines a fast EMA (Length 9) with three SMAs (50, 100, 150) for balanced trend detection.
4 Crossover Alerts: Monitors up to 4 different crossover pairs simultaneously with customizable markers.
Visual P&L Simulator: Automatically draws entry/exit lines and calculates Profit/Loss percentages for the primary crossover, helping you visualize trade potential.
Price Labels: Displays the exact price at every crossover point for precision.
Fully Customizable: extensive control over colors, opacity, line widths, and label positioning to keep your chart clean.
Hareketli Ortalamalar

Rainbow MA Width█ OVERVIEW
Rainbow MA Width is a companion indicator for Rainbow MA Cloud. It displays ribbon width as a normalized Z-Score, allowing traders to visualize trend momentum expansion and contraction relative to recent history.
█ CONCEPTS
Z-Score Normalization:
Rather than displaying raw width values (which vary by asset and timeframe),
this indicator normalizes the ribbon width using Z-Score calculation:
Z-Score = (Current Width - Average Width) / Standard Deviation
Z-Score Interpretation:
• 0 = Average width (mean)
• +1 to +2 = Expanding (above average, strong trend)
• -1 to -2 = Contracting (below average, weakening trend)
• Beyond ±2 = Extreme (statistical outlier, potential reversal)
Width Calculation Modes:
• Outer — Distance between fastest and slowest MA: |MA1 - MA8|
• Average Gap — Mean of all adjacent MA gaps
• Total Gap — Sum of all adjacent MA gaps
█ FEATURES
1 — Width Mode Selection
Three methods to calculate ribbon width.
"Outer" recommended for aligned trends.
2 — Z-Score Period
Configurable lookback for mean and standard deviation.
Default 20 bars; increase for smoother, less reactive readings.
3 — Zone Fill Coloring
Cyan fill when expanding (Z > 0).
Orange fill when contracting (Z < 0).
Yellow fill for extreme values (|Z| > 2) as warning.
4 — Alignment Background
Green background during bullish alignment.
Red background during bearish alignment.
Synced with Rainbow MA Cloud for consistency.
5 — Reference Lines
Horizontal lines at 0 (mean), ±1σ, and ±2σ levels.
Provides clear visual boundaries for interpretation.
6 — Raw Width Display
Optional secondary line showing original width percentage.
Useful for comparing normalized vs absolute values.
█ HOW TO USE
Trend Confirmation:
• Z-Score rising above 0 confirms trend acceleration
• Z-Score staying above +1 indicates sustained strong momentum
• Use alongside alignment background for confluence
Reversal Warning:
• Z-Score exceeding +2 suggests overextension (yellow warning zone)
• Z-Score dropping below -2 indicates extreme contraction
• Extreme readings often precede trend reversals or consolidation
Entry Timing:
• Enter trends when Z-Score crosses above 0 (expansion beginning)
• Avoid entries when Z-Score is at extreme highs (potential exhaustion)
• Consider exits when Z-Score peaks and begins declining
█ LIMITATIONS
• Z-Score is relative to lookback period; different periods give different readings
• Extreme zones (±2) are statistical guides, not guarantees
• Best used in conjunction with Rainbow MA Cloud for full context
█ ALERTS
Four built-in alert conditions:
• Z-Score crosses above/below zero
• Z-Score enters extreme high/low zones (±2)

Rainbow MA Cloud█ OVERVIEW
Rainbow MA Cloud displays 8 Moving Averages as a gradient-colored cloud to visualize trend direction and strength. The "rainbow" effect shows momentum through ribbon width, while perfect MA alignment signals strong trending conditions.
█ CONCEPTS
The indicator uses 8 MAs with Fibonacci-based default lengths (8, 13, 21, 34, 55, 89, 144, 233) to create a layered view of price momentum across multiple timeframes.
Perfect Alignment Detection:
• Bullish Alignment — All 8 MAs in ascending order (MA1 > MA2 > ... > MA8)
Indicates strong uptrend with momentum across all timeframes
• Bearish Alignment — All 8 MAs in descending order (MA1 < MA2 < ... < MA8)
Indicates strong downtrend with aligned selling pressure
• Mixed — MAs are not in sequential order, suggesting consolidation or transition
Ribbon Width:
• Widening ribbon = Trend acceleration, increasing momentum
• Narrowing ribbon = Trend weakening, potential reversal or consolidation
█ FEATURES
1 — MA Configuration
Choose from EMA, SMA, WMA, VWMA, or HMA calculation methods.
All 8 MA lengths are fully customizable.
2 — Color Themes
Five built-in themes: Rainbow, Warm, Cool, Neon, Mono.
Creates visually distinct gradient from fast to slow MAs.
3 — Alignment Background
Green background during bullish alignment.
Red background during bearish alignment.
Helps quickly identify strong trending periods.
4 — Trend Signals
Labels appear when perfect alignment forms.
"BULL ALIGN" for bullish, "BEAR ALIGN" for bearish.
5 — Information Panel
Real-time display of alignment status, trend strength percentage,
ribbon width, price position relative to cloud, and MA values.
█ HOW TO USE
Entry Signals:
• Look for alignment signals (BULL/BEAR ALIGN) as trend confirmation
• Enter long when bullish alignment forms with price above cloud
• Enter short when bearish alignment forms with price below cloud
Trend Following:
• Stay in position while alignment background color persists
• Widening ribbon confirms trend continuation
• Exit or reduce when alignment breaks (background disappears)
Support/Resistance:
• Cloud edges act as dynamic support (bullish) or resistance (bearish)
• Price entering cloud suggests consolidation or potential reversal
█ LIMITATIONS
• Alignment signals are lagging by nature (based on MA crossovers)
• Works best on trending markets; generates mixed signals during ranging periods
• Ribbon width measurement uses outer MAs only (MA1 vs MA8)
█ COMPANION INDICATOR
Use "Rainbow MA Width" indicator for detailed Z-Score analysis of ribbon expansion/contraction patterns.

Fish vs Shark Vote Dashboard (6 Signals)very simple dashboard align with fish and shark market votes 1/5 2/4 etc

Multi-TF EMA Alignment with Curvature (Buy & Sell) 2when you pick 3 times frames as a Context, Validation, and Entry, when all EMA's stack on all three time frame with curvature up or down it signals a long or short

Momentum Turtle Swing StrategyMomentum Breakout Swing Tool — Overview
This indicator is built for traders who like breakout-style swing entries with a simple, disciplined structure. It blends trend context + momentum confirmation to highlight moments when price is more likely to continue rather than chop.
Core idea
Focus on directional expansion: it looks for points where price starts moving decisively after a period of structure building.
Signals are filtered so they appear primarily when the market is showing a clear directional bias, not when it’s indecisive.
Confirmation concept
Uses a trend context filter to stay aligned with the dominant market direction.
Adds a momentum sanity check so signals are less likely to trigger when strength is fading.
Position logic (unique signals)
Designed to keep signals clean and non-spammy: it produces distinct entry markers instead of repeated triggers in the same direction.
The internal flow treats market states as “in-trade / out-of-trade” to keep the chart readable.
Exit philosophy
Exits are based on a reactive market reference (to adapt when momentum cools or structure shifts), rather than fixed targets.
The goal is to stay in the move while it’s healthy and step aside when conditions degrade.
Best conditions
Works best in markets with clear swings and breakout continuation behavior.
Less effective in tight ranges or noisy sideways phases, where breakouts can fail more often.
For educational and analytical purposes only. Always forward-test on different markets and timeframes.

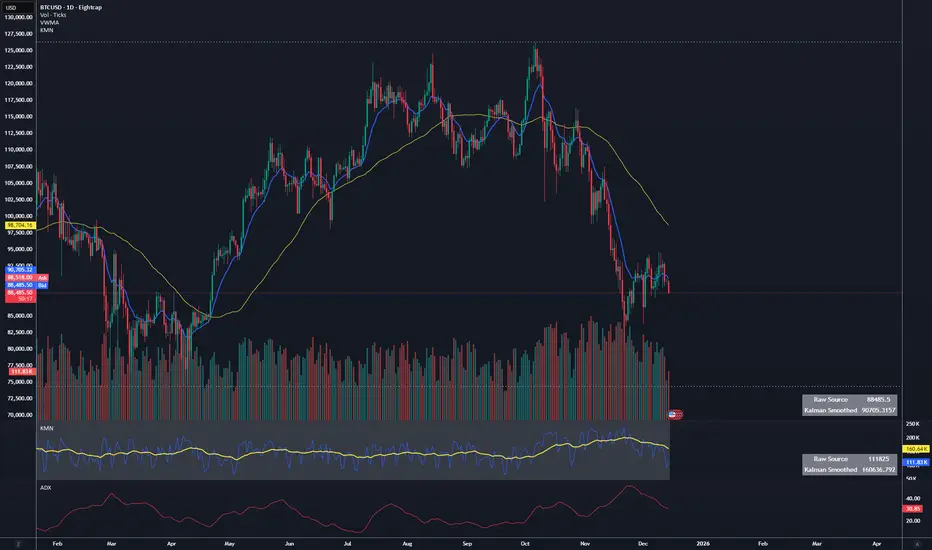
Kalman Smoother PanelPanel version of the Kalman smoothing indicator which I have setup myself to look at the volume but could be used for smoothing other noisy or erratic data values, it populates in a new pane below the main chart and has a small panel window of it's own to display the values that are output and the user is able to see the difference that way as well as in line chart format.
Anchored Cumulative AverageAnchored Cumulative Price Average
Overview
The Anchored Cumulative Price Average plots the arithmetic mean of price values calculated from a user-defined start date and time.
Instead of using a fixed lookback length, the average continuously incorporates every completed candle since the anchor point, producing a stable reference level that evolves as new data becomes available.
The indicator supports custom source selection, optional higher-timeframe calculation, and an optional High / Low average mode, making it suitable for contextual market analysis across multiple time horizons.
How It Works
• A start date and time define the anchor point.
• From that moment forward, the script accumulates price values and divides them by the total number of candles included.
• The result is a cumulative (since-anchor) average, not a rolling moving average.
• When a higher timeframe is selected, calculations are performed only when a new HTF candle completes, ensuring consistent aggregation.
This approach creates an average that reflects the market’s mean price relative to a specific event, session, or structural point.
Inputs
• Calculation Timeframe
Choose the timeframe used for the calculation. Leaving this empty uses the chart timeframe.
• Start Date / Time
Defines the anchor point from which the average begins.
Source
Select the price input used for the average:
• Close, Open, High, Low
• HL2, HLC3, OHLC4
• High & Low (plots separate averages for highs and lows)
How to Use
• Anchor the indicator to a session open, swing point, news event, or structural shift.
• Observe how price interacts with the cumulative average as more data is added.
• Use the High & Low mode to visualize mean price boundaries instead of a single central line.
• Apply a higher timeframe to view broader contextual averages while remaining on a lower-timeframe chart.
Common Use Cases
• Contextual reference for mean price since a specific date or event
• Market structure and balance analysis
• Session-based or event-anchored price evaluation
• Multi-timeframe alignment and bias assessment
• Visual support tool alongside discretionary analysis
Notes
• This indicator does not predict price or generate trade signals.
• It is designed as a contextual analysis tool and should be used in conjunction with other forms of market analysis.
• The plotted values will change as new candles form after the anchor point.

BOS Indicator (Anchored, TP1-TP3, MTF>=4, Multi-Entry)BOS Indicator (Anchored, TP1–TP3, MTF≥4, Multi-Entry)
This indicator is designed to identify high-probability Break of Structure (BOS) trade setups using a combination of market structure, EMA bias, and multi-timeframe direction confirmation. It is intended for discretionary traders who want clear structure-based entries with predefined risk and profit targets.
🔹 Core Logic
Uses a long-term EMA to define bullish or bearish market bias
Tracks market structure using swing pivots to identify valid BOS events
A trade is only signaled after:
Price is on the correct side of the EMA
A valid pullback has formed
Structure is broken in the direction of the trend
Optional multi-timeframe confirmation ensures alignment across higher timeframes before signaling a trade
🔹 Trade Visualization
When a valid BOS setup occurs, the indicator automatically draws:
Entry level
Stop loss zone
Profit target zone
Three Take Profit levels (TP1, TP2, TP3)
Risk and reward boxes anchored to the signal candle
🔹 Take Profit & Trade Management (Important)
This script is designed to be used with partial profit-taking:
TP1
Take 50% of the position off
Locks in early profits and reduces risk
TP2
Take 25% more off the position
At this point, it is recommended to move the stop loss slightly into profit (or near TP1) to protect the trade and eliminate downside risk
TP3
Let the remaining 25% run toward the final target
This allows traders to benefit from extended moves while already being protected
This approach balances risk control, consistency, and the ability to capture larger trend moves.
🔹 Additional Features
Supports multi-entry trends after exits
Works across all markets and timeframes
Visual MTF direction panel for quick confirmation
Designed to avoid false signals caused by minor consolidations
⚠️ Disclaimer
This indicator is a decision-support tool only and does not guarantee profits. Always use proper risk management and confirm signals with your own analysis.

Sentinel System V1.1
Sentinel System – High-Probability Confluence Indicator (Non-Repainting)The Sentinel System is a powerful all-in-one indicator designed for traders who want clean, high-probability entries with minimal false signals. Built around the principle of multiple confluence, it combines trend filtering, momentum triggers, and dynamic price zones to deliver precise buy/sell arrows only when everything aligns.Key Features:Trend Filter: Uses EMA 50/200 to ensure signals only appear in the direction of the prevailing trend (no counter-trend noise).
Sentinel Trigger: Custom fast/slow momentum crossover optimized to catch the beginning of impulsive moves.
Sentinel Zones: Shaded dynamic areas based on recent pivots/fractals, mild overbought/oversold conditions, and relative strength. Signals are only validated inside these high-confluence zones.
Clean Arrows & Alerts: Non-repainting ↑ (long) and ↓ (short) arrows with pop-up, sound, and push alerts.
Confluence Dashboard: Small on-chart label showing signal strength (Strong / Medium / Weak).
Works on any timeframe and any asset – exceptional performance on volatile markets like BTC, ETH, XAU/USD, and major forex pairs.
Why traders love it:Extremely low false signal rate thanks to triple-layer confirmation.
Fully non-repainting – once an arrow appears, it stays.
Perfect for scalping (lower TFs) or swing trading (higher TFs).
Simple and clean visuals – no chart clutter.
Whether you're a beginner looking for reliable signals or an experienced trader seeking confluence confirmation, Sentinel System helps you stay on the right side of the market with confidence.Feel free to test it extensively – the results speak for themselves. Disclaimer: No indicator guarantees profits. Always use proper risk manageme
¿Cómo funciona?Combina tres capas de confirmación:Tendencia (EMA).
Momentum (trigger).
Zona de precio dinámica.
Solo cuando las tres coinciden, aparece una señal. Esto reduce mucho las entradas falsas.¿Para qué sirve?Funciona en cualquier timeframe y cualquier activo.
Destaca especialmente en mercados volátiles como Bitcoin (BTC), Ethereum (ETH), oro (XAU/USD) y pares mayores de forex.
Ideal para scalping (timeframes bajos) o swing trading (timeframes altos).
Perfecto para principiantes que buscan señales claras o traders avanzados que quieren confirmación extra.

Advanced Rainbow EMA + SMMA SystemAdvanced Rainbow EMA + SMMA System
This custom indicator overlays eight rainbow‑colored EMAs (20, 25, 30, 35, 40, 45, 50, 55) together with two Smoothed Moving Averages (SMMA 50 in white, SMMA 200 in red).
Features:
🌈 Rainbow EMAs: Smooth gradient from yellow → gold → orange → dark orange → tomato → crimson → red → blue, showing short‑ to medium‑term momentum.
⚪🔴 Smoothed Moving Averages: Thick white SMMA (50) and thick red SMMA (200) for long‑term trend context.
🟩🟥 Background shading: Green when EMAs align bullish and SMMA 50 > SMMA 200, red when bearish.
📈📉 Signal arrows: “BUY” labels on Golden Cross (SMMA 50 crossing above SMMA 200), “SELL” labels on Death Cross (SMMA 50 crossing below SMMA 200).
🔔 Alerts: Built‑in TradingView alerts for Golden/Death Cross and for strong bullish/bearish EMA alignment.
Use case: This tool helps traders quickly visualize short‑term momentum against long‑term smoothed trend direction. It highlights strong trending conditions, potential reversals, and crossover signals, making it suitable for swing trading, trend following, and confirmation of entries/exits.

Triple VWAP: Anchored# Triple VWAP: Anchored + Last 2 Sessions
## 📊 Overview
**Triple VWAP** is a professional-grade Volume Weighted Average Price (VWAP) indicator designed for serious traders who need multi-timeframe volume analysis on a single chart. This indicator combines three powerful VWAP calculations: a custom **Anchored VWAP** from any historical date, a real-time **Current Session VWAP**, and **Previous Session VWAP** reference levels—all with configurable standard deviation bands.
Perfect for intraday traders, swing traders, and institutional-level analysis on Indian markets (Nifty, BankNifty) and global instruments.
***
## ✨ Key Features
### 🎯 Three Independent VWAP Calculations
**📍 Anchored VWAP (Long-term Reference)**
- Anchor VWAP from any specific date and time (year, month, day, hour, minute)
- Ideal for tracking price action from significant market events, earnings, or trend reversals
- Maintains accumulation from your chosen anchor point throughout the entire timeframe
**📅 Current Session VWAP (Real-Time)**
- Automatically resets at the start of each trading day
- Calculates dynamically as new bars form during the session
- Shows institutional trading levels and intraday fair value
**📆 Previous Session VWAP (Reference Levels)**
- Displays yesterday's final VWAP as horizontal reference lines
- Helps identify support/resistance zones from prior session
- Useful for gap analysis and opening range strategies
### 📐 Standard Deviation Bands
Each VWAP calculation includes optional standard deviation bands:
- **±1 SD** - Identifies normal price deviation zones
- **±2 SD** - Marks extreme price movements (high probability reversal zones)
- **±3 SD** - Ultra-extreme levels (rare price extensions)
Configure which SD levels to display for each VWAP type independently.
### 🎨 Customizable Visual Settings
- **Independent Color Schemes**: Assign unique colors to each VWAP type and its SD bands
- **Adjustable Line Widths**: Configure VWAP and SD line thickness (1-5 for VWAP, 1-3 for SD)
- **Plot Styles**: Previous session plots use cross-style for clear differentiation from real-time plots
- **Background Zones**: Optional colored zones when price extends beyond ±2 SD levels
- **Session Labels**: Automatic date labels marking each VWAP anchor point
### 📊 Information Dashboard
Real-time statistics table displaying:
- Current VWAP values for all three calculations
- Live standard deviation values
- ±1 SD levels for quick reference
- Distance from price to each VWAP (percentage format)
- Session tracking counter
- Color-coded proximity indicators
***
## 🔧 How to Use
### For Intraday Trading
1. **Current Session VWAP** acts as dynamic support/resistance—price above VWAP indicates bullish bias, below indicates bearish bias
2. Use **±1 SD bands** for profit targets and stop-loss placement
3. **±2 SD touches** often signal mean reversion opportunities
4. **Previous Session VWAP** provides overnight gap reference levels
### For Swing Trading
1. **Anchored VWAP** from significant events (breakouts, earnings, trend changes) shows institutional cost basis
2. Price trading consistently above/below anchored VWAP confirms trend strength
3. SD band rejections provide high-probability entry zones
### For Multi-Timeframe Analysis
1. Combine all three VWAPs to identify confluence zones
2. When current session VWAP aligns with previous session and anchored VWAP, expect strong support/resistance
3. Monitor distance percentage to gauge overextension
***
## ⚙️ Input Parameters
**📍 Anchored VWAP Configuration**
- `Enable Anchored VWAP` - Toggle on/off
- `Year, Month, Day, Hour, Minute` - Set your custom anchor point (requires confirmation)
**📅 Session VWAP Toggles**
- `Enable Current Session VWAP` - Toggle real-time daily VWAP
- `Enable Previous Session VWAP` - Toggle yesterday's reference VWAP
**General Settings**
- `VWAP Source` - Choose calculation source (default: HLC3)
- `Show ±1/2/3 SD` - Enable/disable each standard deviation level
**Visual Customization**
- Individual color pickers for each VWAP type and SD bands
- Line width adjustments
- `Show VWAP Labels` - Date labels at anchor points
- `Show Info Table` - Statistics dashboard toggle
- `Show SD Zones` - Background coloring beyond ±2 SD
***
## 💡 Trading Applications
✅ **Mean Reversion Trades**: Enter when price touches ±2 SD with reversal confirmation
✅ **Trend Following**: Trade in direction when price holds above/below VWAP
✅ **Institutional Levels**: Anchored VWAP reveals where large players accumulated positions
✅ **Gap Trading**: Use previous session VWAP to gauge gap fill probability
✅ **Volume Profile Analysis**: VWAP represents fair value based on actual volume traded
✅ **Support/Resistance Confluence**: Multiple VWAP alignment creates high-probability zones
***
## 🎓 Understanding VWAP
VWAP is the average price weighted by volume—representing the true average price paid by all market participants during a specific period. Unlike simple moving averages, VWAP gives more weight to price levels with higher trading volume, making it particularly valuable for:
- Institutional traders executing large orders
- Algorithmic trading systems
- Identifying fair value and overextended prices
- Minimizing market impact on large trades
***
## 📈 Chart Setup Recommendations
**Best Timeframes**: 1-minute to 15-minute charts for intraday; 1-hour to 4-hour for swing trading
**Compatible Markets**: Stocks, Indices (Nifty 50, Bank Nifty), Futures, Forex, Crypto
**Session Settings**: Works with standard daily sessions; automatically detects trading days (not calendar days)
***
## 🚀 What Makes This Indicator Unique
Unlike standard VWAP indicators that only show current session data, **Triple VWAP** provides:
- **Multi-session analysis** on a single chart without clutter
- **Historical anchoring** capability for event-driven analysis
- **Professional-grade statistics** dashboard
- **Independent customization** for each VWAP type
- **Optimized calculations** for real-time performance
***
## ⚠️ Important Notes
- **Anchored VWAP** requires manual date input (use significant market events like breakouts, earnings, trend reversals)
- **Session detection** based on daily timeframe changes—works on all chart timeframes
- **Previous Session VWAP** displays as static horizontal lines (reference only, not recalculated)
- **Standard Deviations** calculated using volume-weighted variance formula
- Works best on instruments with **consistent volume data**
***
## 📝 Credits & License
This indicator is published under **TradingView House Rules**. Code is original and follows Pine Script v6 best practices for performance and maintainability.
***
## 🤝 Support & Feedback
If you find this indicator valuable, please:
- ⭐ **Like** this publication
- 💬 **Comment** with your feedback or questions
- 🔔 **Follow** for updates and new releases
***
**Disclaimer**: This indicator is for educational and informational purposes only. Past performance does not guarantee future results. Always use proper risk management and combine with your own analysis before making trading decisions.
***

Multi-Timeframe Moving Averages (10 lines)Allows you to put up to 10 moving average lines on a chart and view on any timeframe.
Completely customisable:
SMA or EMA
Daily, Weekly or Current
Line Colour
Line Thickness
Line Visibility
MA Label Visibility
Defaults to line smoothing so daily and weekly appear smooth on lower timeframes. You can switch this to actual, where the MA will be 'stepped'.
Labels appear to the right of the MA end-point describing the MA, so it's easy to understand which line is which when multiple are added to the chart.
Common SMAs and EMAs are pre-populated for convenience.

Line9EMA+BOLL
The 9 EMA moving averages can be freely adjusted, and they are overlaid with the upper, middle, and lower bands of the Bollinger Bands.

Line6EMA+BOLL
The values of the six EMA moving averages can be freely adjusted, and it also integrates the upper, middle, and lower lines of the Bollinger Bands.

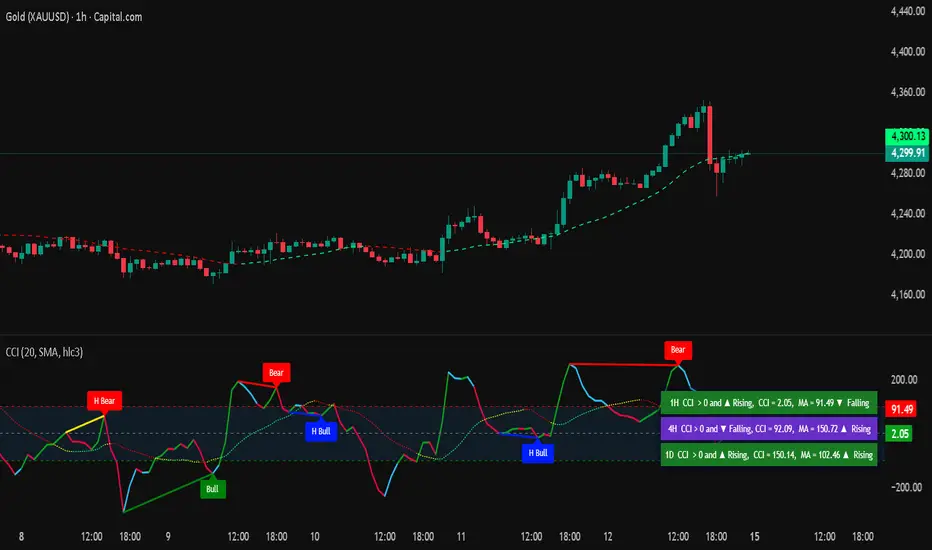
Commodity Channel IndexThe Commodity Channel Index (CCI) is a technical indicator that measures the strength of the momentum in the market, it is calculated using a Moving average (default 20 SMA, users can change the legth and the type of the MA from dashboard) using formula: cci = (src - ma) / (0.015 * ta.dev(src, ccilength)).
When CCI is under -100 that indicates a strong downtrend, and above +100 level a strong uptrend, above 0 level a bullish trend start and bellow 0 level bearish momentum.
Crossing back above -100 and bellow + 100 levels not means it is a reversal of the trend, could be just a pullback or a bounce before trend continuation.
The indicator display on the main chart a color coded moving average with the length and type selected by users for CCI calculation.
The CCI Moving average and the CCI lines in oscillator are both color coded :
1. CCI and MA both red = > Bearish trend
2. CCI and MA both green = > Bullish trend
3. MA color turn yellow or the CCI turn blue that means a possible consolidation will be next or trend change.
4 type of Divergences are detected by the script Bullish, Bearish, Hidden Bullish and Hidden bearish divergences, users can setup alarms for them, by default the divergences ae not displayed, users need to select them to be displayed on the oscillator.
A table displaying the vurrent timeframe and 2 higher timeframes of the stats of CCI and its MA.
There are 13 alerts that users can setup akarms:
Alert for Regular Bullish Divergence
Alert for Hidden Bullish Divergence
Alert for Regular Bearish Divergence
Alert for Hidden Bearish Divergence
Alert for CCI Back Above -100
Alert for CCI Back Bellow 100
Alert for CCI Extreme Overbought
Alert for CCI Extreme Oversold
Alert for trend change by CCI MA => Moving Average Color turned to yellow, that means sideways or possible trend change
Alert for CCI Crossing Above CCI MA
Alert for CCI Crossing Bellow CCI MA
Alert for cci Crossing Above 0
Alert for CCI Crossing Bellow 0
Day Trading MA Crossover IndicatorDay Trading MA Crossover Indicator Overview The Day Trading MA Crossover Indicator is a simple yet effective tool designed for day traders to identify potential buy and sell opportunities based on moving average crossovers. It plots two customizable moving averages on your chart and generates clear visual signals when they cross, helping you spot trend reversals or continuations in fast-paced markets.This indicator is ideal for intraday trading on lower timeframes (e.g., 5-min, 15-min charts) but can be adapted for swing trading or higher timeframes. It's built with flexibility in mind, allowing you to tweak the MA lengths and types to suit your strategy.Key FeaturesMoving Average Crossovers: Generates "BUY" signals when the fast MA crosses above the slow MA (potential bullish entry) and "SELL" signals when it crosses below (potential bearish entry or exit).
Visual Signals: Green "BUY" labels below bars for long entries and red "SELL" labels above bars for short entries or exits. Optional subtle background coloring highlights signals for quick spotting.
Customizable Parameters:Fast MA Length (default: 9): Period for the shorter moving average.
Slow MA Length (default: 21): Period for the longer moving average.
MA Type (default: EMA): Choose between SMA (Simple), EMA (Exponential), or WMA (Weighted) for different smoothing behaviors.
Overlay Mode: Plots directly on your price chart without cluttering separate panes.
Lightweight and Efficient: Minimal computation for real-time performance on TradingView.
How It WorksMoving Averages Calculation: The indicator computes two MAs based on your selected type and lengths using closing prices.
Signal Detection: A buy signal triggers on an upward crossover (fast MA > slow MA), indicating potential momentum shift to the upside. A sell signal triggers on a downward crossunder (fast MA < slow MA), signaling possible downside momentum.
Visual Aids: Signals appear as labeled shapes with optional background tints to emphasize key bars.
Usage TipsFor Day Trading: Apply on volatile instruments like forex pairs, stocks, or crypto. Combine with support/resistance levels or other indicators (e.g., RSI for overbought/oversold confirmation) to filter false signals in ranging markets.
Backtesting: Test on historical data to optimize MA lengths for your asset—shorter periods for aggressive trading, longer for smoother trends.
Risk Management: Always use stop-losses and position sizing. Signals are not foolproof and work best in trending conditions.
Customization: Adjust inputs via the indicator settings panel after adding it to your chart.
Example SetupOn a 5-min EUR/USD chart: Use EMA (9/21) for quick crossovers. Look for buy signals above key support with increasing volume.
Avoid choppy markets where frequent false crossovers ("whipsaws") can occur.
This indicator is provided for educational and informational purposes only. It is not financial advice, and past performance does not guarantee future results. Trading involves risk; consult a professional advisor before using any strategy. If you have feedback or suggestions for improvements, feel free to comment!

_Mean_RAWAn indicator based on the “ mean reversion ” strategy.
Works best with the EURUSD 4h pair. Different time frames can be used for other pairs.
The pyramiding feature does not make significant changes; it is not an important parameter.
It definitely does not repaint, especially if you trade on candle closes using the per bar close type alarm.
Green label -> 🟢 buy
Red label -> 🔴 sell
Yellow label -> 🟡 close
Your suggestions regarding the indicator are important to me.

Sultan Weekly Level Manager XAUUSDThis script is a comprehensive "Level Management Utility" designed to help traders efficiently map, monitor, and react to their weekly Support and Resistance plans.
Instead of manually drawing rectangles and lines every week, this tool allows traders to input their specific price levels (Buy Zones, Sell Zones, and Invalidation Levels) into the settings. The script then automatically renders these zones, sets up alert conditions, and provides essential technical context (Trend and Momentum) in a single workspace.
Why this is a "Manager" (Use Case): Many traders execute "Level-to-Level" plans. This script streamlines that workflow by:
Visual Automation: Instantly drawing standardized zones based on user inputs.
Context Integration: Unlike simple drawing tools, this script integrates EMA Trend Filters (50/200 EMA) and RSI Momentum monitoring directly alongside the manual levels. This allows the trader to see if a price level is being approached with high momentum (RSI Overbought/Oversold) or against the major trend (EMA Cross), reducing the risk of blind limit orders.
Dashboard: A mini-dashboard tracks the current status (e.g., "Inside Buy Zone 1") so traders can assess the state of their plan at a glance.
How to Use:
Step 1: Open the settings and input your weekly Buy/Sell zone coordinates (High and Low prices). Note: The default values are placeholders; you must update them based on your analysis.
Step 2: Use the Trend Context (EMAs) to decide if you are trading with the flow or against it.
Step 3: Use the Momentum Context (RSI) to wait for overbought/oversold conditions before entering a zone.
Features:
Customizable Zones: 2 Buy Zones, 1 Sell Zone, 1 Invalidation Line.
Confluence Tools: Integrated 50/200 EMA and RSI readout.
Alerts: Built-in alert conditions trigger when price enters any of your defined zones.
Credits:
EMA and RSI logic are based on standard open-source library calculations.
Zone plotting logic utilizes standard Pine Script drawing functions.

TrendSurfer Pro
TrendSurfer Pro 🚀 - Advanced Multi-Signal Trading Indicator
TrendSurfer Pro is a comprehensive all-in-one trading system that combines multiple proprietary algorithms and technical indicators to identify high-probability trading opportunities across all timeframes.
**Key Features:**
🔹 **Master Trend System** - Identifies major trend reversals using a combination of EMAs, RSI, and custom filters
🔹 **Smart Money Analysis** - Order Blocks detection with Z-Score impulse identification and rejection signals
🔹 **Session-Based Trading** - Tokyo, London, and New York session analysis with automatic breakout/rejection detection
🔹 **IFVG Detection** - Institutional Fair Value Gap identification for precision entries
🔹 **Multi-Timeframe Signals** - Triangle signals with volume analysis and VWAP proximity filtering
🔹 **KCandle/Boost System** - Advanced engulfing pattern detection with golden area projections
🔹 **CCI Signals** - Commodity Channel Index crosses with MACD confirmation filter
🔹 **Take Profit System** 🎯 - Advanced exit system combining 8 technical indicators (RSI, MACD, Stochastic, Bollinger Bands, Supertrend, CCI, EMA Cross, Price Action) with customizable confirmation requirements
**Unique Advantages:**
✅ Yellow Box Filter - Proprietary reversal zone detection
✅ Time Filters - Trade only during your preferred hours
✅ VWAP Integration - All signals respect price position relative to VWAP
✅ Customizable Alerts - Get notified for every signal type
✅ Visual Dashboard - Real-time trend confirmation table
Perfect for day traders, swing traders, and scalpers seeking precise entries and optimal exits! 🚀

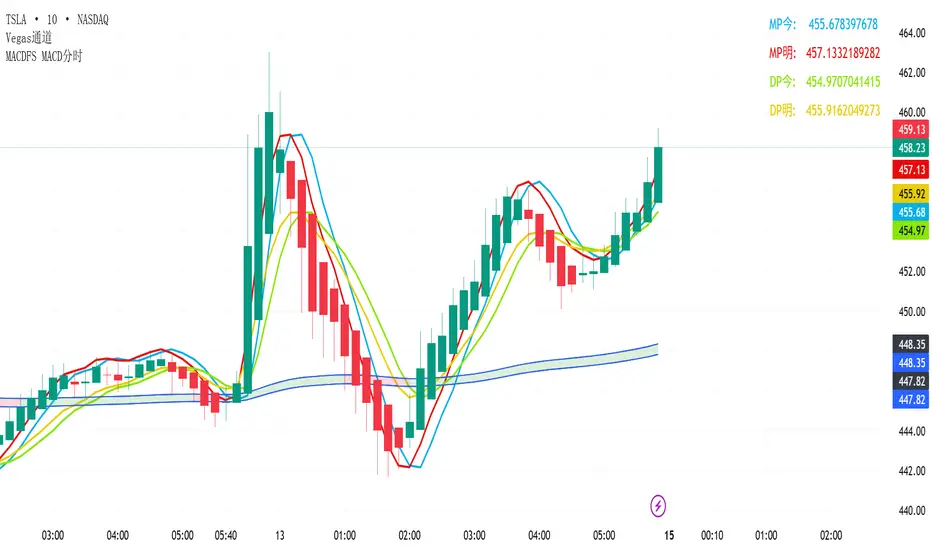
MACDFSApplicable to intraday trading options and stocks
Looking at the long-term cycle, look at the current MP
MP今是当天柱子拐头的价格
looking at the short-term cycle, look at the current DP
DP今是当天DIF线拐头的价格
MP indicates the price at the next bar turning point
MP明是下一根柱子拐头的价格
DP indicates the price at the next DIF line turning point
DP明是下一根DIF线拐头的价格
NY Session Vol Entries (RB Trading)NY Session Vol Entries (RB Trading)
NY Session Vol Entries is an intraday analysis script designed to evaluate price behavior during U.S. market hours on the one hour chart. It focuses on the interaction between relative volume expansion, adaptive volatility structure, and directional momentum alignment to help users interpret active market conditions.
The script is intended specifically for liquid U.S. equities during the New York session and is not designed for use outside this context.
Intended Usage and Scope
• Timeframe: 1 hour only
• Market hours: New York session
• Asset class: U.S. equities with consistent volume
• Style: Intraday structure and momentum evaluation
• Alerts: Available for all signal types
Core Framework
The script evaluates market behavior through three interdependent components that must align before a setup is displayed:
Relative volume behavior
Volatility expansion and contraction
Directional momentum context
This structure helps filter low-participation periods and reduce noise.
Relative Volume Analysis
The script compares current volume to a rolling 14-period average to identify periods where participation meaningfully deviates from typical conditions.
Elevated volume often occurs during session opens or active repricing phases. When volume remains muted, the script suppresses signals to avoid low-quality environments.
Adaptive Volatility Structure
Volatility bands are calculated using an 8-period true range measurement. These bands adjust dynamically based on recent volatility rather than remaining static.
During elevated participation, the bands compress to reflect tighter price acceptance. As volatility expands, the bands trail price to help visualize directional structure.
Directional Momentum Context
Directional context is determined using a dual moving average relationship.
• When short-term momentum is above longer-term momentum, the script allows only bullish evaluations
• When short-term momentum is below longer-term momentum, the script allows only bearish evaluations
This alignment reduces counter-directional signals and helps maintain structural consistency. The filter can be disabled if users wish to study range behavior.
Signal Classification
The script displays two types of informational labels:
Volume-Aligned Signals
These appear only when directional momentum and relative volume expansion align at candle close.
Momentum Rotation Signals
These indicate directional shifts regardless of volume and are intended to provide context rather than standalone triggers.
All signals are confirmed only after the candle closes. No intrabar logic is used.
Stop and Target Reference Plotting
When conditions align, the script plots visual reference levels:
• A stop reference positioned beyond the momentum structure
• A projected target reference calculated using a fixed 2R multiple relative to the stop distance
These levels are provided for consistency and planning. They are not forecasts or guarantees.
Session and Timing Considerations
The script is designed specifically for New York market hours. Liquidity and participation outside this window often distort volume and volatility behavior.
Earnings sessions should be treated with caution, as event-driven price action can override normal structural behavior.
Opening Range Consideration
The first one hour candle of the New York session can display elevated volatility due to initial repricing. Allowing additional candles to form may provide clearer structural information before evaluating signals.
Why One Hour and New York Session
The one hour timeframe balances structure and responsiveness while reducing lower-timeframe noise. New York trading hours provide the most reliable volume profile for U.S. equities, making relative volume analysis more meaningful.
Settings Overview
• Volatility period: 8
• Volatility multiplier: 3.0
• Volume average period: 14
• Momentum averages: 8 and 21
• Trend filter: Enabled by default
• Alerts available for all signal types
Chart Usage Guidelines
• Use the script on a clean chart
• Avoid stacking additional momentum or volume indicators
• Drawings should only be used when they help interpret structure
Important Notes
This script analyzes historical price and volume behavior. It does not predict future price movement or ensure outcomes. Users should test the tool, understand its logic, and apply independent risk management.
