Forex Fractal EMA ScalperThis is a forex scalper designed for very short timeframes 1-5 min max.
At the same time due to the short timeframe, is recommend to re optimize it weekly .
Its components are
Fractals
Triple EMA with different lengths
Rules for entry:
For long : we have an up fractal and all 3 ema are in ascending order
For short: we have a down fractal and all 3 ema are in descending order.
Rules for exit
We exit when we either get a reverse order or when we hit the take profit or stop loss calculated in fixed pips.
Hareketli Ortalamalar

PowerX Strategy BacktestThis script implements the Power X trading strategy by Markus Heitkoetter and Rockwell Trading. The strategy is described in detail in "The PowerX Strategy: How to Trade Stocks and Options in Only 15 Minutes a Day" written by Markus Heitkoetter.
The Power X trading strategy uses RSI, Slow Stochastic and MACD indicators. When RSI and Slow Stochastic are both greater than 50 and MACD crosses up the signal line, it signals an up-trend. If RSI and slow stochastic are both less than 50 and MACD crosses down the signal line, it signals a down-trend. Other conditions signal no trend. There is an official version of this indicator available: PowerX Strategy Bar Coloring OFFICIAL VERSION.
This script opens a long entry with an up-trend momentum and a short entry with down-trend momentum. Trades are exited when profit target or stop loss is reached. Profit target and stop loss are calculated based on 7 days Average Daily Range (ADR). If the momentum is lost, a trade is exited the next day. The quantity of assets to buy/sell is calculated based on the stop loss to limit the risk to a user defined percentage of the initial capital.
There is another implementation of the Power X trading strategy available by therealhaolu: Power X Strategy Back-test. However, according to the comments this script seems to have some flaws.

Supertrend + Stoch StrategyA strategy using ema , supertrend and stochastic .
Long entry conditions:
1. EMA 25 > EMA 50 and EMA 100 > EMA 100.
2. Supertrend indicator is green.
3. Stochastic k line cross over d line.
Long stop: the lowest price of the last k

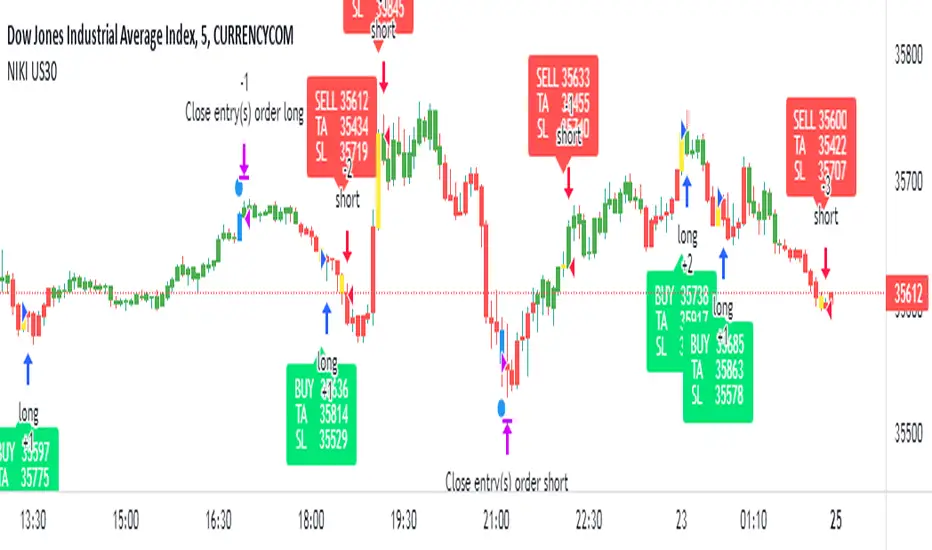
NIKI US30This strategy is specially made for US30. It is not profitable in other stocks. This strategy is based on Supertrend and moving average combination. It only works on the 5-minute chart with a candle pattern. This strategy is suitable for scalping. The yellow candle on the chart represents the entry and the blue candle represents the exit. All signals should be considered only after the candle is closed.
The backtest results are based on US30's last year's data. It has an initial capital of 100000 and the size of the lot is 1. The target is 0.5% and stop-loss is 0.3%. The commission paid is 0.001% per trade and the slippage is 1 tick per trade. The pyramiding has enabled and had a value of 3. Adjust the commission as per your broker.
There are no restrictions on the number of trades per day.
Contact us using the link given below to obtain access to this strategy.
Auto Fib Golden Pocket Band - Strategy with Buy Signalsthis strategy is based on the Indicator "Auto Fib Golden Pocket Band - "Autofib Moving Average"
it's the same as the indicator but with:
- the strategy tester included
- several entry Signal filter
- Dynamic SL

Bollinger band & Volume based strategy V2this script is upgraded version of previous one the major change is deleted script which find a highest price after entry the last of strategy is same.
If current volume is above daily average volume, and three bollinger band`s Standard Deviation, 1 and 1.5 and 2 if the current lowest price is bigger then 1 stdev and current closed is bigger then 1.5 stdev and the last,highest price is above 2.0 stdev, it defined current market is bullish and had momentum.
and the Short will entered when ma60 and ma120 is undercrossed it work as prevent current price is way lower then entry price.
**this script is working in 15min Only in BTC market or USDT**
** basic equity setting is 500$, set your own**
**if you will use this in real-trade,plz comment the result to me**
Ps: i wanna know why my script is only working well in 15 min tick, anyone who has similar phenomenon or if you had a answer about it, please comment me.

Arch1tect's New Toy (Strategy Tester Version)Description:
The version of Arch1tect's New Toy indicator with Strategy Tester added.
This indicator tries to predict market trends by simply utilising 2 moving averages crossovers.
How it works:
Buy signals are triggered when the faster MA crosses over the slower MA from the downside to the upside.
Sell signals are triggered when the faster MA crosses under the slower MA from the upside to the downside.
How to use:
Take buys when buy signal is triggered AND close existing sell position
Take sells when sell signal is triggered AND close existing buy position
Note:
Settings are optimised for XAUUSD on the M1 chart.
Extra:
Alerts are included.
You can toggle between EMA, WMA and SMA to your liking.
Indicator version:

SirSeff's EMA RainbowThis strategy uses divergences between three exponential moving averages and their slope directions as well as crosses between the price and these moving averages to switch between a long or short position. The strategy is non-stop in the market and always either long or short.\
This trend trading strategy uses exponential moving averages of 10, 20, 50, 100, 150, 200 to gauge the price action cycle if it is on Stage 2 aka Mark up famously coined by Dr.Wykcoff.
It opens a position when the closing price crosses above the 10ema and all the exponential moving averages are stacked up together. Stacked-up Moving averages are used by Mark Minervini and Oliver Kell.
I close a position at an 8% trailing stop from the opened position which makes the succeeding buy orders as scaling up or averaging up from an established bullish trend.
All trading involves high risk; past performance is not necessarily indicative of future results. Hypothetical or simulated performance results have certain inherent limitations. Unlike an actual performance record, simulated results do not represent actual trading. Also, since the trades have not actually been executed, the results may have under-or over-compensated for the impact, if any, of certain market factors, such as lack of liquidity. Simulated trading programs in general are also subject to the fact that they are designed with the benefit of hindsight. No representation is being made that any account will or is likely to achieve profits or losses similar to those shown.

GEMA-Estrategia por neil-------------------
DESCRIPTION
GEMA-STRATEGY is a strategy generator based on SMA, EMA, WMA, RMA that considers elements such as ADX, DMI, RSI, stochastic, Stoploss, Takeprofit, angles and values at present point.
HOW DOES IT WORK
The component works as an assistant to which you configure the previous elements and you see the performance that it offers you, in such a way that you pass that configuration to GEMA-INDICATOR so that you can receive alerts and do visual trading with notifications or automated trading by sending messages to platforms like 3Commas.
WHY USE IT
The resource operates with one of the most important strategies in the market, which is the price tracking line, which means that if prices go up, we follow it, if prices go down, we follow it; in this way you do not need to make large investments as is often the case with pure BOTs, which require large reserves for security orders.
HOW TO USE IT
Press the "Indicators" option, go to the "Public Library" segment, write the name "GEMA-Estategia por Neil", double click on the record in question and you will have it added in your work panel, now, it only remains to use it and configure its parameters.
-------------------
DESCRIPCIÓN
GEMA-ESTRATEGIA en un generador de estrategias basado en SMA, EMA, WMA, RMA que considera elementos como ADX, DMI, RSI, Estocastico, Stoploss, Takeprofit, ángulos y valores a punto presente.
COMO FUNCIONA
El componente funciona como un asistente al que vas configurando lo elementos anteriores y vas viendo el rendimiento que te ofrece, de manera tal, que pases esa configuración a GEMA-INDICADOR para que puedas recibir alertas y hagas trading visual con notificaciones o trading automatizado enviando mensajes a plataformas como 3Commas.
POR QUÉ USARLO
El recurso opera con una de las estrategias mas importantes del mercado, que es la linea de seguimiento de precio, lo que significa que si los precios suben, lo seguimos, si los precios bajan, lo seguimos; de esta manera no necesita realizar grandes inversiones como suele ocurrir con los BOT puros, que exigen grandes reservas para las ordenes de seguridad.
COMO USARLO
Presione la opción "Indicadores", ubíquese en el segmento "Libreria Publica", escriba el nombre "GEMA-Estrategia por Neil", haga doble clic sobre el registro en cuestión y lo tendrá agregado en su panel de trabajo, ahora, solo resta usarlo y configurar sus paramertos.

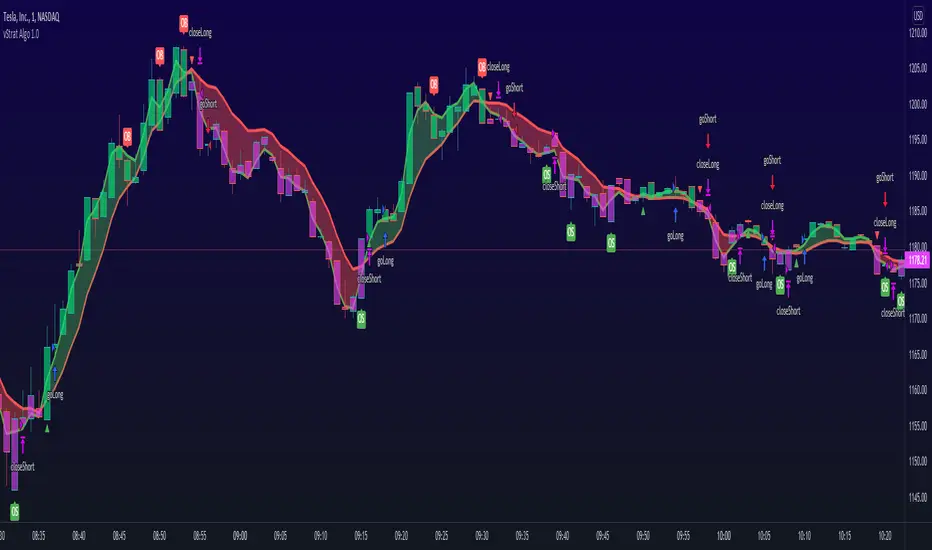
vStrat Algo 1.0 (BETA)vStrat Algo 1.0
The Very First Scalping/Intraday Trading Algo for Options
Note: If you have any favorite indicators that you use regularly and are helpful, feel free to use them in conjunction to this strategy.
Legend:
long = buy call
short = buy put
close entry = sell call/put
BULL = bullish engulfing
BEAR = bearish engulfing
OS = oversold
OB = overbought
Instructions:
1. You can choose to watch the 3 minute or 5 minute chart but be aware of the Pro’s and Con’s. It’s not recommended to use this strategy on the 1 minute chart, but this works on higher timeframes. Keep in mind that the signals will vary on each timeframe.
3 minute 5 minute
i.ibb.co i.ibb.co
2. It’s best to use this strategy right at market open. If a “long” (buy CALLS) or “short” (buy PUTS) signal was given at pre-market, I do not recommend taking it. Only take signals once the market opens. If you really wish to take the signal that was given 1-5 minutes before the market opened, you most definitely can, but its’s just riskier. What I would do is, wait 3-10 minutes after market open and if one Moving Average is respecting the other and holding above or below it, you can enter especially if the blow is bullish, the vStrat Algo 1.0 will also tell you if the candles are bearish or bullish. Use your best judgement.
i.ibb.co [
3. You do not have to wait for the exit signal, everyone's risk management is different so take profits whenever you're green or hold as long as the short-term MA is still trending above or below the long-term MA and is not touching or bouncing off it.
i.ibb.co
4. Avoid taking any signals from 11:30 AM ET - 2:30 PM ET, when stocks are trading sideways since the algo’s stop losses get triggered here due to the low volume.
i.ibb.co
5. Lastly, there is no magic indicator or strategy, this algorithm is designed based on multiple conditions. Each signal gets triggered when ALL the conditions are met. This strategy is based off advanced moving averages, one that reduces lag and responds quicker than the simple and exponential ones, RSI value, S/R, pivot points, and a few others. I’m always looking for ways to improve this scalping algorithm so rest assured any complaints or suggestions will be taken and fixed as timely as possible. For best results, avoid trading with your emotions. If you’re a new user, open a small position, set a stop loss, and let the algorithm decide how you will trade it for that day. Keep doing this until you get more familiar with the script then slowly increase your position sizing, but do not invest money you can’t afford to lose. Play with the settings, change the lengths if you wish, but the script was created to provide the most accurate signals as it is. If you do decide to change these inputs, the signals will also be different. Take profits whenever you see fit, the goal is to have a green day and grow your account slowly but surely. If you make a profit, do not risk giving your money back to the market by overtrading. Always do your own due diligence and use your best judgement. Good luck, Traders!
DISCLAIMER : All information found here, including any ideas, opinions, views, predictions, forecasts, commentaries, suggestions, or stock picks, expressed, or implied herein, are for informational, entertainment or educational purposes only and should not be construed as personal investment advice. While the information provided is believed to be accurate, it may include errors or inaccuracies. Conduct your own due diligence or consult a licensed financial advisor or broker before making any and all investment decisions. Any investments, trades, speculations, or decisions made on the basis of any information found on this site, expressed, or implied herein, are committed at your own risk, financial or otherwise.
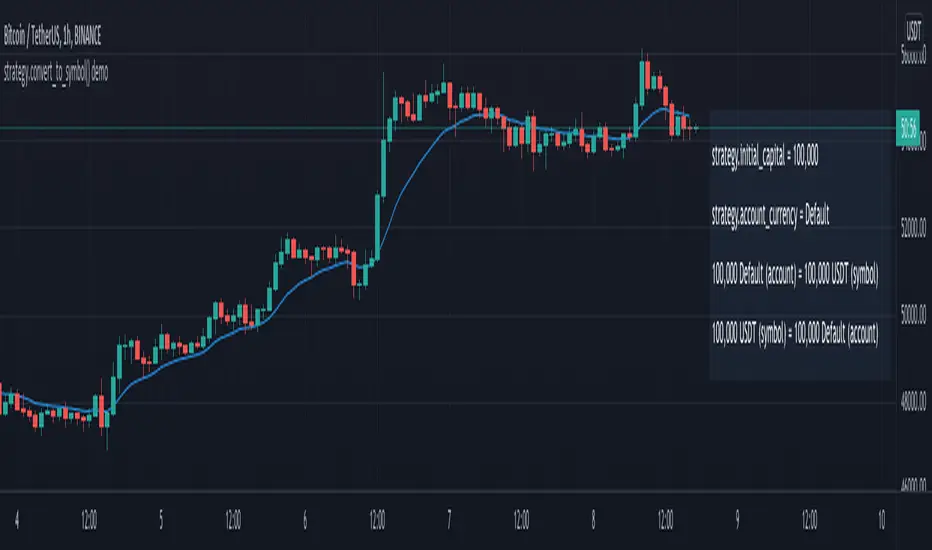
strategy.convert_to_symbol() demoA strategy demonstrating the new strategy.convert_to_symbol() and strategy.convert_to_account() functions introduced in Pine v5.
Try selecting a custom "Base Currency" under Properties to see how the conversion works.
Note: The conversion functions seem to work as expected on BTCUSD, but not on BTCUSDT. This is likely because USDT is not recognized as a currency.
[astropark] Trend Skywalker V2 [strategy]Dear Followers,
today I'm glad to present you Trend Skywalker V2 , the evolution of Trend Skywalker V1 indicator that you can see here below:
This indicator works on every timeframe and market, it's quite responsive to market movements, so it's especially good on volatile markets.
In this new version you have 3 trend clouds available :
a short-term one (yellow)
a mid-term one (green)
a long-term one (blue)
You can also enable an option to show all trend clouds as one, the result will be similar to a special bollinger bands tool.
Of course you can edit trend clouds analysis period and color, also you can turn on or off the cloud that you prefer.
The indicator can run 4 different kinds of strategy : one for each trend cloud individually or a mixed one.
Also the indicator tracks for you a peak profit from entry: this tracker is a suggestion for you to take profits while price goes up!
All red-green circles you see in the chart is a reminder that a peak profit label was there in the past: what does this tell you?
if price starts losing the short-term trend and you had a lot of TP suggestions, maybe trend ended and you should start consider closing your trade before you give back all your profit.
On backtesting you can you test long and short setups individually or both, as well as performance in a specific time window.
This is a premium indicator , so send me a private message in order to get access to this script.

Volume and Moving average,will this model working in real-trade?i`ve recently made this script through few month,understand me if there are some incorrect grammar or something.
basically this script is based on moving average strategy and the bollinger bands
if the buy volume is bigger than sell volume,also buy volume is bigger then daily average volume than it`s defined current market is bullish and entered(of course there is some other conditions)
the exit condition is find the highest price after entered,keep refresh the highest price through time and then,if the current price is ?%lower then highest price,it will closed the position.
my question is this : 1 this model will working in real-trade?
2 why the winning rate is 100%?
- i`ve coded if the position margin over -10%,close the position this code isn`t work? or the other profit line is prevent that happened?
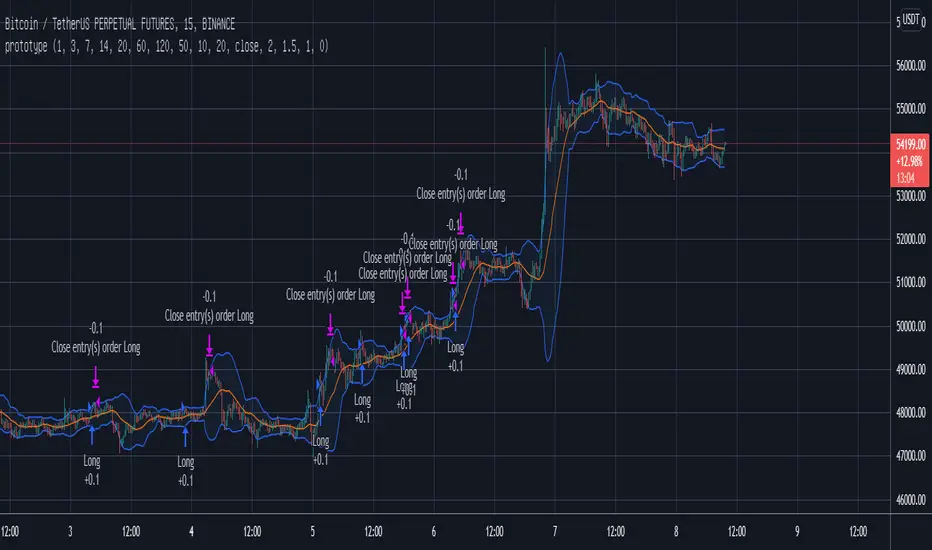
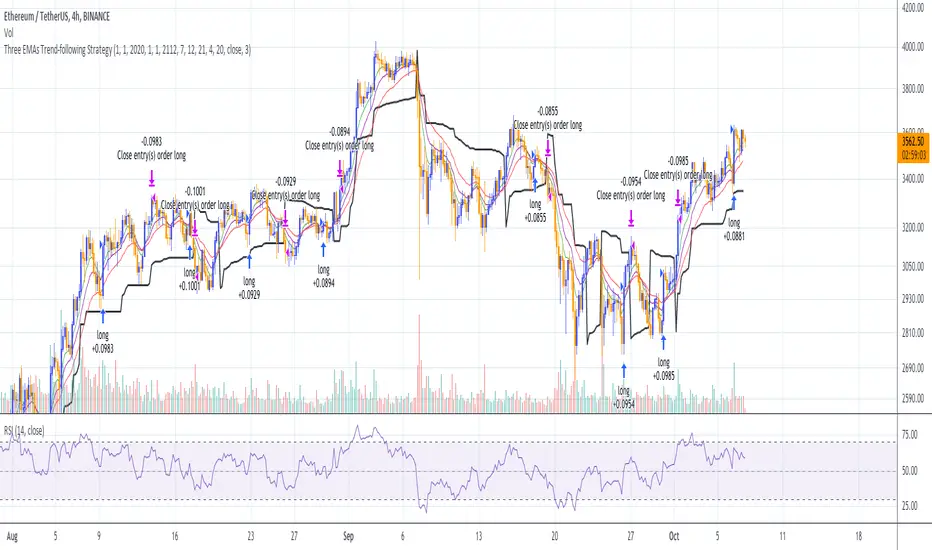
Three EMAs Trend-following Strategy (by Coinrule)Trend-following strategies are great because they give you the peace of mind that you're trading in line with the market.
However, by definition, you're always following . That means you're always a bit later than your want to be. The main challenges such strategies face are:
Confirming that there is a trend
Following the trend, hopefully, early enough to catch the majority of the move
Hopping off the trade when it seems to have run its course
This EMA Trend-following strategy attempts to address such challenges while allowing for a dynamic stop loss.
ENTRY
The trading system requires three crossovers on the same candle to confirm that a new trend is beginning:
Price crossing over EMA 7
Price crossing over EMA 14
Price crossing over EMA 21
The first benefit of using all three crossovers is to reduce false signals. The second benefit is that you know that a strong trend is likely to develop relatively soon, with the help of the fast setup of the three EMAs.
EXIT
The strategy comes with a fixed take profit and a volatility stop, which acts as a trailing stop to adapt to the trend's strength. That helps you get out of the way as soon as market conditions change. Depending on your long term confidence in the asset, you can edit the fixed take profit to be more conservative or aggressive.
The position is closed when:
The price increases by 4%
The price crosses below the volatility stop.
The best time frame for this strategy based on our backtest is the 4-hr. Shorter timeframes can also work well, although they exhibit larger volatility in their returns. In general, this approach suits medium timeframes. A trading fee of 0.1% is taken into account. The fee is aligned to the base fee applied on Binance, which is the largest cryptocurrency exchange.
You can execute this strategy on your favourite exchange at coinrule.com
AMRS_LongOnly_PartTimerThis Script is created to back-test the data starting 01/01/2000 based on AMRS strategy.
AMRS is long only strategy. It is based on unique calculation around moving averages and 2 year high price.
There are few strategies for moving average crossovers but AMRS strategy is unique compared to other moving averages strategies as it has very specific below mentioned calculations evolving around moving average and stock price.
AMRS strategy is unique one to generate buying signals when stock price creates new 2 year high and retraces back to 13 day EMA value.
AMRS strategy is unique one having specific calculation for entry signal and exit signal as mentioned below. This strategy gives back testing results to help build conviction on entry/exits if trades were taken in past as per the AMRS rules.
As per AMRS strategy this script generates green arrow on each time when new 2 year high is made and also generates long signal indicated by white arrow when stock price retraces back to 13 day EMA value and price is within 10% range from 2 year high.
This strategy will generate white arrow on the chart for each buy signal when stock price reaches 13 day EMA after first Long signal is generated. These subsequent buy signals can be used for pyramiding.
Entry Signal Logic : 1. Stock should be trading near 2 year high.
2. Stock price should be within 10% range from 2 year high
3. Stock price should be less than or equal to 13 day EMA and grater than equal to 21 day EMA
This AMRS strategy also generates exit signal for already generated buy signal (open position).
Exit signal generated when stock price closes 5% below 21 day EMA or when stock price closes below 20% from most recent 2 year high price.
Exit Signal Logic : 1. Stock price closes 5% below 21 day EMA or stock price closes below 20% from most recent 2 year high price.
2. Since exit logic is based on closing price it is plotted on the chart next day.
3. So when exit signal is plotted on the chart, previous days stock price is either closed below 5% of 21 day EMA or corrected 20% from recent 2 year high.
Note : To Calculate last entry positions % return, by default all positions are getting closed on mentioned end date.
Script parameters :
start date as 01/01/2000 - Constructed from Start Year - 2000, Start Month - 1 Start Date - 1
End date (mostly current date) Constructed from Values in End Year, End Month, End Date.
Initial Capital - Defaulted to 100000
Order Size - 5% of Equity
Pyramiding - 3 orders
Commission - 0.2%
Slippage - 1 tick (Since this strategy exit is on close basis mostly there wont be any slippages)

3x Supertrend and Stoch RSIBased on the strategy if Trade pro "HIGHEST PROFIT Triple Supertrend Trading Strategy Proven 100 Trade Results"
Your entry long signal will show when two of the three supertrend are green and the stochastic rsi cross up and the candle is above the ema
Your entry short signal will show when two of the three supertrend are red and the stochastic rsi cross down and the candle is below the ema
You can change the settings of the three supertrend and the stochastic rsi
