DCA Bot v7 - Cryptosa Nostra 1.0Technical Overview: Adaptive RSI DCA Bot
This is a sophisticated DCA (Dollar Cost Averaging) indicator designed for accumulating assets and managing portfolio distribution. It does not trade on simple RSI crosses. Instead, it combines multi-zone RSI analysis with ATR-based volatility triggers to execute staggered, dynamically-sized trades.
Its core feature is a "learning" engine that adapts its own settings over time. This "brain" can be trained on historical data and then applied to your real-time portfolio holdings via a "Live Override" feature.
Core Logic: How It Works
A trade is only executed when two conditions are met simultaneously:
The RSI Condition: The RSI must be inside one of the four pre-defined zones.
The Price Condition: The price must cross a "trigger line" (the green or red line) that is dynamically calculated based on volatility.
1. The Four RSI Zones
This script uses four distinct zones to determine the intent to trade:
Deep Buy Zone (Default: RSI <= 35 & Downtrend): This is the primary "value" buy signal. It only activates if the RSI is deeply oversold and the price is below the 200-period Trend MA.
Reload Buy Zone (Default: RSI 40-50 & Uptrend): This is a "buy the dip" signal. It looks for minor pullbacks during an established uptrend (price above the 200-period Trend MA).
Profit-Taking Zone (Default: RSI 70-80): Triggers a standard, small sell when the market is overbought.
Euphoria Zone (Default: RSI >= 80): Triggers a larger, more aggressive sell during extreme "blow-off" tops.
2. Dynamic Trade Sizing
The amount to buy or sell is not fixed. It scales dynamically based on how high or low the RSI is:
Buy Sizing: Spends a higher percentage of available cash when RSI is at its lowest (e.g., 35) and a smaller percentage when it's at the top of the reload zone (e.g., 50).
Sell Sizing: Sells a smaller percentage of holdings when RSI just enters the overbought zone (e.g., 70) and a much larger percentage when it's in the euphoria zone (e.g., 80+).
3. The "Adaptive Brain" (ATR Multipliers)
This is the script's learning mechanism. The green/red trigger lines are calculated as: Last Trade Price +/- (ATR * Multiplier).
This "Multiplier" is the brain. It adapts based on trade performance.
After a successful trade (as defined by profit_target_multiplier), the bot gets more confident and reduces the multiplier. This places the next trigger line closer to the price, making it more aggressive.
After a losing trade (as defined by loss_limit_multiplier), the bot gets more cautious and increases the multiplier. This places the next trigger line further away, making it more patient.
How to Use This Indicator
This script is designed to be "trained" on historical data to provide relevant signals for today.
To Train the Brain: In the settings, go to "1. Backtest Settings". Set the "Start Date (For Learning)" to a date in the past (e.g., 6 months or 1 year ago). The script will run a simulation from that date, allowing its Adaptive Multipliers (the "brain") to adjust to the market's volatility.
To See Live Signals: In "2. Live Portfolio Override", check the box "Override Backtest Balance?" and enter your real current coin and USD holdings.
Result: The "Live Status" table (top-right) will now display signals from the trained brain but will calculate the "Potential Buy %" and "Potential Sell %" based on your real portfolio. The "Buy Multi" and "Sell Multi" fields show you the brain's current learned values.
Hareketli Ortalamalar

SMC Lite + PVSRA + MA Combo HELL 1great trading tool what you see is what you get supply and resistance pvsra candles

DTC - 1.3.6 DTC Trading ClubDTC – 1.3.6 | Advanced Multi-Timeframe Trend & Algo Trading System
Version: 1.3.6
Platform: TradingView
Category: Trend Following | Algo Automation | EMA-Based System
⚙️ 1. Algo Trading Integration (NEW FEATURE)
The DTC 1.3.6 system bridges TradingView charts and MT4/MT5 execution through PineConnector for full trade automation.
This allows signals generated by the indicator to instantly execute trades on your broker account using your unique Trading UID.
Purpose & Justification:
Many traders rely on chart-based strategies but struggle with delayed manual execution. The Algo module removes this limitation by automating execution directly from the chart while retaining full user control. This makes it particularly useful for systematic traders who want precision, consistency, and hands-off operation.
Key Features:
🔑 Trading UID Input: Enter your PineConnector UID (e.g., 88888999) for authenticated trade routing.
📊 Auto-Formatted Trade Message: All signals are converted into PineConnector-ready format:
88888999, buy, EURUSD, risk=0.01, comment=DTCAlgoMT4/MT5
⚙️ Full Customization: Users decide every aspect of execution — direction, position risk, TP/SL handling, signal triggers, comments, and automation level.
Practical Example:
If a Bullish EMA alignment occurs on EURUSD while the ATR filter confirms valid volatility, the Algo instantly sends a buy order to MT4/MT5 with all trade parameters defined in TradingView — enabling disciplined, automated execution without delay.
Requirements:
TradingView paid plan (for webhook automation)
PineConnector account (free tier supported)
Once connected, the DTC system becomes a fully autonomous trading solution, handling entries, exits, and TP/SL management in real-time.
📈 2. Multi-Timeframe Trend Dashboard
This feature provides an at-a-glance overview of market bias across key timeframes (1H–Monthly), powered by the EMA 30 vs EMA 60 trend structure.
Purpose & Justification:
Instead of switching between multiple charts, traders can instantly see the dominant market direction across all major timeframes. This prevents counter-trend trades and encourages entries that align with broader market momentum.
Dashboard Highlights:
Customizable position (top/bottom left/right)
Adjustable text size for clarity
Displays active trend for 1H, 4H, Daily, Weekly, and Monthly
Shows Unrealized PnL of the current open position
Displays ATR Filter Status (Active/Inactive with color coding)
Practical Example:
A trader sees a Bullish signal on the 1H chart, but the dashboard shows Bearish trends on higher timeframes — indicating possible short-term pullback rather than a trend reversal. This cross-timeframe awareness improves decision quality.
💹 3. EMA Trend System
At the core of DTC lies a 6-layer EMA engine (30–60) designed to identify strong, sustained market trends with minimal lag.
Logic:
Bullish: EMA 30 > 35 > 40 > 45 > 50 > 60
Bearish: EMA 30 < 35 < 40 < 45 < 50 < 60
Purpose & Justification:
Unlike simple two-EMA systems, this multi-layer method filters out temporary volatility and confirms trend stability before triggering signals. It forms the foundation upon which all other modules (signals, dashboard, algo, and volatility filter) operate.
🚦 4. Buy/Sell Signal Engine
Signals are automatically generated when EMA layers achieve full alignment — a clear confirmation of market direction change.
Conditions:
🟢 Buy Signal: Bearish/Neutral → Bullish alignment
🔴 Sell Signal: Bullish/Neutral → Bearish alignment
Signals appear as chart markers and can trigger PineConnector automation.
Purpose & Justification:
This systematic approach removes emotional decision-making and allows traders to execute only when objective technical conditions are met. It ensures that trades align with verified EMA-based momentum, not short-term price noise.
🎯 5. Dynamic TP/SL and Entry Visualization
Every trade signal comes with a structured plan:
Entry, Stop-Loss, and seven Take-Profit levels
Accurate price labels and color-coded zones
Customizable SL modes: Tiny, Small, Mid, or Large
Purpose & Justification:
Visual clarity is vital for risk control. The indicator presents all levels directly on the chart, so traders instantly see potential reward-to-risk scenarios and manage trades with confidence. These levels also integrate seamlessly with PineConnector automation for direct execution.
📊 6. ATR Volatility Filter
The ATR (Average True Range) module filters low-quality setups during flat or choppy markets.
Mechanics:
Adjustable ATR period and multiplier
Filters weak signals when volatility drops below threshold
Purpose & Justification:
ATR adds a volatility-based confirmation layer to the EMA logic. For instance, if EMAs align but ATR volatility is below the active threshold, no trade is executed — reducing false signals during quiet sessions. When ATR exceeds the threshold, trades are allowed, improving accuracy and overall system efficiency.
Example:
During a ranging session on GBPUSD, EMAs may align briefly, but low ATR prevents a false breakout entry. Once volatility returns, the same logic allows a valid trade — demonstrating how ATR integrates into the system to maintain trade quality.
🎨 7. EMA Cloud Visualization
The EMA Cloud fills the area between EMA 30 and EMA 60 to visualize momentum strength and transitions.
🟩 Green cloud → Bullish bias
🟥 Red cloud → Bearish bias
Purpose & Justification:
This feature provides immediate visual cues for traders to identify trend continuation or potential reversal zones. It reinforces the EMA Trend System, ensuring that market structure and momentum remain visually synchronized.
🧭 8. Full Customization Control
DTC 1.3.6 allows traders to tailor every aspect of their experience:
Enable/disable components such as Algo, Dashboard, TP/SL, and Cloud
Modify color themes, layouts, and text sizes
Adjust to suit manual or automated trading preferences
Purpose & Justification:
Different traders have different workflows. By allowing total flexibility, DTC can adapt to short-term scalping, swing trading, or long-term automation setups without performance compromise.
✅ Summary
DTC 1.3.6 is a professional-grade, multi-layer trading system that integrates EMA-based trend detection, volatility filtering, dashboard visualization, and algo automation into one cohesive tool.
Each module contributes to a unified goal — identifying high-probability market conditions, confirming them through volatility, and executing with precision.
This system is Invite-Only because it represents a complete, ready-to-deploy professional framework — not a single indicator — and requires responsible use of automation features that directly impact live trading accounts.
DTC = Smart Visuals + Total Control + True Automation.
⚠️ Disclaimer
This indicator is for educational and research purposes only.
The DTC Team, developers, and affiliates do not provide financial advice and assume no responsibility for profits or losses from its use.
Trading involves substantial risk.
Past performance is not indicative of future results.
Users should test thoroughly on demo accounts, perform independent analysis, and consult a licensed financial advisor before live trading.
By using this tool, you acknowledge that all actions are taken at your own risk and that the DTC Team bears no liability for any outcomes.

FMDT_EMAXMACD_SCALPINGFCPO M3 trend-following strategy with automatic BUY/SELL alerts. Suitable for intraday trading.

Bitcoin AHR999 Indicator
AHR999 Indicator
The AHR999 Indicator is created by a Weibo user named ahr999. It assists Bitcoin investors in making investment decisions based on a timing strategy. This indicator implies the short-term returns of Bitcoin accumulation and the deviation of Bitcoin price from its expected valuation.
When the AHR999 index is < 0.45 , it indicates a buying opportunity at a low price.
When the AHR999 index is between 0.45 and 1.2 , it is suitable for regular investment.
When the AHR999 index is > 1.2 , it suggests that the coin price is relatively high and not suitable for trading.
In the long term, Bitcoin price exhibits a positive correlation with block height. By utilizing the advantage of regular investment, users can control their short-term investment costs, keeping them mostly below the Bitcoin price.

Average Price BUY-SELL_Bulent-V2Tracking prices that you have defined and trigger the crossing of them

Smoothed VWAP Bands + EMAsSmoothed VWAP bands
With my script, you take the raw standard deviation and apply an EMA (exponential moving
Advantages:
1. Less noise:
* The bands don’t jump around with every tiny price spike.
* Makes it easier to judge real price extremes.
2. Better zone visualization:
* Inner and outer bands are smoother and more visually “stable.”
* Easier to see meaningful trends, support/resistance, and breakout zones.
3. Fewer fakeouts:
* Traders can filter out small false signals because smoothed bands only move when volatility actually changes.
4. Dynamic to volatility:
* EMA smoothing keeps the bands adaptive:
* In quiet periods, bands tighten.
* In volatile periods, bands expand.
* But it avoids extreme jitter caused by every micro-move.
Safe Zone Rules
1. Long entries (green zone):
* Price above VWAP (trend bullish).
* Price inside inner band ±1σ (not touching outer extremes).
* Optional: candle close confirmation (price fully above inner band).
2. Short entries (red zone):
* Price below VWAP (trend bearish).
* Price inside inner band ±1σ.
* Optional: candle close confirmation.
3. Outer bands (±2σ):
* Considered overextended zones → avoid entries to reduce fakeouts.
4. Visual cues:
* Safe zones shaded lightly green/red inside inner band.
* Outer bands remain unshaded (for context).
Here’s a cheat sheet for trading the Smoothed VWAP Bands + EMAs that shows safe entry zones and trend alignment clearly.
Smoothed VWAP Bands + EMAs Cheat Sheet
Price Action Relative to Bands & EMAs
+2σ (Outer Upper Band)
----------------
Extreme volatility zone
Avoid entries here
+1σ (Inner Upper Band)
----------------
Safe zone limit for longs
Consider profit taking here
VWAP Line (Green = Bullish, Red = Bearish)
==================
Core trend indicator
Only trade in VWAP trend direction
-1σ (Inner Lower Band)
----------------
Safe zone limit for shorts
Good for entries in trend direction
-2σ (Outer Lower Band)
----------------
Extreme volatility zone
Avoid entries here
1️⃣ Trend Direction with VWAP & EMAs
* VWAP → shows the overall session trend.
* Price above VWAP → bullish
* Price below VWAP → bearish
* EMA 5 (blue) → short-term momentum
* EMA 20 (orange) → medium-term trend
Rule: Only take trades in the direction of the trend:
* Long trades → price > VWAP and EMA 5 > EMA 20
* Short trades → price < VWAP and EMA 5 < EMA 20
This prevents chasing trades against the trend and reduces fakeouts.
2️⃣ Entry Zones Using Smoothed VWAP Bands
* Inner band (±1σ) → “safe entry zone”
* Outer band (±2σ) → volatility extremes → avoid entries here
Rule: Enter longs inside the inner band above VWAP and shorts inside the inner band below VWAP.
Best used on intraday timeframes.
15, 5, 2, 1 min charts.

Normalised Volume Oscillator [BackQuant]Normalised Volume Oscillator
A refined evolution of the Klinger Volume Oscillator, rebuilt for clarity, precision, and adaptability. This tool normalizes volume-driven momentum into a bounded scale so you can easily identify shifts in accumulation and distribution across any asset or timeframe, while keeping readings comparable between markets.
What this indicator does
The Normalised Volume Oscillator quantifies the balance between buying and selling pressure using the Klinger Volume Oscillator (KVO) as its base, then rescales it dynamically into a normalized range between -0.5 and +0.5. This normalization allows traders to interpret relative strength and exhaustion in volume flow, rather than dealing with raw unbounded values that differ across symbols.
It is a momentum-volume hybrid that reveals the strength of trend participation: when buyers dominate, normalized readings rise toward +0.5; when sellers dominate, they fall toward -0.5. The midline (0) acts as an equilibrium between accumulation and distribution.
Core components
Klinger Volume Oscillator: The foundation of this indicator, combining volume with price trend direction to measure long-term money flow relative to short-term movement.
Normalization process: The raw KVO is scaled over a user-defined Normalisation Period , computing `(KVO - lowest) / (highest - lowest) - 0.5`. This centers all readings around zero, allowing overbought/oversold detection independent of asset volatility or volume magnitude.
Signal moving average: The normalized KVO is smoothed with a user-selectable moving average type—SMA, EMA, DEMA, TEMA, HMA, ALMA, and others. This becomes the signal line for confirmation of trend direction or mean-reversion setups.
How it works conceptually
1. The KVO detects when volume supports price movement (bullish) or diverges from it (bearish).
2. The script normalizes the raw KVO so that relative magnitude is consistent—what is “strong buying pressure” looks the same on BTCUSD as it does on AAPL.
3. Overbought and oversold regions are derived statistically, rather than from arbitrary values, based on percentile zones around ±0.4 and ±0.5.
4. The oscillator is optionally combined with a moving average to help identify crossovers, momentum shifts, and divergence confirmation.
How to interpret it
Above 0: Indicates dominant buying pressure and likely continuation of upward momentum.
Below 0: Suggests dominant selling pressure and potential continuation of downward movement.
Crosses of 0: Often mark transitions between accumulation and distribution phases.
+0.4 to +0.5 zone: Overbought region where buying intensity is stretched; watch for deceleration or divergence.
[-0.4 to -0.5 zone: Oversold region indicating panic or exhaustion in selling.
Signal-line crossover: A traditional momentum confirmation method; when the normalized KVO crosses above its moving average, buyers regain control, and vice versa.
Why normalization matters
Typical volume oscillators are asset-specific—what is considered “high” volume for one symbol is not the same for another. By dynamically normalizing KVO values within a rolling lookback, this version transforms raw amplitude into a standardized scale. This means you can:
Compare multiple assets objectively.
Set consistent alert thresholds for overbought/oversold regions.
Avoid misleading interpretations from absolute oscillator values.
Customization and UI
Moving Average Type & Period: Select your preferred smoothing method (SMA, EMA, TEMA, etc.) and adjust its period to tune sensitivity.
Normalisation Period: Defines how many bars the KVO range is measured over; shorter periods adapt faster, longer ones smooth more.
Visual Toggles:
* Show Oscillator : enables or hides the core histogram.
* Show Moving Average : adds a smoothed overlay for signal confirmation.
* Paint Candles : optional color overlay for chart candles based on oscillator direction.
* Show Static Levels : displays ±0.4 and ±0.5 zones for overbought/oversold boundaries.
How to use it
Trend confirmation: Use midline (0) crossovers as confirmation of emerging trend shifts—cross above 0 suggests a new bullish phase, cross below 0 a bearish one.
Reversal spotting: Look for normalized readings reaching ±0.5 and flattening, or diverging against price extremes.
Divergence analysis: When price makes a new high but the normalized oscillator fails to, it signals waning buying conviction (and vice versa for lows).
Multi-timeframe integration: Works best alongside higher timeframe trend filters or moving averages; normalization makes this consistent.
Alerts
Prebuilt alert conditions allow quick automation:
Midline crossovers (0): transition between accumulation and distribution.
Overbought (+0.4) and Oversold (-0.4) triggers for potential exhaustion.
Signal moving-average crosses for confirmation entries.
Tips for use
Combine with price structure—don’t fade every overbought/oversold reading; confirm with break of structure or candle patterns.
Use longer normalization periods for position trading, shorter for intraday analysis.
In choppy markets, treat 0-line oscillations as noise filters, not trade triggers.
Summary
The Normalised Volume Oscillator modernizes the classic Klinger Volume Oscillator by normalizing its readings into a standardized range. This makes it more adaptive across assets and timeframes, improves interpretability, and provides intuitive, data-driven overbought/oversold levels. Whether used standalone or as a confirmation layer, it offers a clearer view of volume dynamics—revealing when markets are truly being accumulated, distributed, or stretched beyond their sustainable extremes.

TrendX Amila Bro
TrendX Fib + RSI Divergence is a modern trend-following + confluence-based trading tool designed to reduce false signals and improve accuracy.
It combines EMA crossover , RSI momentum , Fibonacci retracement zones , and RSI divergence to provide high-quality BUY/SELL signals.
---
🔥 Core Features
### ✅ 1. Trend Detection (EMA 9/21 by default)]
The script identifies trend shifts using fast and slow EMAs.
* BUY when Fast EMA crosses above Slow EMA + RSI confirmation
* SELL when Fast EMA crosses below Slow EMA + RSI confirmation
These are the Base Signals — always shown.
---
### ✅ 2. Fibonacci Confluence Filter (Optional)
Signals become stronger when price pulls back into key Fib zones:
* 0.5 retracement
* 0.618 golden ratio
This helps avoid chasing late entries and improves accuracy in trend pullbacks.
---
### ✅ 3. RSI Divergence Filter (Optional)
Detects both:
* Bullish Divergence → BUY
* Bearish Divergence → SELL
When divergence agrees with EMA trend shift, a Filtered BUY+/SELL+ signal is shown.
---
### ✅ 4. Two Types of Signals
✔ BUY / SELL
Base signals from EMA + RSI (appears even if filters are OFF)
✔ BUY+ / SELL+
Strong signals using
* EMA Trend
* RSI Confirmation
* Fibonacci Confluence
* RSI Divergence
These are rare but extremely high-probability entries.
---
### ✅ 5. Visual Elements
* EMAs
* Fibonacci 50% & 61.8% levels
* Divergence markers
* BUY / SELL arrows
* BUY+ / SELL+ arrows for filtered confluence entries
---
### ✅ 6. Alerts Included
You can set TradingView alerts for:
* BUY+ (strong long signal)
* SELL+ (strong short signal)
Great for mobile/Telegram alerts.
---
## 🎯 How Traders Use This
* Scalping (1m, 5m)
* Intraday (15m, 30m, 1H)
* Swing trading (4H, 1D)
Works on **Forex, Crypto, Indices, Metals, Stocks**.
---
## ⚠️ Disclaimer
No indicator guarantees 100% accuracy.
Always combine with proper risk management and market context.
---
## ⭐ Ideal For:
* Trend traders
* Pullback traders
* Divergence traders
* Anyone wanting cleaner, filtered BUY/SELL signals
---


2-Stage Dashboard (SQZPRO Wide + EMA)Dashboard for Darvas Box EMA momentum traders, located in the bottom right, mostly for quickly screening if a setup is viable.
- EMAs are 9 & 21
- SQZPRO set to wide squeezes
Long setup:
- Green SQZPRO row
- Green EMA row
Short setup:
- Green SQZPRO row
- Red EMA row

FMDT SCALPINGFCPO M3 trend-following strategy with automatic BUY/SELL alerts. Suitable for intraday tradinG.

FMDT SCALPINGFCPO M3 trend-following strategy with automatic BUY/SELL alerts. Suitable for intraday trading

EntryXpert 1.2Pullback Detection Logic - The scanner now waits for price to pull back and touch the Fast EMA within a specified number of bars (default 10) after the initial crossover . Entry only triggers when price bounces back in the trend direction after touching the EMA .
Automatic 1:2 Risk-Reward Calculation - Stop-loss is calculated using ATR multiplied by a customizable factor (default 1.5x) . Take-profit is automatically set at exactly 2x the stop-loss distance, giving you your preferred 1:2 risk-reward ratio .
Visual TP/SL Lines - Stop-loss and take-profit levels are plotted as horizontal lines at exact price levels on the chart . Lines automatically disappear when price hits either level, keeping your chart clean .
State Management - The scanner tracks whether it’s waiting for a pullback after a crossover and won’t generate conflicting signals . Entries only fire after confirmed pullback and bounce confirmation, reducing false signals significantly .
Customizable Parameters - Adjust the ATR(Average true range) multiplier to control stop-loss distance based on market volatility . Set the pullback lookback period to match your trading timeframe (default 10 bars)

STEVEN Breakout VWAP (M1/M5/M15)This strategy combines breakout detection, VWAP confirmation, and ATR-based risk management to identify high-probability trading setups.
It automatically generates Long and Short entries when price action breaks key levels and aligns with VWAP direction, providing clear visual signals and automated backtesting capability.
🔍 How It Works
Breakout Detection:
The script identifies when price breaks above recent highs or below recent lows (based on the last 10 candles).
VWAP Confirmation:
A Long signal is generated when price breaks above resistance and stays above VWAP.
A Short signal is generated when price breaks below support and stays below VWAP.
ATR-based Stop Loss & Take Profit:
Stop Loss = 1× ATR (adjustable).
Take Profit = 1.5× risk (Risk/Reward 1:1.5).
Both are calculated dynamically at signal time.
Backtesting Ready:
Fully compatible with TradingView’s Strategy Tester, allowing users to analyze performance, win rate, and profit factors automatically.
🧩 Visual Features
Green triangles below the bars → Long signal.
Red triangles above the bars → Short signal.
Orange VWAP line → confirms trend direction.
⚙️ Inputs
ATR Length and Multiplier
VWAP Display toggle
Stop Loss and Risk/Reward settings
Signal marker size

TASC 2025.12 The One Euro Filter█ OVERVIEW
This script implements the One Euro filter, developed by Georges Casiez, Nicolas Roussel, and Daniel Vogel, and adapted by John F. Ehlers in his article "Low-Latency Smoothing" from the December 2025 edition of the TASC Traders' Tips . The original creators gave the filter its name to suggest that it is cheap and efficient, like something one might purchase for a single Euro.
█ CONCEPTS
The One Euro filter is an EMA-based low-pass filter that adapts its smoothing factor (alpha) based on the absolute values of smoothed rates of change in the source series. It was designed to filter noisy, high-frequency signals in real time with low latency. Ehlers simplifies the filter for market analysis by calculating alpha in terms of bar periods rather than time and frequency, because periods are naturally intuitive for a discrete financial time series.
In his article, Ehlers demonstrates how traders can apply the adaptive One Euro filter to a price series for simple low-latency smoothing. Additionally, he explains that traders can use the filter as a smoothed oscillator by applying it to a high-pass filter. In essence, similar to other low-pass filters, traders can apply the One Euro filter to any custom source to derive a smoother signal with reduced noise and low lag.
This script applies the One Euro filter to a specified source series, and it applies the filter to a two-pole high-pass filter or other oscillator, depending on the selected "Osc type" option. By default, it displays the filtered source series on the main chart pane, and it shows the oscillator and its filtered series in a separate pane.
█ INPUTS
Source: The source series for the first filter and the selected oscillator.
Min period: The minimum cutoff period for the smoothing calculation.
Beta: Controls the responsiveness of the filter. The filter adds the product of this value and the smoothed source change to the minimum period to determine the filter's smoothing factor. Larger values cause more significant changes in the maximum cutoff period, resulting in a smoother response.
Osc type: The type of oscillator to calculate for the pane display. By default, the indicator calculates a high-pass filter. If the selected type is "None", the indicator displays the "Source" series and its filtered result in a separate pane rather than showing the filter on the main chart. With this setting, users can pass plotted values from another indicator and view the filtered result in the pane.
Period: The length for the selected oscillator's calculation.

MTF Checklist DashboardMTF Checklist Dashboard
Overview
The MTF Checklist Dashboard is an advanced multi-timeframe analysis tool that provides traders with a comprehensive visual dashboard to analyze market conditions across six customizable timeframes simultaneously. This indicator combines multiple technical analysis methods, including Opening Range Breakouts (ORB), VWAP, EMAs, and daily price levels, to generate high-probability confluence-based trading signals.
Unlike traditional single-timeframe indicators, this dashboard displays all critical information in one organized table, allowing traders to instantly identify when multiple timeframes align for optimal entry and exit opportunities.
Key Features
Multi-Timeframe Analysis
Analyzes up to 6 timeframes simultaneously (default: 1m, 5m, 15m, 30m, 1h, 4h)
Fully customizable timeframe selection via comma-separated input
Color-coded cells for instant visual recognition (green=bullish, red=bearish, yellow=neutral)
Technical Indicators Tracked
Current and previous candle direction
Opening Range Breakout (ORB) positioning with custom period
VWAP relationship (above/below)
200 EMA positioning
Daily and previous day high/low proximity
EMA crossovers (9 vs 21, both vs 200)
Advanced Signal Filtering System
Confluence scoring: Requires multiple timeframes to align (3-6 timeframes)
Higher timeframe confirmation: Ensures 30m/1h/4h agreement
Volume filter: Confirms signals with above-average volume (1.5x default)
ATR volatility filter: Validates sufficient market movement
Session timing: Restricts signals to optimal trading hours (EST)
Momentum confirmation: Requires recent directional strength
Range positioning: Blocks signals near daily extremes
Candle strength: Validates strong directional candles (60%+ body ratio)
Visual Signals
Optional entry arrows (above/below bars)
Background color highlighting
Organized dashboard with real-time price levels
ORB range, current day, and previous day summary rows
Alert Conditions
JSON-formatted alerts for automated trading integration
Separate alerts for long entry, short entry, long exit, and short exit
Compatible with webhook automation systems
How To Use
Dashboard Interpretation
The dashboard displays a color-coded table with the following columns:
TF: Timeframe being analyzed
C: Current candle (Green=bullish, Red=bearish)
P: Previous candle (Green=bullish, Red=bearish)
ORB: Opening Range Breakout position (A=Above, B=Below, W=Within)
VWAP: Price vs VWAP (A=Above, B=Below)
E200: Price vs 200 EMA (A=Above, B=Below)
D Hi/Lo: Proximity to current day high/low (Hi/Lo/Mid)
PD Hi/Lo: Proximity to previous day high/low (Hi/Lo/Mid)
9 vs 21: EMA 9 vs EMA 21 relationship (A=9 above 21, B=9 below 21)
9&21 v200: Both EMAs vs 200 EMA (>>=both above, <<=both below, <>=mixed)
Signal Generation
Long Entry Signal triggers when:
Minimum number of timeframes show bullish alignment (default: 5 of 6)
Higher timeframes (30m/1h/4h) confirm direction (default: 2 of 3)
Price breaks above ORB high with sufficient distance
Volume exceeds average by specified multiplier
ATR shows adequate volatility
Trade occurs during optimal session hours
Recent momentum is upward
Price not too close to daily high
Strong bullish candle forms
Short Entry Signal uses opposite conditions
Exit Signals trigger when opposing timeframe confluence reaches threshold (default: 3 timeframes)
Recommended Workflow
Select your asset and primary trading timeframe
Observe the dashboard - Look for rows showing mostly green (bullish) or red (bearish)
Wait for alignment - The indicator will show arrows when confluence requirements are met
Check the bottom rows - Review ORB levels and daily ranges for context
Set alerts - Enable TradingView alerts using the built-in alert conditions
Manage risk - Use appropriate position sizing and stop losses based on ORB range or daily ATR
Settings Guide
Basic Settings
Timeframes: Enter comma-separated values (e.g., "1,5,15,30,60,240")
Show Header: Toggle column headers on/off
ORB Minutes: Set opening range period (default: 15 minutes)
Near % for daily highs/lows: Define proximity threshold (default: 0.20%)
Use close for comparisons: Compare using close vs current price
Dashboard Position: Choose from 9 screen positions
Confluence Filters
Minimum Timeframes Aligned: Set required confluence (3-6, default: 5)
Require Higher Timeframe Confirmation: Toggle HTF requirement on/off
Min Higher Timeframes: Specify HTF agreement needed (1-3, default: 2)
Volume Filter
Volume Confirmation: Enable/disable volume filtering
Volume vs Average: Set multiplier threshold (default: 1.5x)
Volume Average Length: Period for volume average (default: 20 bars)
Volatility Filter (ATR)
Volatility Filter: Enable/disable ATR confirmation
ATR Length: Calculation period (default: 14)
Min ATR vs Average: Required ATR level (default: 0.5x = 50%)
ORB Filters
ORB Breakout Distance Required: Toggle distance requirement
Min Breakout % Beyond ORB: Additional breakout threshold (default: 0.10%)
Session Filter
Trade Only During Best Hours: Enable time-based filtering
Session 1: First trading window (default: 0930-1130 EST)
Session 2: Second trading window (default: 1400-1530 EST)
Momentum Filter
Recent Momentum Required: Enable directional momentum check
Lookback Bars: Period for momentum comparison (default: 3 bars)
Daily Range Filter
Block Signals Near Daily Extremes: Prevent entries at extremes
Distance from High/Low %: Minimum distance required (default: 2.0%)
Candle Filter
Strong Directional Candle: Require candle strength
Min Candle Body %: Body-to-range ratio threshold (default: 60%)
Visual Signals
Show Entry Signals: Master toggle for visual signals
Show Arrows: Display entry arrows on chart
Background Color: Enable background highlighting
Best Practices
Start with default settings and adjust based on your trading style and asset volatility
Higher confluence requirements (5-6 timeframes) produce fewer but higher-quality signals
Enable all filters for conservative trading; disable some for more frequent signals
Use the dashboard as confirmation alongside your existing trading strategy
Backtest on your specific instruments before live trading
Consider market conditions—trending vs ranging markets may require different settings
Alerts
This indicator includes four alert conditions with JSON formatting for webhook integration:
Long Entry Signal: Triggers when all long conditions are met
Short Entry Signal: Triggers when all short conditions are met
Long Exit Signal: Triggers when opposing confluence reaches exit threshold
Short Exit Signal: Triggers when opposing confluence reaches exit threshold
Alert messages include ticker symbol, action (buy/sell), price, and quantity for automated trading systems.
Important Notes
This indicator works best on liquid instruments with clear price action
Highly volatile markets may require adjusted ATR and ORB distance settings
Session times are in EST timezone—adjust if trading non-US markets
The ORB calculation requires sufficient price history for the day
Signals are generated in real-time but should be confirmed at candle close
Limitations
Maximum of 6 timeframes can be analyzed due to TradingView's security call limits
ORB calculations may not work correctly on instruments with gaps or irregular sessions
The indicator is most effective during regular market hours when volume and volatility are adequate
Lower timeframes (1m, 5m) may produce more false signals in choppy conditions
License
Mozilla Public License 2.0 (MPL-2.0)
This indicator is licensed under the Mozilla Public License 2.0. You are free to use, modify, and distribute this code under the terms of the MPL-2.0. The full license text is available at mozilla.org
Key license provisions:
You may use this code commercially
You may modify and distribute modified versions
Modified versions must be released under the same license
You must include the original license notice in any distributions
No trademark rights are granted
Disclaimer
This indicator is provided for educational and informational purposes only. It is not financial advice, and past performance does not guarantee future results. Trading involves substantial risk of loss. Always:
Practice proper risk management
Test thoroughly on paper/demo accounts before live trading
Use appropriate position sizing
Never risk more than you can afford to lose
Consult with a financial advisor for personalized advice
The creator assumes no liability for trading losses incurred using this indicator.
Version: 2.0
Pine Script Version: v6
Author: © EliasVictor

Buy/Sell Hull Crossover Signals (Fast & Slow)This indicator generates buy and sell signals using fast- and slow-period Hull Moving Averages (HMAs). A bullish signal occurs when the fast HMA crosses above the slow HMA, while a bearish signal triggers when it crosses below. To reduce repainting, you can optionally require confirmation on bar close.
The script includes visual tools such as a color-shifting ribbon between HMAs, optional background shading to show market regime, and lightweight buy/sell labels for quick signal recognition. Alerts are built in so you can automate notifications when crossover conditions occur.
Designed to be simple, responsive, and easy to layer into existing strategies, this indicator helps traders spot momentum shifts and trend transitions with clarity.

5 Moving Averages – Custom Trend Colors + No Neutral Mode5 Moving Averages Pro – Custom Trend Colors + No Neutral Mode
The cleanest and most professional 5-MA bundle on TradingView.
Features:
• 5 fully customizable moving averages (period + type: SMA, EMA, WMA, HMA, VWMA)
• All 5 MAs instantly change color based on global trend:
– Green → price above ALL 5 MAs (strong bullish)
– Red → price below ALL 5 MAs (strong bearish)
– Optional neutral gray (or completely disable neutral mode)
• Fully customizable bullish, bearish and neutral colors
• Optional background coloring (very light & clean)
• Trend change arrows (only on real bullish/bearish confirmation)
• "No Neutral" mode → forces green/red even in sideways markets (price vs average of the 5 MAs)
Perfect for:
• Trend-following systems
• Clean chart setups
• Scalping, day trading & swing trading
• Confirming institutional bias
Zero repainting | Super lightweight | Works on all timeframes & markets
One of the most loved multi-MA indicators worldwide. Join 250K+ traders already using it daily!

Multiple EMA 5/13/26Multiple EMS's. 5-13-26. 3 EMA's at one place. Easy to use. Helps a lot in chart reading.

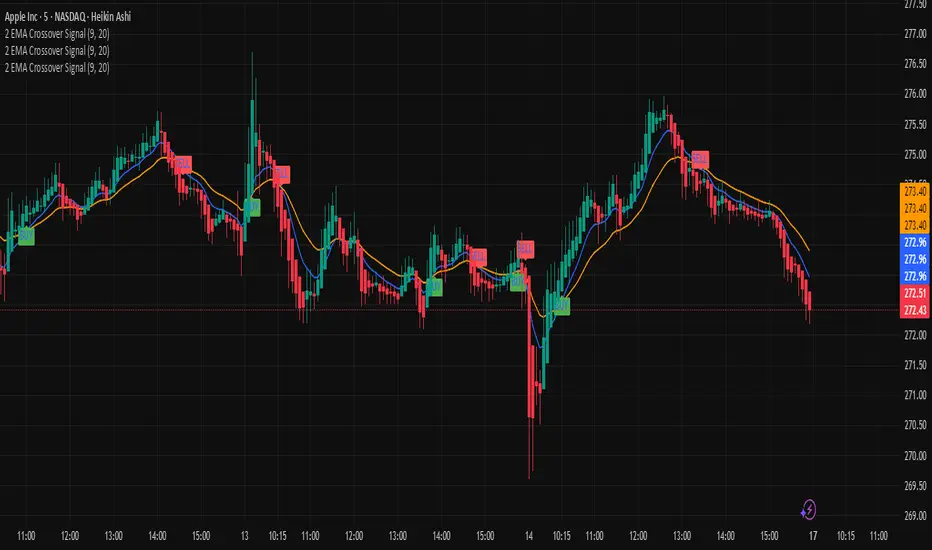
2 EMA Crossover Signal. Paid Version2 EMA Crossover Signal. Indicator comes with alert and EMA can be changed by user. Default EMA is 9/20
The 2 EMA Crossover Signal is a powerful, easy-to-use technical indicator designed to help traders identify potential trend reversals and momentum shifts with precision. By combining two Exponential Moving Averages (EMAs) of different lengths, this indicator highlights moments when the market may be transitioning from bearish to bullish conditions—or vice versa. These crossover points often signal the beginning of new trends, making them highly valuable for traders looking to enter or exit positions with confidence.
This tool continuously monitors the relationship between the fast EMA and the slow EMA. When the fast EMA crosses above the slow EMA, it generates a bullish signal, suggesting upward momentum and a potential buying opportunity. Conversely, when the fast EMA crosses below the slow EMA, it issues a bearish signal, indicating downward pressure and a possible selling or shorting opportunity.
The 2 EMA Crossover Signal is ideal for traders of all experience levels and works effectively across multiple timeframes—whether you're day trading, swing trading, or analyzing long-term trends. It helps simplify market noise, provides cleaner trend direction, and enhances decision-making by giving visually clear signals on your chart. With its straightforward behavior and consistent performance, this indicator is a must-have for anyone looking to trade with more structure, discipline, and clarity.
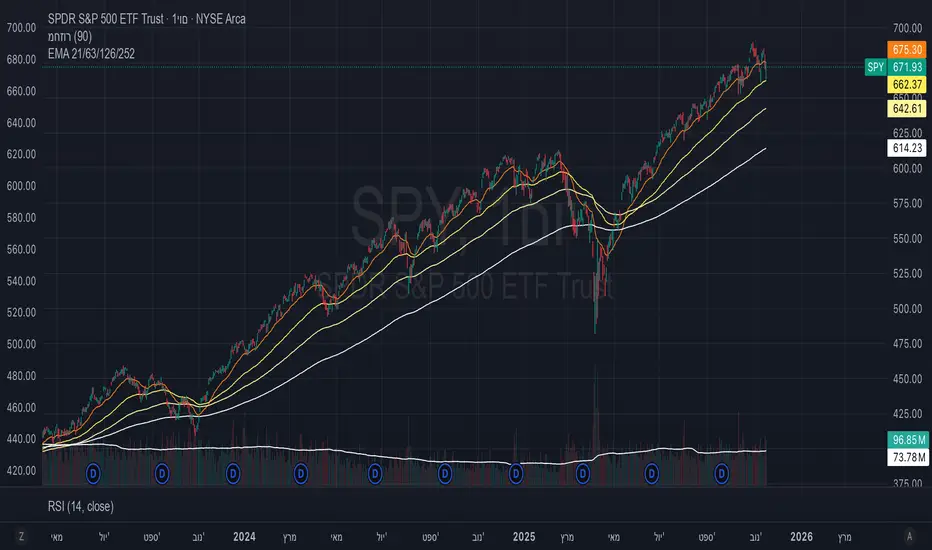
EMA 21/63/126/252Moving averages by the actual trading days in a month, quarter, half a year and a year.