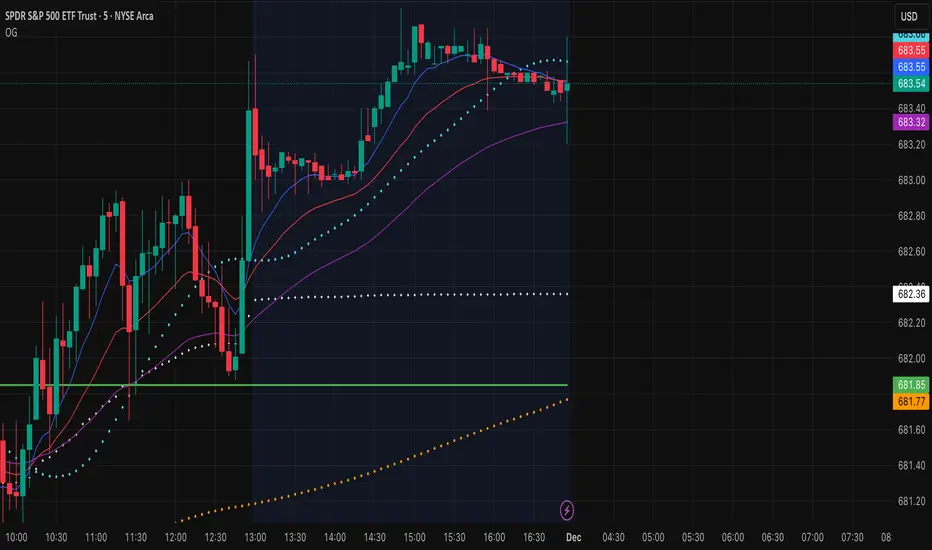
OG INDICATORTrade Legacy All-in-One Institutional Indicator
Unlock institutional-grade trading with this comprehensive Pine Script indicator. Seamlessly integrates multiple EMAs, SMAs, VWAPs, and ORB displays into one effortless panel—mimicking pro standards for quick, intuitive analysis.
Per Trade Legacy (Jackie): "This is the only indicator you need for profitability." Pair it with your strategy for powerful confluence, boosting edge and profits.
Simple setup, zero clutter. Premium access via invite-only.
Hareketli Ortalamalar
5-Day SMAPine Script v5 indicator that plots a 5-day Simple Moving Average with configurable styling options:
Features:
5-Day SMA: Calculates the simple moving average of the closing price over 5 periods
Configurable Line Color: Choose any color for the line through the settings
Configurable Line Style: Select between Solid, Dashed, or Dotted lines
Line Width: Adjustable from 1 to 5 pixels
The SMA will automatically adjust to your chart's timeframe - whether you're viewing 1-minute, 1-hour, daily, or any other timeframe, it will calculate the moving average over the last 5 periods of that timeframe.

EMAs Bullish/Bearish Confluence [Trend Bias]EMA Confluence Zones
This indicator is designed to simplify trend identification by visually highlighting "Confluence Zones" —areas where short-term, medium-term, and long-term momentum are fully aligned.
While traders can manually add three Moving Averages to a chart, identifying the exact moment all three align (the "Perfect Stack") can be visually difficult during live trading. This script automates that process, converting complex line crosses into simple background color zones and providing actionable alerts for the exact moment a trend alignment begins.
🛠 How It Works
The script utilizes three customizable Exponential Moving Averages (EMAs) to detect the market bias:
Short EMA: Represents immediate price action/momentum.
Medium EMA: Represents the intermediate trend.
Long EMA: Represents the major trend baseline.
Calculations & Logic
The indicator checks for a specific hierarchical alignment (Stacking) of these averages:
1. 🟢 Bullish Confluence (Buy Zone):** Returns true when `Short > Medium` AND `Medium >Long`. This confirms that momentum is rising across all three monitored timeframes.
2. 🔴 Bearish Confluence (Sell Zone):** Returns true when `Short < Medium` AND `Medium < Long`. This confirms that momentum is falling across all three monitored timeframes.
3. ⚪ Neutral (No Color): Any other state indicates a choppy or consolidating market where the EMAs are intertwined.
---
🚀 Key Features
*Visual Bias Confirmation: The background highlights Green (Bullish) or Red (Bearish) only when the "Perfect Stack" conditions are met.
Trend Start Alerts: Unlike standard EMA cross alerts, this script includes custom alert conditions that trigger only on the first bar where the confluence becomes valid. This prevents spam alerts during a prolonged trend.
Full Customization: Users can adjust the lengths of all three EMAs to fit specific strategies (e.g., Scalping vs. Swing Trading).
Clean Chart Mode: Includes options to hide the EMA lines entirely and rely solely on the background color for a minimalist "Naked Trading" setup.
🎯 How to Use
1. Trend Filter: Use the background color to determine your directional bias. If the background is Green, look only for Long setups on lower timeframes. If Red, look only for Short setups.
2. Breakout Confirmation: If price breaks a key level, wait for the background color to flip. This confirms that the Moving Averages have caught up to the move, validating the breakout strength.
3. Exit Signal: If you are in a trend trade and the background color disappears (turns transparent), it indicates the trend momentum is fading and the EMAs are beginning to cross/compress.
⚙️ Settings
EMA Lengths: Default is 20, 50, 100. These can be changed to common combinations like (9, 21, 55) or (50, 100, 200).
Visuals: Toggle lines or background colors on/off and adjust transparency to keep your chart readable.
---
Disclaimer: This script is for informational purposes only. Past performance of a trend following method does not guarantee future results. Always use proper risk management.

The Magic MAOverview
The Magic MA is a smart, adaptive trend-following indicator designed to simplify market structure into a single, highly intuitive visual system. It blends multiple dynamic trend signals into one composite output — giving traders a clean view of momentum, direction, and overall trend health at a glance.
Instead of juggling multiple moving averages, The Magic MA condenses them into a unified scoring model that updates in real-time, highlighting when the market is strong, weakening, or about to shift.
How It Works
Powered by a proprietary algorithm, The Magic MA analyzes trend direction and momentum using three core concepts:
- Trend Slope — Are trends strengthening or losing steam?
- Market Positioning — Is price aligned with the dominant direction?
- Relative Trend Structure — Are short-term dynamics supporting or contradicting the larger move?
These components combine into a 0–100 trend score, continuously recalculated to reflect the live market environment.
The system adapts based on volatility and trend consistency — more responsive during strong moves, smoother when markets get noisy.
What You See
The Magic MA Line
A smoothed, adaptive trend baseline:
Green when upward momentum dominates
Red when downward momentum prevails
The Trend Fill
A color-graded zone that reveals trend strength:
Bright Green — Strong uptrend, momentum expanding
Green — Bullish bias, healthy trend
Orange — Neutral / transition zone
Red — Bearish conditions, momentum negative
The fill not only shows direction — its thickness can help gauge conviction in current price movement.
Trend Score Display
A clean scoreboard panel showing current trend strength (0–100) to support quick decision-making.
How To Use It
Trend Bias
Score > 70 → High-probability bullish environment
Score 50–70 → Favor long setups
Score 30–50 → Caution — market may be reversing or consolidating
Score < 30 → Bearish environment — avoid longs or consider shorts
Signal Concepts
Bullish trigger → Score rising above the midline with the Magic MA turning green
Bearish trigger → Score falling below the midline with the Magic MA turning red
Momentum exits → Trend score pulling back from extremes
Best Practices
Align trades with the trend fill direction
Use score shifts to confirm breakouts or reversals
Validate setups with structure levels (S/R, swing highs/lows)
Credits
Core logic draws inspiration from recognized adaptive trend research and digital signal processing techniques, including the work of Kaufman and Ehlers. Code by Alex Orekhov (everget) and LuxAlgo.

Sabitri GuideIndicator - "Sabitri Guide"
It's a colaboration of more than one Indicator.
Applicable for all sectors.
Just follow the signal.
After appear "Buy" signal when next green candle crosses high and close to the signal candle then active buy.
And after appear "Sell" signal when next red candle crosses low and close to the signal candle then active sell.

Vantage-X (2.0)Vantage-X (2.0) — The Clean-Chart Trading Dashboard
Vantage-X (2.0) is a next-generation, all-in-one chart optimization dashboard designed for traders who want clarity, precision, and zero clutter. Whether you scalp, day trade, or swing trade, this indicator removes the noise and gives you the exact market signals that matter, all from one clean, minimal interface.
Built for traders who are tired of overcrowded charts filled with lines, clouds, bands, and unnecessary indicators, Vantage-X (2.0) brings everything together into a powerful visual dashboard — so you can focus on price action, not distraction.
⸻
🔹 What’s New in Version 2.0
Vantage-X (2.0) adds several high-value trend-tracking systems to improve timing, confirmation, and momentum detection:
• EMA 50 / EMA 200 Cross
A classic long-term momentum and directional bias filter.
Perfect for identifying macro trend shifts or avoiding trades against the dominant trend.
• EMA 20 / EMA 50 Cross
A medium-term trend confirmation system used by professional intraday traders to time pullbacks, continuations, and structure-based setups.
• EMA 5 / EMA 13 Cross
A fast-reaction signal for sudden bursts of volatility.
Ideal for scalpers catching early momentum, breakouts, retests, and reversal flips.
All three systems come with full toggles, so you can enable or disable any layer depending on your style.
All three EMA Crosses work on the current timeframe you are looking at.
⸻
🔹 Core Purpose
The purpose of Vantage-X is simple:
Give traders a clean, powerful dashboard that replaces multiple indicators — without ever touching the price chart.
No more overlapping lines.
No more stacked indicators taking up screen space.
No more analysis paralysis.
Just fast, easy, intuitive signals displayed in a compact table so you can instantly read the market’s story.
⸻
🔹 Features
✔ Ultra-clean dashboard layout (does not clutter your chart)
✔ Trend direction & EMA cross signals
✔ Color-coded bias detection (bullish, bearish, neutral)
✔ Adjustable toggle system for full customization
✔ Works on all markets & timeframes
✔ Designed for scalpers, day traders, and swing traders
✔ Perfect for traders who rely on price action but still want smart confirmation
⸻
🔹 Why Traders Love It
Vantage-X is built for the modern trader — the type who values simplicity, clarity, and speed. Every feature in this dashboard is made to:
• Reduce hesitation
• Improve timing
• Simplify decision-making
• Keep charts visually clean
• Remove emotional noise
• Increase confidence in entries and exits
If you want a chart that stays clean but still gives high-precision market signals, Vantage-X is built for you.
⸻
🔹 Free to Use — For the Trading Community
Vantage-X (2.0) is completely free.
No paywalls. No locked features.
This release is my contribution to traders who want a cleaner, more efficient way to interpret the market without relying on a dozen indicators layered on top of each other.
⸻
🔹 Final Notes
Vantage-X (2.0) is continuously evolving, and future versions will bring even more flexibility, signal refinement, and dashboard intelligence. Feedback is always welcomed — I want this to be one of the most useful and clean charting tools available on TradingView.
🔥 {COMING SOON: You will be able to set different timeframes for each EMA cross Signal. So if you are looking at 5min timeframe but you want to know 15min 20/50 EMA cross. You will be able to adjust that in settings. SO NO SWITCHING BACK AND FORTH BETWEEN DIFFERENT TIMEFRAME CHARTS!!} 🔥

Shock Wave EMA Ribbon.29 ema and 21 ema script, with background plot. All colors, and settings toggle on and off. Simple but effective.

Shock Wave 9/21 EMA Ribbon9 ema and 21 ema script, with background plot. All colors, and settings toggle on and off. Simple but effective.

DarkPool's Gann High Low Activator DarkPool's Gann High-Low Activator.
It enhances the traditional trend-following logic by integrating Heikin Ashi smoothing, Multi-Timeframe (MTF) analysis, and volatility filtering. It is designed to filter out market noise and provide clearer trend signals during volatile conditions.
Underlying Concepts
Heikin Ashi Smoothing: Standard price candles can produce erratic signals due to wicks and short-term volatility. This script includes a "Calculation Mode" setting that allows the Gann logic to run on Heikin Ashi average prices. This smoothes out price data, helping traders stay in trends longer by ignoring temporary pullbacks.
Gann High-Low Logic: The core algorithm tracks the Simple Moving Average (SMA) of Highs and Lows over a user-defined period.
Bullish Trend: Price closes above the trailing SMA of Highs.
Bearish Trend: Price closes below the trailing SMA of Lows.
Volatility & Trend Filtering: To reduce false signals during sideways markets, this tool employs two filters:
ADX Filter (Choppiness): Uses the Average Directional Index to detect low-volatility environments. If the ADX is below the defined threshold (default 20), the indicator identifies the market as "choppy" and suppresses signals to preserve capital.
EMA Filter (Baseline): An optional Exponential Moving Average filter ensures trades are only taken in the direction of the longer-term trend (e.g., Longs only above the 200 EMA).
Features
Dual Calculation Modes: Switch between Standard price logic and Heikin Ashi smoothing logic.
Multi-Timeframe (MTF): Calculate the trend based on a higher timeframe (e.g., 4-Hour) while viewing a lower timeframe chart (e.g., 15-Minute).
Automated JSON Alerts: Generates machine-readable JSON alert payloads compatible with external trading bots and webhooks.
Live Dashboard: A data table displaying the current Trend State, Calculation Mode, ADX Value, and risk percentage.
How to Use
Buy Signal: Generated when the trend flips Bullish, provided the ADX indicates sufficient momentum and the price satisfies the EMA filter (if enabled).
Sell Signal: Generated when the trend flips Bearish, subject to the same momentum and trend filters.
Neutral State (Gray Cloud): When the cloud fill turns gray, the market is in consolidation. It is recommended to avoid entering new positions during this state.
Trailing Stop: The Gann Line serves as a dynamic trailing stop-loss level. A close beyond this line invalidates the current trend.
Settings Configuration
Calculation Mode: Select "Standard" for raw price action or "Heikin Ashi" for smoothed trend following.
Gann Length: Lower values (3-5) are suitable for short-term scalping; higher values (10+) are better for swing trading.
MTF Mode: Enable to lock the calculation to a specific higher timeframe.
ADX Threshold: Adjust based on asset volatility. Recommended: 20-25 for Crypto, 15-20 for Forex/Indices.
Disclaimer
This source code and the information presented here are for educational purposes only. This script does not constitute financial advice, trading recommendations, or a solicitation to buy or sell any financial instruments. Trading in financial markets involves a high degree of risk and may not be suitable for all investors. Past performance is not indicative of future results. The author assumes no responsibility for any losses incurred while using this indicator. Use this tool at your own discretion and risk.

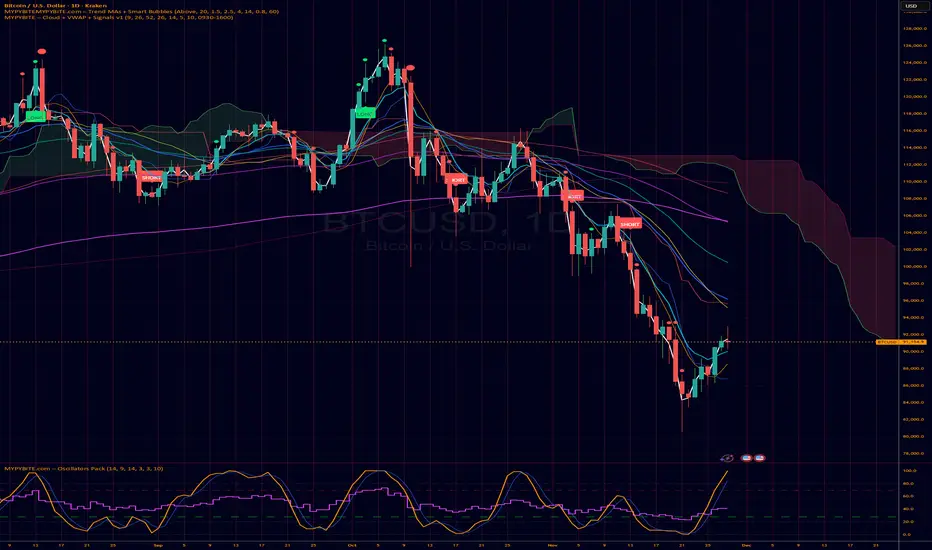
MYPYBiTE.com – Cloud + VWAPFor Bitcoin we found that the 3 day chart consistently indicates a pattern that anyone can back test and determine the trend confirmation is broken. Of course we won't tell you here what it is because you have to do the work or be familiar with the communities I participate in.
We decided to make this available because we realized many folks do not incorporate cloud charting. This is to help noobies and we hope to incorporate other factors in time.
10/20 EMA 50/100/200 SMA — by mijoomoCreated by mijoomo.
This indicator combines EMA 10 & EMA 20 with SMA 50/100/200 in one clean package.
Each moving average is toggleable, fully labeled, and alert-compatible.
Designed for traders who want a simple and effective multi-MA trend tool.

50-Week EMA & 100-Week MA (any TF)50-Week EMA & 100-Week MA
EMA 50W retains your stepline style.
MA 100W uses a normal smooth line (you can change style to stepline if you want).
Works on any timeframe — weekly calculation

Gold Master: Swing + Daily Scalp (Fixed & Working)How to use it correctly
Daily chart → Focus only on big green/red triangles (Swing trades)
5m / 15m / 1H chart → Focus on small circles (Scalp trades)
You can turn each system on/off independently in the settings
Works perfectly on XAUUSD, GLD, GC futures, and even DXY (inverse signals).

𝐃𝐀𝐑𝐊 - 𝐓𝐄𝐑𝐌𝐈𝐍𝐀𝐋 🥷✅ DARK TERMINAL™ — Adaptive Liquidity & Trend Intelligence System
A multi-layered market analysis framework for professional traders
DARK TERMINAL™ is an advanced, all-in-one market intelligence system designed to help traders interpret market structure, trend pressure, and liquidity zones with exceptional clarity. Built with a hybrid logic of dynamic trend mapping and liquidity-based zones, this indicator assists traders in quickly understanding real-time directional bias, potential reversal areas, and high-probability continuation zones.
This system is engineered to simplify complex price behavior into clean, actionable visual layers — making it suitable for scalpers, intraday traders, and swing traders.
🔥 Core Components
1. Trend Cloud Mapping
The multi-shade trend cloud automatically adapts to momentum direction and volatility shifts.
It highlights real-time:
Bullish / Bearish phases
Transitional zones
Momentum compression areas
Potential breakout conditions
2. Dynamic Support & Resistance Levels
Automatically plotted zones update in real time and act as:
Liquidity reaction points
Smart breakout & breakdown levels
Trend continuation confirmation zones
3. Auto Buy/Sell Pressure Markers
The system identifies key price behavior shifts such as:
Momentum weakening
Liquidity grabs
Exhaustion zones
Reversal signals
These markers are NOT signals, but help visualize directional pressure.
4. Price Flow Ribbon (Midline Engine)
The mid-structure ribbon shows micro-trend behavior:
Price stability
Short-term reversal intention
Trend smoothing
Entry refinement zones
5. Algorithmic Zone Identification
Smart zone labeling automatically identifies:
Support zones
Resistance zones
Reaction clusters
Consolidation pockets
Useful for planning entries, exits, and risk levels.
🎯 How Traders Typically Use DARK TERMINAL™
Scalpers: Use micro trend shifts + support/resistance zones
Intraday traders: Use trend cloud direction + pressure markers
Swing traders: Use liquidity zones + structural transitions
Risk managers: Use dynamic volatility zones for stop placement
DARK TERMINAL™ is created to complement any existing trading strategy or work as a standalone market-reading toolkit.
📘 Important Notes
The Buy/Sell markers represent algorithm-detected behavioral shifts, not guaranteed trading signals.
Support/Resistance zones represent liquidity reactions, not fixed market levels.
Trend clouds adjust based on volatility, so shades may vary with market conditions.
⚠️ Disclaimer :
This indicator is provided strictly for educational and informational purposes only. Nothing in this tool, including but not limited to Buy/Sell markers, support/resistance labels, clouds, or any visual elements, should be interpreted as financial advice, trading signals, invitations to invest, or recommendations to buy or sell any instrument.
Trading and investing involve substantial risk, including the possible loss of capital. Market behavior is unpredictable, and past visual patterns or indicator behavior do not guarantee future performance. The developer of this script does not guarantee accuracy, profitability, or performance of this indicator and is not liable for any losses, damages, or decisions made based on the information displayed.
Users are solely responsible for their own trading decisions and must perform independent research, apply proper risk management, and consult a licensed financial advisor if necessary. By using this indicator, you agree that all trades you take are fully at your own risk.

MTC – Multi-Timeframe Trend Confirmator V2MTC – Multi-Timeframe Trend Confirmator V2
A comprehensive trend analysis indicator that systematically combines six technical indicators across three customizable timeframes, using a weighted scoring system to identify high-probability trend conditions.
ORIGINALITY AND CONCEPT
This indicator is original in its approach to multi-timeframe trend confirmation. Rather than relying on a single indicator or timeframe, it creates a composite score by evaluating six different technical conditions simultaneously across three timeframes. The scoring system weighs certain indicators more heavily based on their reliability in trend identification. The visual gauge provides an at-a-glance view of trend alignment across timeframes, making it easier to identify when multiple timeframes agree - a condition that typically produces stronger, more reliable trends.
HOW IT WORKS - DETAILED SCORING METHODOLOGY
The indicator evaluates six technical conditions on each timeframe. Each condition contributes to a composite score:
EMA 200 (Weight: 1 point)
Bullish: Price closes above EMA 200 (+1)
Bearish: Price closes below EMA 200 (-1)
Rationale: Long-term trend direction
SMA 50/200 Crossover (Weight: 1 point)
Bullish: SMA 50 above SMA 200 (+1)
Bearish: SMA 50 below SMA 200 (-1)
Rationale: Golden/Death cross confirmation
RSI 14 (Weight: 1 point)
Bullish: RSI above 55 (+1)
Bearish: RSI below 45 (-1)
Neutral: RSI between 45-55 (0)
Rationale: Momentum filter with buffer zone to avoid chop
MACD (12,26,9) (Weight: 1 point)
Bullish: MACD line above signal line (+1)
Bearish: MACD line below signal line (-1)
Rationale: Trend momentum confirmation
ADX 14 (Weight: 2 points - DOUBLE WEIGHTED)
Requires ADX above 25 to activate
Bullish: DI+ above DI- and ADX > 25 (+2)
Bearish: DI- above DI+ and ADX > 25 (-2)
Neutral: ADX below 25 (0)
Rationale: Trend strength filter - only counts when a strong trend exists. Double weighted because ADX is specifically designed to measure trend strength, making it more reliable than oscillators.
Supertrend (Factor: 3.0, ATR Period: 10) (Weight: 2 points - DOUBLE WEIGHTED)
Bullish: Direction indicator = -1 (+2)
Bearish: Direction indicator = +1 (-2)
Rationale: Dynamic support/resistance that adapts to volatility. Double weighted because Supertrend provides clear, objective trend signals with built-in stop-loss levels.
COMPOSITE SCORE CALCULATION:
Total possible score range: -10 to +10 points
Score interpretation:
Score > 2: UPTREND (majority of indicators bullish, especially weighted ones)
Score < -2: DOWNTREND (majority of indicators bearish, especially weighted ones)
Score between -2 and +2: NEUTRAL/RANGING (mixed signals or weak trend)
The threshold of +/- 2 was chosen because it requires more than just basic agreement - it typically means at least 3-4 indicators align, or that the heavily-weighted indicators (ADX, Supertrend) confirm the direction.
MULTI-TIMEFRAME LOGIC:
The indicator calculates the composite score independently for three timeframes:
Higher Timeframe (default: 4H) - Major trend direction
Mid Timeframe (default: 1H) - Intermediate trend
Lower Timeframe (default: 15min) - Entry timing
Main Trend Confirmation Rule:
The indicator only signals a confirmed trend when BOTH the higher timeframe AND mid timeframe scores agree (both > 2 for uptrend, or both < -2 for downtrend). This dual-timeframe confirmation significantly reduces false signals during choppy or ranging markets.
HOW TO USE IT
Setup:
Add indicator to chart
Customize timeframes based on your trading style:
Scalpers: 15min, 5min, 1min
Day traders: 4H, 1H, 15min (default)
Swing traders: Daily, 4H, 1H
Toggle individual indicators on/off based on your preference
Adjust Supertrend parameters if needed for your instrument's volatility
Reading the Gauge (Top Right Corner):
Each row shows one timeframe
Left column: Timeframe label
Middle column: Visual strength bars (10 bars = maximum score)
Green bars = Bullish score
Red bars = Bearish score
Yellow bars = Neutral/ranging
More filled bars = stronger trend
Right column: Numerical score
Trading Signals:
Entry Signals:
Long Entry: Wait for upward triangle arrow (appears when higher + mid TF both bullish)
Confirm gauge shows green bars on higher and mid timeframes
Lower timeframe should ideally turn green for entry timing
Chart background tints light green
Short Entry: Wait for downward triangle arrow (appears when higher + mid TF both bearish)
Confirm gauge shows red bars on higher and mid timeframes
Lower timeframe should ideally turn red for entry timing
Chart background tints light red
Position Management:
Stay in position while higher and mid timeframes remain aligned
Consider reducing position size when mid timeframe score weakens
Exit when higher timeframe trend reverses (daily label changes)
Avoiding False Signals:
Ignore signals when gauge shows mixed colors across timeframes
Avoid trading when scores are close to threshold (+/- 2 to +/- 4 range)
Best trades occur when all three timeframes align (all green or all red in gauge)
Use the numerical scores: higher absolute values (7-10) indicate stronger, more reliable trends
Practical Examples:
Example 1 - Strong Uptrend Entry:
Higher TF: +8 (strong green bars)
Mid TF: +6 (strong green bars)
Lower TF: +4 (moderate green bars)
Action: Look for long entries on lower timeframe pullbacks
Background is tinted green, upward arrow appears
Example 2 - Ranging Market (Avoid):
Higher TF: +3 (weak green)
Mid TF: -1 (weak red)
Lower TF: +2 (neutral yellow)
Action: Stay out, wait for alignment
Example 3 - Trend Reversal Warning:
Higher TF: +7 (still green)
Mid TF: -3 (turned red)
Lower TF: -5 (strong red)
Action: Consider exiting longs, prepare for potential higher TF reversal
Customization Options:
Timeframes: Adjust all three to match your trading horizon
Indicator Toggles: Disable indicators that don't suit your instrument:
Disable RSI for highly volatile crypto markets
Disable SMA crossover for range-bound instruments
Keep ADX and Supertrend enabled for trending markets
Visual Preferences:
Arrow size: 5 options from Tiny to Huge
Gauge size: Small/Medium/Large for different screen sizes
Toggle arrows on/off if you only want the gauge
Alert Setup:
Right-click chart, "Add Alert"
Condition: MTC v6 - UPTREND or DOWNTREND
Get notified when multi-timeframe confirmation occurs
Best Practices:
Use with Price Action: The indicator works best when combined with support/resistance levels, chart patterns, and volume analysis
Risk Management: Even with multi-timeframe confirmation, always use stop losses
Market Context: Works best in trending markets; less reliable in strong consolidation
Backtesting: Test the default settings on your specific instrument and timeframe before live trading
Patience: Wait for full multi-timeframe alignment rather than taking premature signals
Technical Notes:
All calculations use Pine Script's security function to fetch data from multiple timeframes
Prevents repainting by using confirmed bar data
Gauge updates in real-time on the last bar
Daily labels mark at the open of each new daily candle
Works on all instruments and timeframes
This indicator is ideal for traders who want objective, systematic trend identification without the complexity of analyzing multiple indicators manually across different timeframes.
-NATANTIA

Moving Average Ribbon x10his script is a highly customizable Moving Average Ribbon that allows you to plot up to 10 independent Moving Averages (MAs) on your chart simultaneously.
Key Features:
10 Customizable MAs: Configure each of the 10 MAs with unique settings.
5 MA Types: Choose from Simple (SMA), Exponential (EMA), Smoothed (SMMA/RMA), Weighted (WMA), and Volume-Weighted (VWMA) for every line.
Flexible Inputs: Easily adjust the Length, Source (e.g., close), Color, and Visibility for each Moving Average directly from the indicator settings.
Trend Analysis: Use the ribbon to quickly visualize trend strength, potential support and resistance zones, and changes in market momentum based on the spread and order of the MAs.
How to Use:
The first four MAs (MA #1 to MA #4) are enabled by default with common lengths (20, 50, 100, 200). You can enable and customize the remaining MAs (MA #5 to MA #10) in the input settings to build your ideal ribbon setup.

EMA and Swings with volatility-Multi-TF Trend Alerts by cryptdozTraces the EMA 200 and clearly marks all swings highs and lows for easy references. Includes a volatity index (like ADX) and marks the trend on multi time frame (from 1H to 5M) - ideal for scalping to intraday and day trading.

RS-Momentum Score (0–10) — v6 CleanWHAT THIS INDICATOR DOES
This code gives you:
✔ Full 0–10 RS-Momentum scoring system
Trend
Momentum
RS vs Nifty
Volume
✔ BUY / HOLD / SELL signals
BUY = Score ≥ 7
HOLD = 4–6.99
SELL = < 4

ORION Trend Engine by Ali_KamberogluORION Trend Engine by Ali_Kamberoglu | Decode the DNA of a Trend: Adaptive Strength & Direction
Developer: Ali Kamberoğlu
Overview: Go Beyond the Limits of Standard ADX
The ORION Trend Engine (TE) is a complete command center designed to analyze not just the existence of a market trend, but also its strength, direction, acceleration, and potential within a single, integrated system. It was developed to solve the chronic problems of the classic ADX indicator, such as lag, noise, and difficulty in interpretation.
This tool combines two separate panels into one intelligent engine:
Trend Strength Panel: Shows when the market is entering a strong trend or moving sideways.
Directional Bias Oscillator Panel: Clearly visualizes which direction (Buy/Sell) is dominating the trend.
ORION TE provides an analytical framework not just to know if there is a trend, but to decide whether to enter it, when to stay in it, and when to exit.
The ORION Advantage: Why It's Different
1. The Smart Trend Engine (Adaptive KAMA Integration):
The standard ADX uses a slow-reacting average. ORION TE revolutionizes this by offering the option to use the Adaptive KAMA engine in the ADX calculation, which adapts to market conditions. What does this mean?
Faster Response: When a strong trend begins, KAMA speeds up, notifying you of the trend's start much earlier.
Noise Filter: When the market is choppy and indecisive, KAMA slows down, protecting you from countless false "trend start" signals.
2. The Directional Compass (Normalized DI Oscillator):
Interpreting DI+ and DI- lines can be complex. ORION TE solves this problem with the DI Oscillator:
Clear Signals: This oscillator shows the net dominance between Buyers (positive values) and Sellers (negative values).
ADX Filter: The oscillator only generates signals when there is significant trend strength in the market (when ADX is above a certain threshold). This completely eliminates meaningless crossovers in sideways markets.
Strength Indicator: The histogram bars change color based on the trend's strength. Bright colors (Lime/Red) indicate a strong trend, while dark colors (Green/Maroon) signify a weakening trend.
3. Multi-Stage Trend Analysis (Dynamic Levels):
Saying "there is a trend" is not enough. ORION TE analyzes the trend's strength across four different levels:
No Trend (Gray): No direction in the market.
Trend Potential (Yellow): A trend is starting to form, pay attention.
Strategic Trend (Blue): The main trend with sufficient strength for trading.
Strong & Peak Trends: Zones where the trend is at its strongest, but may also show signs of exhaustion.
High-Probability Trading Strategies:
Strongest BUY Signal (Trend Ignition):
The ADX line turns from Yellow to Blue (Strategic Trend Begins).
Simultaneously, the DI Oscillator histogram is in positive territory and crosses above its white signal line.
This is an A+ grade entry opportunity, confirming both trend strength and buyer momentum.
Strongest SELL Signal (Trend Ignition):
The ADX line turns Blue.
Simultaneously, the DI Oscillator histogram is in negative territory and crosses below its white signal line.
This is a strong downtrend initiation signal, as sellers take control.
Important Visual Notice
The Signal line (white) and some level lines in the indicator are designed for optimal visibility on dark-themed charts.
If you are using a light-themed (white) chart background, these white elements may not be visible. For the best experience, you have two options:
Recommended: Set your chart background to a dark color in TradingView's settings.
Alternative: Go into the indicator settings, and under "5. Visual Settings," change the color of the DI Oscillator (Signal) line and other white levels to a darker color that contrasts with your chart.
Disclaimer
This indicator is a professional analysis tool developed to assist in your trading decisions. No signal or analysis constitutes investment advice. Trading in financial markets involves high risk, and past performance is not a guarantee of future results. Please always apply your own risk management strategies.

ORION Fast Momentum Engine by Ali_KamberogluORION Fast Momentum Engine by Ali_Kamberoglu | Reinventing RSI: Adaptive Signals & Auto Divergences
Developer: Ali Kamberoğlu
Overview: Escape the Noise of Standard RSI
The ORION Fast Momentum Engine (FME) is an all-in-one analytical powerhouse that takes the classic RSI indicator and redesigns it for 21st-century market conditions. It is engineered to eliminate the biggest problems of the standard RSI: false signals, lag, and noise. This tool not only shows you the momentum but also automatically reveals its character, its volatility, and, most importantly, when it's diverging from the price.
ORION FME is not just another oscillator; it's an intelligent analysis engine built into the RSI.
The ORION Advantage: Why It's Different
The power of ORION FME comes from three revolutionary layers it adds to the standard RSI:
Layer 1 - The Smart Signal Line (Adaptive KAMA Integration):
Fixed-period moving averages are a thing of the past. ORION FME uses the Adaptive KAMA engine as its signal line, which adjusts to market conditions. When the market is trending, it speeds up to give you early signals. When the market is choppy and sideways, it slows down, protecting you from countless false trades (whipsaws). No more "blind" signal lines that behave the same way in every condition.
Layer 2 - Momentum Volatility (Bollinger Bands on RSI):
This is a feature you won't find anywhere else. ORION FME offers the option to draw Bollinger Bands not on the price, but directly on the RSI itself. What does this mean? You can now see when not just the price, but the momentum itself is "squeezing" and ready for a breakout. When the RSI breaks out of its own Bollinger Bands, it's a sign of an extraordinary surge in momentum.
Layer 3 - The Game-Changing Feature: Fully Automatic Divergence Engine
Put an end to the tedious task of hunting for divergences! ORION FME includes the powerful divergence engine that has become a signature of the ORION series.
Bullish Divergence 🐂: Is the price making lower lows while the RSI is making higher lows? ORION FME detects this instantly and marks it with a "Bull" label on your chart, signaling a potential bottom and a rally.
Bearish Divergence 🐻: Is the price renewing its highs while the RSI's momentum is fading? This is the clearest sign that the rally is losing its strength. The "Bear" label warns you in advance of a potential top and decline.
High-Probability Trading Strategies:
Strongest BUY Signal:
A Bullish Divergence appears on the chart with a "Bull" label.
The RSI turns up from the oversold zone (below 30) and crosses above its adaptive KAMA signal line.
This is an A+ grade, multi-confirmation buying opportunity.
Strongest SELL Signal:
A Bearish Divergence appears on the chart with a "Bear" label.
The RSI turns down from the overbought zone (above 70) and crosses below its adaptive KAMA signal line.
This is a high-probability shorting opportunity.
Disclaimer
This indicator is a professional analysis tool developed to assist in your trading decisions. No signal or analysis constitutes investment advice. Trading in financial markets involves high risk, and past performance is not a guarantee of future results. Please always apply your own risk management strategies.

WSMR v3.8 — WhaleSplash → Mean Reversal# WSMR v3.8 — WhaleSplash → Mean Reversal
### Global, Anchored, Non-Repainting Signal Framework for Futures, Crypto & Index Markets
**WSMR v3.8** is a volatility-anchored market-structure framework designed to detect two high-probability turning points:
## 1️⃣ WhaleSplash (WS) — Short Impulse Exhaustion
A “WhaleSplash” is a large downside impulse characterised by:
- bar range ≥ *k × ATR*
- strong % move
- volume expansion vs SMA(20)
- deep Z-Score oversold
- compression away from VWAP
- RSI weakness
When these conditions align, the indicator marks a short exhaustion event and prints a 🐋 icon below the bar. This is a **non-repainting bar-close confirmation**.
---
## 2️⃣ Mean Reversal (MR) — Bullish Reversal Setup
The MR module combines:
- RSI bullish divergence (pivot-based, safe)
- Z-Score reset above threshold
- SMA20 reclaim with positive slope
- Higher-low structure
When confirmed at bar-close, the indicator identifies conditions favourable for a **mean-reversion long**.
MR signals can optionally trigger an “**1st green candle after MR**” confirmation within a user-defined TTL (default 12 bars).
---
# 🎯 Key Features
### ✔ Non-Repainting Confirmed Signals
WS & MR only fire **after** bar close, using cooldown logic to avoid clustering and noise.
### ✔ VWAP-Anchored Z-Score Framework
All signals reference price distance and statistical deviation from VWAP, producing adaptive, volatility-aware setups.
### ✔ Session Filter (Asia-Optimised)
Optional session gating allows signals only between **23:00–09:00 UTC**, ideal for systematic Asia-session breakout & mean-reversion traders.
### ✔ Volatility Monitor (Normal → Extreme)
Dynamic volatility classification using:
- ATR baseline ratio
- wickiness index
- range Z-Score
States: **Normal → Wicky → Spiky → Extreme**
Displayed with colour-coded background in the status panel.
### ✔ Rolling WhaleSplash Frequency (Analytics Panel)
WSMR tracks the frequency of WhaleSplash events over a rolling window (Bars/Days/Weeks/Months) and estimates average WS/day (on minute timeframes).
### ✔ Status Panel (Bottom-Right)
Live display of:
- Mode (Global/Asia)
- Timeframe + TTL status
- WhaleSplash frequency
- Volatility state
- ATR/Range information
---
# 📌 Best Timeframes
Optimised and validated on **5-minute charts**, but compatible with all intraday timeframes.
---
# 🚨 Alerts Included
- WhaleSplash SHORT
- WhaleSplash LONG
- Volatility Warning (Spiky/Extreme)
---
# ⚠️ Notes
WSMR v3.8 is not a buy/sell system. It is a **signal framework** highlighting exhaustion and reversal conditions. Always combine with market structure, session context, and risk management. Past performance does not guarantee future results.
---
# 💬 Credits
Script created by **John Nolan (JohnFrancisNolan)**
Pine Script® v6
© 2024–2025 — Published under the **Mozilla Public License 2.0**

MagiMagi (AI Trend & SMC)exclusively for Bond Team
・50EMA貫きの形を条件に売買シグナル点灯
・AIトレンドを導入しトレンドの方向性を背景色の変化で可視化
・大口のオーダーブロック表示
・ダウ理論における高安を自動水平線にて表示

Bassi's Consolidation Breakout — ULTIMATE PRO + VPOverview
Bassi’s Consolidation Breakout — ULTIMATE PRO + VP is a professional-grade breakout detection system that combines price structure, volume confirmation, volatility compression, and custom volume profile logic.
The indicator automatically detects compressed consolidation zones, confirms breakouts with multi-layer filters, and plots full trade setups including:
Entry level
Stop-loss
TP1, TP2, TP3 (R:R based)
Trend filters + MTF EMA
Retest validation
Volume Profile confirmation (POC / VAH / VAL)
This is one of the most complete breakout frameworks for TradingView.
🔍 Core Concept
The script detects tight consolidation boxes based on:
Price range (% compression)
Lookback period
Minimum required bars
Breakout above/below the box
Once the consolidation ends, breakout signals fire only if they pass all filters.
This focuses your trading on high-probability breakouts only.
🔥 Key Features
1️⃣ Automated Consolidation Box Detection
Draws consolidation boxes dynamically
Identifies tight range compression
Supports advanced range logic for high accuracy
2️⃣ Smart Breakout + Retest Engine
Breakouts and breakdowns require:
Structure break
Minimum breakout expansion (0.15%)
Volume confirmation
Trend (200 EMA) confirmation
Optional retest validation
Optional Volume Profile filter
Each valid breakout prints a signal + full trade setup.
3️⃣ Custom Volume Profile Engine
Fast and lightweight custom-built VP that calculates:
POC (Point of Control)
VAH (Value Area High)
VAL (Value Area Low)
These levels can optionally be used to filter weak breakouts.
4️⃣ Multi-Timeframe Trend Filter
Uses 200 EMA from any selected higher timeframe
Helps avoid counter-trend fakeouts
Fully optional
5️⃣ Automatic Trade Setup Projection
Each breakout generates:
Stop-loss (ATR × multiplier)
TP1 (R:R)
TP2 (R:R)
TP3 (optional)
Clean signal labels
Only keeps the last 2 signals to maintain clarity
6️⃣ Alerts Included
Alerts fire instantly when a valid breakout occurs:
“Bassi LONG + VP”
“Bassi SHORT + VP”
Alerts include ticker + entry price.
📘 Usage Guide & Trading Rules
✔ Recommended Trading Steps
1. Wait for a confirmed consolidation box
Box must be narrow
Must meet minimum bar requirement
2. Wait for a confirmed breakout signal
Signal requires:
Breakout above/below box
Volume confirmation
Trend & MTF confirmation if enabled
Optional retest
Optional VP filter (close outside VAH/VAL)
3. Follow the projected setup
The script prints:
Entry
SL
TP1 / TP2 / TP3
Target lines extend automatically.
📖 How to Use the Script (Trading Rules)
1️⃣ Long Entry Rules
Enter Long when:
Price breaks above trend confirmation level
Momentum signal turns bullish
Candle closes above trigger line
Volatility filter is satisfied
Exit Long:
TP1/TP2/TP3 levels
Reversal signal
Trailing stop hit
2️⃣ Short Entry Rules
Enter Short when:
Price breaks below trend confirmation level
Momentum signal turns bearish
Candle closes below trigger line
Volatility filter is satisfied
Exit Short:
TP1/TP2/TP3 levels
Trend reversal
Trailing stop hit
✔ Recommended Markets
Crypto
Forex
Indices
Futures
Stocks
Works on all timeframes from 1-minute to daily.
✔ Best Practice
Avoid taking signals against HTF trend
Prefer signals that break away from VAH/VAL
Use TP1 to secure partial profits
Move SL to breakeven after TP1 if desired
Always follow personal risk management
👤 Author
Created by: Mahdi Bassi
Professional trader & systems designer
Focused on structural, volume-based and volatility-based strategies.
⚠️ Disclaimer
This script is for educational purposes only.
No indicator can guarantee profits.
Always use proper risk management and trade responsibly.
