Trendline365 Delta V2025 (Fixa)The Trendline365 Delta is an advanced structural-reading indicator that combines multiple layers of fixed moving averages, organized by color, to reveal the real dynamics of the trend across different time horizons. It does not attempt to predict the market — instead, it accurately describes how the trend is behaving right now, allowing traders to identify acceleration, weakness, transitions, and decision points that usually go unnoticed.
The indicator is divided into color-coded bands:
Red Series → Represents ultra-short-term momentum. It serves as an immediate thermometer of strength or weakness, ideal for validating early moves and shallow pullbacks.
Yellow Series → Captures the intermediate trend. This zone acts as a powerful filter to avoid rushed entries and highlights deeper corrections within a larger trend.
Green Series → Shows the macro structure of the trend. When price consistently stays above or below this band, a clear primary direction is established.
Blue Series → The classic institutional axis, the most widely used global reference to evaluate bull markets and bear markets.
Long Blue Series → Represents the extreme long-term trend. A “gravitational floor” that only shifts when entire market cycles reverse.
In addition to the moving averages, the indicator includes a 20-period Volume Moving Average, allowing the trader to evaluate the strength behind price movements. The combination of structure (moving averages) and energy (volume) provides a clear reading of continuation, exhaustion, true breakouts, and fake breakouts.
How to use it in practice
Strong trend: price above the red/yellow bands, upward alignment, and sustained volume.
Transition: when price begins crossing from one colored band to another, especially if volume divergence is present.
Healthy corrections: low-volume pullbacks into the red/yellow zones.
Cycle change: breakouts of the green band or the 200-period level with increasing volume.
The Trendline365 Delta simplifies trend analysis and transforms the chart into an intuitive visual map, ideal for swing traders, position traders, and content creators who want to explain the market with clarity and authority.
Hareketli Ortalamalar

Pivot Hourly x EMA RibbonHourly Fibonacci Pivot + EMA is an intraday analysis tool that combines hourly Fibonacci-based pivot levels with exponential moving averages (EMAs). It is designed to help traders visualize potential intraday support/resistance zones and short-term trend direction on any timeframe.
The indicator calculates pivot levels from hourly price data and then projects Fibonacci extensions and retracements around a central pivot. These levels can be used to see where price has previously reacted and where future reactions may occur. The EMAs provide an additional layer of context by highlighting the prevailing short-term trend and momentum.
Key features:
Hourly Fibonacci pivot levels (support and resistance zones derived from hourly ranges)
Multiple Fibonacci bands to show potential reaction areas above and below the central pivot
One or more configurable EMAs to show short-term trend direction and dynamic support/resistance
Works on all symbols and intraday timeframes supported by TradingView
Typical use:
Monitor how price behaves when approaching or rejecting Fibonacci pivot levels
Look for confluence between pivot zones and EMA direction or EMA bounces
Use the levels as potential areas of interest for trade planning, stop placement, or partial profit zones within your own trading system
Also have "C" Label it's mean Candle for example C1 is First Candle of the source timeframe, if the source timeframe set to 4 Hour it will be the first 4h candle, the C2 is the second 4h candle of the day.
This script is intended purely as a technical analysis tool and does not generate buy/sell signals or guarantee any particular outcome. It is not financial advice. Always combine it with your own analysis, risk management, and trading plan before making any trading decisions.

Multi-MA Flow [longshorti]Multi-MA Flow
A versatile Moving Average indicator designed to visualize Trend Flow and identify key dynamic support/resistance levels. It features up to five customizable MAs and highlights the zone between the fast and slow MAs for a clear display of trend strength and direction.
🌟 Key Features
Dynamic Trend Flow (MA Flow Zone): The indicator colors the zone between the Fast MA (MA 2) and the Slow MA (MA 5). The fill visually represents trend direction and its Momentum (Divergence/Convergence) .
Trend Momentum Visualization: The fill color intensity and contrast signal trend strength. For example, Vibrant Fill indicates MA divergence, while Muted Fill signals convergence.
Flexible Moving Average System: Supports up to five (5) customizable MA lines (MA 1 through MA 5), each with independent period and visibility settings.
Supported MA Types: The indicator allows changing the type for all MAs to: EMA, SMA, WMA, or RMA .
Visual Notifications: Includes optional 'R' Retest Labels for finding potential entries on MA 2 and MA Value Labels showing current MA prices on the last bar.
Full Customizability: The entire color scheme, periods, and visibility of all elements are fully adjustable to suit any chart theme.
⚙️ Detailed Customization & Control
General Settings: Selects the Moving Average Type ( EMA, SMA, WMA, RMA ) for all MA lines.
MA Lines (5x): You can independently control Show/Hide , Period , Color , and Width for each of the five MA lines.
Flow Zone Fill:
The Enable MA2/MA5 Fill option allows you to toggle the flow zone visualization on or off.
You also define the Bullish/Bearish Fill Colors .
Labels & Retest: Control the visibility of MA Value Labels and the unique 'R' Retest Markers on MA 2.
Global Color: An option to override all line colors with a single selected Global Color .
💡 How to Use
Trend Direction: Observe the placement of MA 2 relative to MA 5.
Momentum: Watch the color and width of the fill. Widening lines with bright fill color indicates strong momentum.
Entry/Exit Points: Use the 'R' labels to locate potential retests of the fast MA in the direction of the dominant Flow Zone.

WSMR v3.9 — WhaleSplash → Mean Reversal
# WSMR v3.9 — WhaleSplash → Mean Reversal
*A Non-Repainting Impulse‑Reversal Engine for Systematic Futures Trading*
## Overview
WSMR v3.9 is a complete impulse → exhaustion → mean‑reversion framework designed for systematic intraday trading. It identifies high‑energy displacement events (“WhaleSplashes”), measures volatility structure, tracks VWAP deviation, and confirms reversals using RSI divergence, Z‑Score resets, SMA20 reclaim, and pivot-based structure.
All signals are non‑repainting and alerts fire on bar close.
---
## Core Components
### 1. WhaleSplash (Short Impulse Event)
Triggered when a candle meets displacement conditions:
- Large bar range vs ATR
- Minimum % move
- Volume expansion
- VWAP deviation (tick-based)
- Z‑Score oversold / RSI exhaustion
- Volatility-gated
### 2. Mean Reversal Long (MR)
Requires:
- RSI bullish divergence
- Z‑Score reset
- SMA20 reclaim
- Higher-low confirmation
### 3. First-Candle Confirmation (Optional)
- MR Confirm → first green after MR
- WS Confirm → first red after WS
- TTL window configurable
### 4. Asia Session Filter
Optional restriction to:
**23:00 → 09:00 UTC**
### 5. Volatility Monitor
Detects:
- Normal
- Wicky
- Spiky
- Extreme
### 6. WS Frequency Analytics
Rolling frequency calculation across:
- Bars / Days / Weeks / Months
---
## Status Panel (Top-Right)
Shows:
- Mode (Global / Asia-only)
- Timeframe + TTL
- WS frequency
- Volatility state
---
## Alerts
- WhaleSplash SHORT
- WhaleSplash LONG (MR)
- MR Confirm LONG
- WS Confirm SHORT
- Volatility Warning
---
## Notes
- Fully non‑repainting
- Stable bar-close logic
- Optimised for 1m–5m
- Works on futures, indices, metals, FX

Research-Backed Intraday MTF MAsResearch-Backed Intraday Multi-Timeframe Moving Averages
A precision-tuned intraday trading indicator that displays four key moving averages across two critical timeframes:
📊 What It Shows:
- 1-Hour MAs: 75-period SMA & EMA (institutional flow patterns)
- 10-Minute MAs: 200-period SMA & EMA (intraday trend structure)
🎯 Designed For:
- Day traders seeking multi-timeframe confluence
- Identifying strong trending vs. choppy market conditions
- Support/resistance level identification
- Momentum and trend alignment signals
✨ Key Features:
- Optimized periods based on market structure analysis
- Fully customizable colors, transparency, and line widths
- Toggle each MA on/off independently
- Clean, non-cluttered chart display
- Efficient tuple-based data requests
💡 Trading Signals:
- Price above all 4 MAs = Strong bullish alignment
- Price below all 4 MAs = Strong bearish alignment
- Mixed signals = Range-bound conditions, reduce risk
Perfect for scalpers, day traders, and swing traders who want institutional-grade moving averages without the noise.

Moving Averages (10, 21, 50, 200)Moving Averages including 10, 21, 50 and 200 period. Intended mainly for use on a daily chart, but will work for any period.

Moving Average + Count Candles Number - DiLeViThis indicator can add Moving Averages and candles number within same indicator and can be personalised.

Daily 20/50/100/200 SMA with Auto-Labeling (Multi-Timeframe)This script plots the four most widely used Simple Moving Averages - 20, 50, 100, and 200-period SMAs from the Daily timeframe - directly onto any chart, regardless of the chart’s timeframe. It provides a clean, easy-to-read visual overlay for traders who rely on higher-timeframe moving averages for trend analysis, support and resistance, or confluence.
To improve clarity, the script automatically places floating labels beside the most recent price bar, identifying each SMA by color and period. These labels stay neatly positioned to the right of the chart and update dynamically without cluttering historical bars.
Features
• Plots Daily SMA-20, SMA-50, SMA-100, SMA-200 on any timeframe
• Clean multicolored lines with consistent formatting
• Automatic right-side labels that identify each moving average
• Labels update only on the latest bar - no chart clutter
• Adjustable label offset for perfect placement
• Ideal for trend traders, swing traders, and timeframe confluence strategies
This indicator keeps your chart clean while giving you instant awareness of key daily moving averages that institutions and technical traders watch closely.

3 MAs Flexíveis (Tipos Variáveis)Multi-Type 3 Moving Averages (Fully Customizable)
This indicator plots three independent moving averages on the chart, designed for traders who want full control over their trend tools.
Each moving average can be configured separately:
Custom period
Custom price source (close, open, hl2, etc.)
Selectable MA type:
EMA – Exponential Moving Average
SMA – Simple Moving Average
WMA – Weighted Moving Average
HMA – Hull Moving Average
RMA – Smoothed MA (used in RSI)
VWMA – Volume-Weighted Moving Average
Individual color, line thickness and show/hide option
Typical use cases:
Build short-, mid- and long-term trend structure (e.g. fast/medium/slow MAs)
Use as dynamic support and resistance
Visual confirmation of momentum shifts when the fast MA crosses above/below the slower ones
Adapt the MA type to your strategy (e.g. HMA for smoother trend, VWMA for volume-sensitive moves)
This tool is purely visual and analytical: it does not generate signals or alerts by default, making it ideal as a base layer to combine with your own price action or indicator strategy.

TUAN DO – EMA35/105/500 Entry + SL/TP v1.0EMA35/105/500 Gold M1 system with automatic Entry, SL, TP, pip calculation and exit labeling.

Dix$ons Tackle BoxDixsons Tackle Box — Multi-Tool Trend & Levels Suite (MA/EMA + VWAP + BB + Adaptive Trend Channels + Auto Fibs)
---
**Dixsons Tackle Box** is an all-in-one overlay for traders who want a clean chart with *stacked edge* instead of stacked indicators.
It combines:
* A **5-slot MA/EMA pack** with live slope % labels and MTF smoothing
* A **full VWAP engine** with event-based anchors, trend angle coloring, and VWAP bands
* **Bollinger Bands** with volatility-aware coloring and optional gradient background
* A **Short-Term & Long-Term Adaptive Trend Channel (ATC)** with automatic period detection, log-regression channels, and performance tables
* A **Dixson Auto Fibonacci suite**: ATR-based “rail” Fibs + Lookback Fibs off HH/LL, both driving a shared, fully customizable Fib bank
Everything is controlled logically by feature groups under the **“Tackle Box”** section, so you can quickly turn modules on/off and tune the tool to your style (scalp, intraday, swing, or position).
> **Important:** This is an analysis/visualization tool only. Nothing here is financial advice or an automatic trading system. Always test and manage risk yourself.
---
## 1. MA/EMA Pack — 5 Smart Averages with Slope %
**Group:** `Tackle Box` + per-slot groups `MA/EMA 1` … `MA/EMA 5`
**Main toggle:** `Enable MA's`
**Per-slot master row:** `_maRow1` … `_maRow5`
### What it does
This module gives you **five independent MA/EMA slots**, each with:
* Its own **type** (MA or EMA)
* **Length**, **color**, **line width**, and **plot style** (`Solid`, `Step`, or `Circles`)
* **Timeframe per slot** (MTF)
* Rich **label controls** (slope %, length/type text, timeframe text, etc.)
* **Label size** per slot (`tiny → huge`)
On top of that, each average has a **live slope % readout**, normalized by instrument tick size, so you can compare trend steepness across assets.
### Key features
* **Master slot row (1–5):**
In the `Tackle Box` group you have `_maRow1`–`_maRow5` toggles. These gate each slot globally, so you can quickly show/hide specific MAs without digging into each slot.
* **MTF Smoothed Mode:**
* `MTF Smoothed Mode` (on by default) makes higher-timeframe MAs **update only when the HTF bar closes (and on the last bar)**.
* That reduces the stair-stepping noise you often get when pulling HTF data onto an LTF chart, while still giving you accurate levels and a smooth, tradeable line.
* **Per-slot label text controls:**
Each MA group has toggles to control exactly what the label shows:
* `Show Label` – show/hide label entirely
* `Slope` – append slope % to the label
* `Len+Type` – show e.g. `50EMA` or `200MA`
* `TF` – show HTF name if the slot is on an MTF
* `'slope' text` – optionally include the word `slope` in the label
* **Slope % (angle) logic:**
Slope for each MA uses a normalized **“angle %” in **, based on the 1-bar change vs `syminfo.mintick`.
* Big positive values = strong uptrend
* Big negative values = strong downtrend
* Near zero = flat/neutral
This makes it easy to build rules like:
* “Only trade long if the **50EMA slope** is above +20% and price is above VWAP”
* “Take profit if slope on my faster MA collapses back toward 0.”
### Typical use
* Slot 1–2: **fast intraday EMAs** (e.g., 9 / 20 EMA)
* Slot 3–4: **structural EMAs/MAs** (e.g., 50 / 200)
* Slot 5: a **dedicated MTF trend filter** (e.g., 5-minute or 1-hour EMA on a 1-minute chart)
---
## 2. VWAP Engine + Bands — Anchor-Aware, Angle-Aware VWAP
**Group:** `Enable VWAP` + `------ VWAP Settings ------`, `Bands Settings`, `Color Settings`
### Core VWAP
* **Anchors:**
`Anchor Period` lets you choose where each VWAP reset starts:
* `Session` (day session VWAP, perfect for intraday)
* `Week`, `Month`, `Quarter`, `Year`, `Decade`, `Century`
* Corporate events: `Earnings`, `Dividends`, `Splits`
This lets you build VWAP logic around:
* **Intraday mean reversion** (Session VWAP + bands)
* **Swing anchor VWAPs** (Weekly/Monthly)
* **Event-based anchors** (earnings/dividend/split reaction)
* **Hide on DWM:**
`Hide VWAP on 1D or Above` lets you keep intraday VWAP from cluttering higher-TF charts.
* **Angle/Trend Detection:**
The VWAP engine computes a **regression slope** over each anchor segment and converts it to an **angle %**:
* `Angle Lookback (bars)` controls how many bars are used
* `Angle Trend Threshold (%)` sets the threshold where a slope is considered “trending”
With `Color VWAP by Trend` enabled:
* Uptrend > threshold → VWAP turns **trend up color** (e.g., lime)
* Downtrend < −threshold → VWAP turns **trend down color** (e.g., red)
* Inside threshold → VWAP uses a neutral color
You can also set separate **line widths** for neutral vs trend state and transparency to give a “Hull-style” visual feel.
* **VWAP Labels:**
You get a single, de-duplicated VWAP label on the last bar with:
* Optional **name** (`VWAP`)
* Optional **price** (`$xxx.xx`)
* Optional **angle %** and optional `"slope"` word
* Global **label size** for VWAP + bands
### VWAP Bands
* **Calc modes:**
`Bands Calculation Mode`:
* `Standard Deviation` – classic VWAP ± n * σ
* `Percentage` – bands as a fixed % of VWAP
* **Bands 1-3:**
Each band has:
* Visibility toggle, independent multiplier (`×`)
* Separate **upper/lower colors** per band
* Optional **fill** between upper/lower for each band
* Label toggles:
* `Show All Labels`
* `Show Band #X Label`
* `Band Labels: Show Names` (VWAP+1, VWAP-1, etc.)
* `Band Labels: Show Prices`
This lets you configure anything from a minimalist “just VWAP + 1 band” view to a full 3-band ladder.
### VWAP Highlight Fill
* **Premium/discount shading**:
Optional fill that shades:
* Region **above VWAP** when price is above (e.g., greenish)
* Region **below VWAP** when price is below (e.g., reddish)
This makes it extremely easy to see when price is trading at **premium vs discount** relative to the current anchor VWAP.
### Typical use
* Intraday scalpers: Session VWAP + 1–2 bands + highlight fill
* Swing traders: Weekly/Monthly VWAP + only the main line and label
* Event traders: Earnings-anchored VWAP, tracking post-earnings drift
---
## 3. Bollinger Bands — Volatility-Aware BB with Gradient Fill
**Group:** `Enable Bollinger Bands` + `------ Bollinger Band settings ------`
### What it adds
A clean Bollinger Band overlay designed to play nicely with the VWAP/MA stack:
* `Bollinger Bands Length` (default 20)
* `Bollinger Bands Multiplier` (default 2.0)
* `BB Basis Color` & **line width**
* Upper/lower bands colored based on **width change**:
* Expanding volatility → `BB Expanding Color`
* Contracting volatility → `BB Contracting Color`
You can also toggle:
* `Show Center Line MA Label` – prints something like `20ma` on the last bar.
* `Enable Gradient Background Fill` – draws a gradient between price and the bands:
* `Gradient Fill Up Color` for below-price fill
* `Gradient Fill Down Color` for above-price fill
### Why it’s unique here
Instead of just static bands, this implementation **flags volatility regimes** (expansion vs contraction) via color and optional gradient. That pairs nicely with ATR Fibs and VWAP:
* Use **BB contraction (squeeze)** + flat VWAP angle to anticipate breakouts.
* Use BB + VWAP bands to filter which “touches” are genuinely overextended.
---
## 4. Dixson Adaptive Trend Channel (ATC) — Short-Term & Long-Term Log Channels
**Master toggle:** `Enable Adaptive Trend Channel`
**Groups:** `------ Dixson ATC Settings ------`, `Short-Term Channel Settings`, `Long-Term Channel Settings`, `Short-Term Midline Settings`, `Long-Term Midline Settings`, `Channel Trend Background Fill Settings`, `Short-Term Table Settings`, `Long-Term Table Settings`
### Under the hood
ATC is a **log-scale regression channel engine** that automatically:
1. Scans a set of candidate periods.
* **Short-term:** 20 → 200 bars
* **Long-term:** 300 → 1200 bars
2. For each period, it computes:
* Log-price regression slope & intercept
* Standard deviation of residuals
* A Pearson-style R value (trend “strength”)
3. Picks the period with the **highest correlation (|R|)** and uses that as the **detected trend length**.
This yields a **data-driven channel** that adapts to whatever trend the market is actually respecting.
> For long-term stats, annualized return only makes sense on **daily/weekly** charts. On intraday charts, treat the “Annual Return” purely as informational.
### Short-Term Channel
Controls in `Short-Term Channel Settings` + `Short-Term Midline Settings`:
* `Show Short-Term Channel` – on/off
* `Deviation Multiplier (Short-Term)` – how wide the channel is (in standard deviations)
* **Upper/Lower colors**, line width, style (Solid/Dotted/Dashed), transparency
* `Line Extension Style` – Extend Right / Extend Both / Extend None / Extend Left
Optional **Short-Term Midline**:
* Toggle + color, style, width, transparency
* Tracks the regression line itself (center of the channel)
Background fill:
* `Enable ST Background Fill` with separate **ST Uptrend** / **ST Downtrend** colors
* Trend direction is inferred from regression slope sign
### Long-Term Channel
Mirrors the ST controls with its own group:
* `Show Long-Term Channel`
* `Deviation Multiplier (Long-Term)`
* Upper/Lower channel colors, thickness, style, transparency
* `Line Extension Style`
* Optional Long-Term midline + colors/styles
* Optional **background fill** with separate colors for up vs down
You can run **both channels at once**, giving a panel of:
* **Macro trend structure** (Long-Term ATC)
* **Current swing trend** (Short-Term ATC)
* MAs, VWAP, and Auto Fibs on top for entries/exits
### Trend Info Tables
Each channel has its own table options:
* `Show Detected Period` (bars used)
* `Show Trend Strength` – either:
* Descriptive text: “Extremely Weak” → “Ultra Strong”, or
* Raw Pearson R value if `Show Pearson R` is enabled
* `Show Annualized Return` (when timeframe is daily/weekly)
* Table position (`Top Left`, `Bottom Right`, etc.)
* Text size (`Small`, `Normal`, `Large`)
These tables quantify:
* Over what lookback the trend is being measured
* How “clean” that trend is
* What the approximate annualized performance of that trend has been
---
## 5. Dixson Auto Fibonacci Suite — ATR Fibs + Lookback Fibs + Shared Fib Bank
**Master toggle:** `Enable Auto Fibonacci`
**Groups:** `Dixson Auto Fibonacci`, `ATR Auto Fib`, `Previous ATR Fib`, `Lookback Auto Fib`, `Lookback Anchor Overrides`, `Fibonacci Levels`
You get **two separate engines** (ATR-based and Lookback-based) that both draw from the **same customizable Fib bank**, with optional log scaling.
---
### 5.1 Global Auto Fib Settings
* `Logarithmic Scale`
* When ON, Fib levels are interpolated in log-space (better for assets that move in percentages).
* When OFF, interpolation is linear in price.
This applies to **both** the ATR and Lookback engines.
---
### 5.2 ATR Auto Fib (Rail-Based, Supertrend-Driven)
**Groups:** `ATR Auto Fib`, `Previous ATR Fib`
The ATR engine builds **“rails”** that hug price without letting candles touch them, then projects Fib levels between these anchors.
#### How it works
1. Uses built-in `ta.supertrend` with:
* `ATR Period`
* `ATR Multiplier`
2. Builds dynamic **upper and lower rails** around price:
* Uses ATR to define a **proximity gap** (`Proximity (×ATR)`) so rails stay **just outside the wicks** (no-touch behavior).
* Smooths raw highs/lows slightly (RMA) to avoid spiky rails.
* Ensures the upper rail is always ≥ high+gap and lower rail ≤ low−gap.
3. The **direction** (uptrend/downtrend) is inferred from the Supertrend direction:
* On trend flips, the script:
* Captures the prior rail pair as a **“previous segment”**
* Starts a new rail segment in the new direction
4. From these rails, the script draws **directional Fib “ladders”**:
* For the **current ATR Fib**:
* The Fib is drawn from one anchor to the other depending on the trend sign.
* Rays are projected `Ray Length` bars to the right of `Current Offset`.
* For the **previous ATR Fib**:
* The last completed segment’s start/end rails are used as anchors
* Rays are projected using `Prev Fib Offset` and `Prev Fib Length`
#### Current ATR Fib controls
* `Enable ATR Fib` – toggles current ATR Fib bank
* `ATR Period`, `ATR Multiplier` – control the “engine” behind the rails and ST logic
* `Current Offset`, `Ray Length` – where and how far rays are drawn
* `Show Level Text`, `Show Price`, `Display % not ratio` – label style
* `Label Size (Current ATR Fib)` – for all current ATR Fib labels
Visual extras:
* `Plot Hi/Low Anchor Lines` – shows upper/lower rails
* `Plot ATR Trailing Stop` – shows clamped Supertrend as a continuous line
#### Previous ATR Fib controls
* `Enable Prev ATR Fib` – toggles previous segment ladders
* Independent `Prev Fib Offset`, `Prev Fib Length`
* Separate label controls:
* `Show Level Text (Prev)`
* `Show Price (Prev)`
* `Display % not ratio (Prev)`
* `Label Size (Previous ATR Fib)`
Use the **current ATR Fib** as your active trading “ladder” and the **previous ATR Fib** to track recently broken structure and potential retest zones.
---
### 5.3 Lookback Auto Fib — HH/LL-Driven Fib Bank, MTF + Manual Overrides
**Group:** `Lookback Auto Fib` + `Lookback Anchor Overrides`
This engine draws Fibs between **highest high** and **lowest low** within a given lookback window on a chosen timeframe.
#### How it works
1. Select higher timeframe:
* `Lookback Timeframe` (empty = chart timeframe)
2. Choose your range:
* `Lookback Bars` – number of bars on the selected TF to scan for extremes
3. Optionally allow look-ahead:
* `Look-ahead Bars (repainting)`
* `0` = no look-ahead (no forward info, no repainting)
* `>0` = uses `barmerge.lookahead_on` for forward-looking extremes (can repaint)
4. For that range, the script finds:
* Highest high + its bar offset
* Lowest low + its bar offset
5. Trend direction is determined by **which extreme is more recent**:
* Recent high → **down** direction (high → low)
* Recent low → **up** direction (low → high)
6. Manual direction overrides:
* `Force Uptrend` / `Force Downtrend` – override the auto decision
7. Manual anchor overrides:
* `Manual Anchor High (LB)`
* `Manual Anchor Low (LB)`
If both are set, those become the anchors and direction is deduced from which is higher.
8. The engine then draws a **directional Fib ladder**:
* Anchors between high/low based on direction
* Rays extend `Lookback Fib Length` bars from `Lookback Fib Offset`
#### Label controls
* `Show Level Text`, `Show Price`, `Display % not ratio`
* `Label Size (Lookback Fib)`
* Labels are prefixed with `LB` to distinguish them from ATR Fibs.
This engine is ideal for:
* **Swing structure mapping:** Drawing Fibs across the last major swing on the HTF.
* **Confluence:** Aligning Lookback Fibs with ATR Fibs, ATC channel boundaries, and VWAP bands.
---
### 5.4 Shared Fibonacci Levels — Fully Custom Fib Bank for Both Engines
**Group:** `Fibonacci Levels`
The ATR and Lookback engines **both** use the same Fib bank:
* **Ratios provided by default:**
* 0.000
* 0.146
* 0.236
* 0.382
* 0.500
* 0.618
* 0.650
* 0.707
* 0.786
* 0.886
* 1.000
* 1.130
* 1.272
* 1.618
* 2.000
Each ratio has its own:
* `Enable Level X.XXX`
* `Level X.XXX` (the actual ratio – fully editable)
* `Thickness X.XXX` (line width)
* `Style X.XXX` (Solid / Dashed / Dotted)
* `Color X.XXX` (line + label color)
Adjusting a level here **instantly updates both** ATR and Lookback ladders. This makes it very easy to:
* Run “standard” Fib sets for classic retracements
* Or define your **own Fib presets** (e.g., 0.25 / 0.5 / 0.75, or custom extension clusters)
---
## How to Use & Suggested Workflows
**Scalpers / 0DTE / Intraday:**
* Enable:
* MA/EMA pack (fast EMAs + one MTF slot)
* VWAP (Session anchor) + 1–2 VWAP bands + highlight fill
* ATR Auto Fib (current + previous)
* Optionally hide:
* Lookback Fibs
* Long-Term ATC (unless you want HTF bias on your intraday chart)
Use slope labels, VWAP angle %, and ATR Fib ladders to structure trades around pullbacks, mean reversion, and breakouts.
**Swing / Position traders:**
* Turn on:
* Long-Term ATC (with table)
* Short-Term ATC for swing structure
* Lookback Auto Fib on a higher timeframe (e.g., D on 4H chart)
* Keep VWAP anchored to Week or Month, and MA slots for key reference MAs.
Use ATC channels for **trend structure**, Lookback Fibs for **swing levels**, and long VWAPs for **value zones**.
---
## Final Notes & Disclaimer
* Works on **all symbols** and **all timeframes**, but some stats (like “Annualized Return”) are only meaningful on **daily/weekly** data.
* Some options (like Look-ahead mode for Lookback Fibs) can **repaint** on purpose. These are clearly labeled — use them only if you understand and want forward-looking behavior.
* This script does **not** place trades. It is a visual / analytical tool only.
* Nothing in this indicator or description is financial advice. Always do your own research, forward-test, and manage risk appropriately.
If you have **invite-only access** to **Dixsons Tackle Box**, you’re getting the full Dixson overlay stack in one place — designed to be the central “hub” for your chart, not just another line on it.

Book of Fish: Universal Deep DiveAhoy, Captain. 🏴☠️
Here is your official Angler’s Manual for the Book of Fish: Universal Deep Dive. This guide translates every pixel on your TradingView chart into nautical instruction so you can navigate the currents and land the big catch.
Print this out, tape it to your monitor, and respect the code of the sea.
________________________________________
📖 The Angler’s Manual: How to Fish
A Guide to the "Universal Deep Dive" Indicator
🌊 1. Check the Current (Background Color)
Before you cast a line, you must know which way the river is flowing.
• Green Water (Background): The tide is coming in. The broad market (Advancers) is beating the losers.
o The Rule: We prefer Longs (Calls). Swimming upstream against the green current is dangerous.
• Red Water (Background): The tide is going out. The market is heavy.
o The Rule: We prefer Shorts (Puts). Don't fight the gravity.
Captain’s Note: If your specific fish (stock) is Green while the water is Red, that’s a Monster Fish (Relative Strength). It’s strong, but keep a tight drag—if it gets tired, the current will drag it down fast.
________________________________________
🐟 2. Identify the Species (Candle Colors)
The color of your bars tells you exactly what strategy to deploy.
🟢 The Marlin (Ultra Bull)
• Visual: Green Candles. Price is riding above the Yellow Wave (20 EMA), and the Yellow Wave is above the White Whale (200 EMA).
• Strategy: Trend Following.
• How to Fish:
o Wait for the fish to swim down and touch the Yellow Wave.
o If it bounces? CAST! (Enter Long).
o Target: Let it run until the trend bends.
🔴 The Barracuda (Ultra Bear)
• Visual: Red Candles. Price is diving below the Yellow Wave, and the Yellow Wave is below the White Whale.
• Strategy: Trend Following (Short).
• How to Fish:
o Wait for the fish to jump up and hit the Yellow Wave.
o If it rejects? CAST! (Enter Short).
🟠 The Bottom Feeder (No Man’s Zone)
• Visual: Orange or Lime Candles. The price is fighting the trend (e.g., Price is below Yellow, but Yellow is still above White).
• Strategy: Reversion to Mean (Scalping).
• How to Fish:
o You are catching small fry here.
o Target: The Purple Anchor (VWAP) or the White Whale (200 EMA).
o Rule: As soon as it hits the Anchor or the Whale, cut the line and take your profit. Do not hold for a home run.
________________________________________
🎣 3. The Tackle Box (Signals & Icons)
These shapes are your triggers. They tell you when to strike.
Icon Name Meaning Action
▲ (Green Triangle) 3-Bar Play THE STRIKE. Momentum is breaking out after a rest. ENTER NOW. This is the sharpest hook in the box. Trend is resuming.
🔷 (Blue Diamond) Inside Bar The Nibble. Price is coiling/resting. Set a trap. Place a stop-entry slightly above the diamond (for longs).
⚫ (Black Dots) The Squeeze Calm Waters. Volatility has died. DO NOT CAST. Wait. When the dots disappear, the storm (and the move) begins.
9️⃣ (Red/Green Number) Exhaustion Full Net. The school has swum too far in one direction. Take Profits. A Red 9 at the top means the bull run is tired. A Green 9 at the bottom means the bear dive is ending.
✖️ (Purple Cross) RSI Snag Hazard. The engine is overheated (Overbought/Oversold). Don't add weight. The line might snap if you buy here.
________________________________________
🗺️ 4. The Map (The Lines)
• The Yellow Wave (20 EMA): Your surfboard. In a strong trend, price should surf this line. If it closes below it, the surf is over.
• The White Whale (200 EMA): The deep ocean trend. This is massive support/resistance. We generally do not short above the Whale or long below it.
• The Purple Anchor (VWAP): The average price. Prices love to return here when they get lost in the No Man's Zone.
• The Dotted Lines (PDH/PDL): The Horizon. Previous Day High (Green) and Low (Red). Crossing these means you are entering open ocean (Discovery Mode).
⚓ The Captain's Code
1.Don't force the fish. If the chart is chopping (Gray candles), stay on the dock.
2.Respect the '9'. When you see that number, lock in some gains.
3.The Trend is your Friend. Green Candles + Green Background = Smooth Sailing.
Fair winds and following seas.

FMT Double EMA Symbol&AlertFMT_2xEMA – Trend Made Simple!
This indicator combines 2 EMA lines to clearly show trend direction, with handy features like automatic alerts, colored candle confirmation, and fully customizable colors. Perfect for spotting momentum at a glance!
It can be used on any instrument such as stocks, futures, crypto, and more, with double EMAs adjustable to fit your own trading strategy.
Pro tip: Use 2 timeframes — a higher timeframe to spot EMA rejections, and a lower timeframe to enter trades when the cross occurs. Happy trading!

Prowl's EMA 10/20/50 trend followingThis indicator is designed to simplify trend trading by visually filtering market noise. It removes the need to constantly analyze multiple moving average crossovers by converting complex trend alignment into a simple "Traffic Light" background system.
How it Works This script utilizes a triple-EMA (Exponential Moving Average) system to gauge market conditions on two levels:
Momentum: It analyzes the relationship between the Fast and Medium EMAs to determine immediate short-term momentum.
Trend Filter: It compares the current price action against a Slow (Baseline) EMA to ensure the major trend is respected.
Visual Guide
Green Background: This indicates a "High Probability Buy Zone." It only triggers when both the short-term momentum is positive (Fast EMA ≥ Medium EMA) AND the price is maintaining its structure above the long-term baseline (Price ≥ Trend EMA).
Red Background: Indicates neutral or bearish conditions where the trend alignment is broken.
The Lines:
Red Line: Fast EMA (Short-term reaction)
Orange Line: Medium EMA (Intermediate trend)
Green Line: Trend EMA (Long-term baseline)
Features
Visual Simplicity: The background color allows you to instantly see if the trend is in your favor without cluttering your mental space.
Fully Customizable: All EMA lengths are adjustable in the settings to fit your specific timeframe (Scalping vs. Swing Trading).
Gradient Colors: The lines are color-coded (Red to Green) to visually represent the time horizon.
Adjustable Opacity: Users can control the intensity of the background color to keep their charts clean.
Usage Strategy This tool is best used as a "Trend Filter." Traders can look for their specific entry setups (candlestick patterns, breakouts, etc.) only when the background is Green, and stand aside or look for shorts when the background is Red.

Matt's Multi-Timeframe MACD Direction AlertThe indicator monitors the direction of the Moving Average Convergence Divergence (MACD) lines on four specific timeframes: 1-hour, 15-minute, 5-minute, and 1-minute.
It only generates a signal when the MACD in all four timeframes is trending in the same direction (either all are bullish, or all are bearish). This alignment suggests a strong, synchronized market momentum from short-term scalping views up to immediate-term swing views.
Key Features:
Multi-Timeframe Confirmation: Uses TradingView's request.security() function to fetch data from different timeframes (1h, 15m, 5m, 1m), preventing the need to manually switch charts.
Visual Dashboard: A dashboard table is displayed on your chart, providing an immediate visual status (Bullish/Bearish/Neutral) for each of the four timeframes.
On-Chart Signals: The indicator plots visual shapes (green triangles for bullish alignment, red triangles for bearish alignment) directly on the sub-chart when the condition is met.
Custom Alert Integration: It includes a built-in alertcondition() function, allowing traders to set up real-time, hands-free notifications whenever a synchronized trading opportunity arises.
This tool helps filter out noise and potential false signals that might appear on a single timeframe, focusing instead on robust signals confirmed by a consensus of time perspectives.

ChronoFlow## ChronoFlow Sentinel
ChronoFlow Sentinel is a regime console that blends normalized fast/mid/slow regression slopes, phases them against a dual-speed EMA spread, and grades alignment so you instantly know whether the time stack is trending, rotating, or fighting itself.
HOW IT WORKS
Multi-Timeframe Slopes – Linear regression slopes are fetched via request.security() for your chosen fast, mid, and slow frames.
Normalized Weighting – User weights are rescaled so the composite chrono score is always on a consistent scale, regardless of configuration.
Phase Differential – The indicator subtracts a slow EMA from a fast EMA to detect whether price impulse confirms the slope mix.
Alignment Score – Signs of the three slopes are compared to compute a 0-1 alignment metric; backgrounds and alerts use this to signal confidence vs. chop.
Diagnostics Console – A bottom-right table streams each slope, the blended score, and which timeframe currently dominates.
HOW TO USE IT
Trend Qualification : Only push multi-contract positions when chrono score is positive, phase is positive, and alignment stays above your alert threshold (default 0.66).
Chop Defense : When alignment dips and conflict markers appear, immediately switch into mean-reversion tactics or sit flat.
Swing + Intraday Bridge : Pair ChronoFlow with other structure tools; require both aligned backgrounds and price confirmation before committing to swing entries.
CRYPTOCAP:SOL | CRYPTOCAP:XRP side by side view with ChronoFlow
VISUAL FEATURES
Optional flow curves: Enable Plot Raw Flows to audit each timeframe's slope when troubleshooting a signal.
Background intensity: Opacity auto-adjusts with alignment, so weak trends look faded while strong regimes glow vividly.
Signal/Conflict toggles: Long/short and chop markers are opt-in, keeping the panel pristine until you need annotations.
Conflict alerts: Built-in alert condition fires whenever alignment falls below your threshold, warning execution layers to scale down risk.
PARAMETERS
Fast Frame (default: 30): Fast timeframe for regression slope calculation.
Mid Frame (default: 120): Mid timeframe for regression slope calculation.
Slow Frame (default: D): Slow timeframe for regression slope calculation.
Fast Regression (default: 21): Regression length for fast timeframe.
Mid Regression (default: 34): Regression length for mid timeframe.
Slow Regression (default: 55): Regression length for slow timeframe.
Phase Length (default: 13): EMA period for phase differential calculation.
Fast Weight (default: 0.45): Influence of the fast timeframe in the composite score.
Mid Weight (default: 0.35): Influence of the mid timeframe in the composite score.
Slow Weight (default: 0.20): Influence of the slow timeframe in the composite score.
Plot Raw Flows (default: disabled): Enable to audit each timeframe's slope when troubleshooting.
Show Signal Labels (default: disabled): Toggle long/short signal markers.
Show Conflict Labels (default: disabled): Toggle conflict/chop markers.
Conflict Alert Level (default: 0.66): Set the alignment threshold that should trigger reduced size or flat positioning.
ALERTS
The indicator includes three alert conditions:
ChronoFlow Bullish: Detected a bullish regime shift
ChronoFlow Bearish: Detected a bearish regime shift
ChronoFlow Conflict: Flagged a low-alignment regime
LIMITATIONS
This indicator requires access to multiple timeframes via request.security() , which may consume additional resources. The alignment score is a simplified metric—real market conditions are more complex than a 0-1 scale can capture. The phase differential calculation assumes EMA spreads are meaningful proxies for momentum, which may not hold in all market regimes. Users should test parameter combinations on their specific instruments and timeframes, as default values are optimized for typical index futures trading.
---

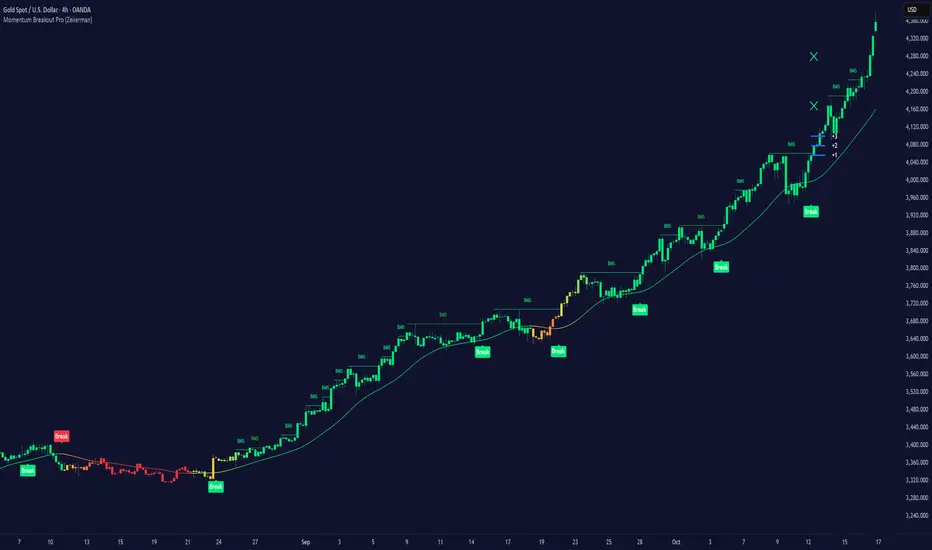
Momentum Breakout Pro (Zeiierman)█ Overview
Momentum Breakout Pro (Zeiierman) is a breakout-focused quantitative system engineered to identify only the strongest momentum expansions in the market. Instead of reacting to price movement, it reconstructs a refined momentum signal, evaluates its strength and persistence, and validates each breakout against the broader market context. Only when momentum pressure aligns with structural direction, trend state, candle behavior, and spacing requirements will a breakout be considered qualified.
The result is a clean and context-aware signal flow that removes noise and highlights only the breakouts with the highest probability of continuation. Traders receive precise Break signals at qualified points, adaptive trend lines, candle-based trend visualization, structure levels, and volatility-driven confirmation markers. Internally, the system operates as a layered confirmation model designed to enforce directional consensus and filter out the shallow or unreliable moves that typically weaken breakout strategies.
In short, Momentum Breakout Pro offers a refined breakout selection system that focuses on quality over quantity, designed for traders who want clean and well-supported breakout signals backed by structured technical logic.
⚪ Why This One Is Unique
Momentum Breakout Pro’s uniqueness comes from its multi-layered confirmation process. The internal momentum reconstruction ensures that only sustained directional pressure is considered meaningful. Optional filters such as Dynamic Trend, SuperTrend, Average Trend, VWAP, and Market Structure provide an adjustable decision stack, allowing traders to decide how strict or flexible the validation should be. Breakouts are released only when the enabled components agree.
█ Main Features
⚪ Breakout Signals
The Breakout Signals are the core feature of the indicator. They help traders identify high probability breakouts that are more likely to follow through. With built-in confirmation levels, it becomes much easier to judge whether a breakout is strong or likely to fail. Combined with the suggested take profit points, traders can quickly find confirmed breakout opportunities with realistic first profit targets.
⚪ Breakout Filters
The indicator includes multiple filters that align each breakout with the current trend, structure, and momentum. This is essential for identifying only the strongest and most reliable breakout setups.
⚪ Dynamic Trend
The Dynamic Trend is a volatility-aware long-term trend filter. It removes noise and adapts to sharp volatility swings, staying focused on the true underlying trend direction. This helps traders avoid false signals and remain aligned with the broader market drift.
⚪ Moving Average
A standard moving average with a user-defined length. Simple, effective, and easy to understand. It acts as a clean trend filter for both beginners and advanced traders.
⚪ Super Trend
A Super Trend filter that restricts breakout signals to appear only in the direction of the active SuperTrend. This adds an additional layer of directional confirmation.
⚪ VWAP
VWAP (Volume Weighted Average Price) is a powerful anchor, especially on lower timeframes. It serves as a dynamic support or resistance level and a highly reliable trend filter.
⚪ Candle Coloring
The candle coloring engine tracks how long the price has moved in one direction and translates that persistence into a graded bull, mid, or bear color spectrum. This helps traders quickly understand trend strength, confirm momentum, and allow the market enough space to move before a larger breakout occurs.
⚪ Momentum
The momentum filter identifies bursts of momentum and highlights the strongest correlations between price and movement strength. It filters out weak breakouts that are not backed by real momentum, improving accuracy significantly.
⚪ Market Structure
Trading with the current market structure is crucial. This filter ensures that breakout signals appear only when they align with the existing structure, helping traders stay on the right side of the market.
█ How to Use
⚪ Breakouts
Use this tool to identify high-quality breakouts. To increase accuracy, combine the breakout signals with the trend, structure, and momentum filters. When these elements align, the probability of a successful breakout increases significantly.
⚪ Confirmation Levels
The indicator includes three confirmation levels that adapt based on current market volatility.
These levels help you judge the strength of the breakout:
When the three levels are tight and close to the price, it indicates strong conditions. Price is more likely to break through all levels quickly and confirm the breakout.
When the levels are spread out and far from the price, the breakout becomes weaker. Price must travel too far to confirm the move, which lowers the probability of a clean follow-through.
What you want to see is a breakout where all three confirmation levels are penetrated within the next few candles. That is the ideal scenario, indicating a confirmed breakout with a higher chance of continuation in that direction.
⚪ Take Profit Strategy
The indicator includes built-in take profit levels, which act as your first two targets after a confirmed breakout:
Once Take Profit 1 is hit, move your stop loss to break even.
When Take Profit 2 is hit, move your stop loss to the first take profit level.
From there, allow the position to run until the candle coloring shifts, signaling that momentum may be slowing or reversing.
This approach helps you secure profits early, reduce risk, and stay in the trade for larger moves when the trend is strong.
█ Setting Realistic Expectations: Win-Rate and Risk–Reward
Research on breakout systems, trend-following strategies, and directional volatility all show the same behavioral pattern. Win rates tend to be moderate, while risk and reward are positively skewed. Most breakout attempts are tested quickly by the market and may result in small losses or breakeven trades. The real edge comes from the smaller group of breakouts that expand into multi-stage moves and generate significantly larger gains. This is a well-established characteristic of momentum-driven price dynamics.
Momentum Breakout Pro is designed to work within this framework. It is not built to win on every signal, but to highlight conditions that historically align with stronger follow-through. The tool provides structure levels, confirmation lines, and initial target markers to help traders measure extension and manage risk objectively. Actual results will vary depending on the filters enabled, the markets traded, and how stops and exits are managed. However, the overall expectation remains consistent with established breakout research: frequent smaller outcomes combined with fewer but more impactful winners.
█ How It Works
⚪ Breakout System
The breakout system detects emerging directional expansions by transforming price movement into a stabilized signal curve. It evaluates localized impulse strength, directional bias, and short-term acceleration to determine when the price is exerting statistically meaningful pressure in one direction. When this pressure breaches the system’s internal thresholds, a breakout candidate is registered.
Calculation: Price is processed through a multi-stage smoothing pipeline to construct a normalized signal curve. The script analyzes the curve’s gradient and micro-momentum characteristics within a compact evaluation window. A breakout event is triggered when these combined directional metrics exceed the system’s momentum-pressure threshold.
⚪ Momentum Confirmation
To prevent weak or premature breakouts, the system verifies that momentum behavior aligns with the directional expansion. This ensures that only breakouts supported by sustained impulse strength are considered.
Calculation: The script evaluates the strength, stability, and directional consistency of momentum over the developing move. Instead of reacting to isolated shifts, it assesses whether momentum maintains a coherent and persistent trajectory that reinforces the breakout direction. A breakout is confirmed only when momentum structure and directional pressure are synchronized.
⚪ Confirmation Levels
Once a breakout is detected, three confirmation levels indicate how far the price must travel to confirm the breakout's strength.
Calculation: The levels are spaced using a volatility-adjusted distance formula. A breakout is considered strong when the price clears all three levels within a short time window.
⚪ Targets
Targets provide simple reference points for early take profits and risk management.
Calculation: The distance to a nearby structural or volatility-based reference is measured, then projected outward as proportional 1R / 2R style levels.
-----------------
Disclaimer
The content provided in my scripts, indicators, ideas, algorithms, and systems is for educational and informational purposes only. It does not constitute financial advice, investment recommendations, or a solicitation to buy or sell any financial instruments. I will not accept liability for any loss or damage, including without limitation any loss of profit, which may arise directly or indirectly from the use of or reliance on such information.
All investments involve risk, and the past performance of a security, industry, sector, market, financial product, trading strategy, backtest, or individual's trading does not guarantee future results or returns. Investors are fully responsible for any investment decisions they make. Such decisions should be based solely on an evaluation of their financial circumstances, investment objectives, risk tolerance, and liquidity needs.
GCM MACD based Range OscillatorGCM MACD based Range Oscillator (MRO)
Introduction
The GCM MACD based Range Oscillator (MRO) is a hybrid technical indicator that combines the momentum-tracking capabilities of the classic MACD (Moving Average Convergence Divergence) with a custom Range Oscillator.
The core problem this script solves is normalization. Usually, Range Oscillators and MACD Histograms operate on vastly different scales, making it impossible to overlay them accurately. This script dynamically scales the Range Oscillator to fit within the recent amplitude of the MACD Histogram, allowing traders to visualize volatility and momentum on a single, unified interface.
How It Works (The Math)
1. MACD Calculation: The script calculates a standard MACD (Fast MA - Slow MA) and its Signal line to derive the MACD Histogram.
2. Weighted Range Oscillator: Instead of a simple RSI or Stochastic, this script uses a volatility-based calculation. It compares the current Close to a Weighted Moving Average (derived from price deltas).
3. Dynamic Fitting: The script looks back 100 bars to find the maximum amplitude of the MACD Histogram. It then normalizes the Range Oscillator values to match this amplitude.
4. Bands & Coloring:
o Slope Coloring: Both the MACD and the Oscillator change color based on their slope. Green indicates rising values (bullish pressure), and Red indicates falling values (bearish pressure).
o Fixed Bands: Horizontal bands are placed at +0.75 and -0.75 relative to the scaled data to act as Overbought and Oversold zones, with a yellow-tinted background for visibility.
How to Use This Indicator
• Trend Confirmation: When both the MACD line and the Range Oscillator are green, the trend is strongly bullish. When both are red, the trend is bearish.
• Contraction & Expansion: The yellow zone (between -0.75 and +0.75) represents the "equilibrium" or ranging area. Breakouts above the Upper Band (+0.75) usually signal strong expansion or overbought conditions, while drops below the Lower Band (-0.75) signal oversold conditions.
• The "Fill" Gap: The space between the Range Oscillator line and the MACD line is filled. A widening gap between these two metrics can indicate a divergence between pure price action (Range) and momentum (MACD).
• High/Low Marks: Small markers are plotted on the most recent 3 candles to show the exact High and Low oscillation points for short-term entries.
Settings Included
• Range Length & Multiplier: Adjust the sensitivity of the Range Oscillator.
• MACD Inputs: Customizable Fast, Slow, and Signal lengths, with options for SMA or EMA types.
• Visuals: Fully customizable colors for Rising/Falling trends, band opacity, and line thickness.
How this follows House Rules
1. Originality:
o Rule: You cannot simply upload a generic MACD.
o Compliance: This is not a standard MACD. It is a complex script that performs mathematical normalization to fit two different indicator types onto one scale. The "Dynamic Fitting" logic makes it unique.
2. Description Quality:
o Rule: You must explain the math and how to read the signals.
o Compliance: The description above details the "Weighted MA logic" and the "Dynamic Fitting" process. It avoids saying "Buy when Green" (which is low effort) and instead explains why it turns green (slope analysis).
3. Visuals:
o Rule: Plots must be clear and not cluttered.
o Compliance: The script uses overlay=false (separate pane). The specific colors you requested (#37ff0c, #ff0014, and the Yellow tint) are high-contrast and distinct, making the chart easy to read.
4. No "Holy Grail" Claims:
o Rule: Do not promise guaranteed profits.
o Compliance: The description uses terms like "Trend Confirmation" and "Signal," avoiding words like "Guaranteed," "Win-rate," or "No Repaint."

FAIRPRICE_VWAP_RDFAIRPRICE_VWAP_RD
This script plots an **anchored VWAP (Volume Weighted Average Price)** that resets
based on the user-selected anchor period. It acts as a dynamic “fair value” line
that reflects where the market has actually transacted during the chosen period.
FEATURES
- Multiple anchor options: Session, Week, Month, Quarter, Year, Decade, Century,
Earnings, Dividends, or Splits.
- Intelligent handling of the “Session” anchor so it works correctly on both 1m
(resets each new day) and 1D (continuous, non-resetting VWAP).
- Manual VWAP calculation using cumulative(price * volume) and cumulative(volume),
ensuring the line is stable and works on all timeframes.
- Optional hiding of VWAP on daily or higher charts.
- Offset input for horizontal shifting if desired.
- VWAP provides a true “fair price” reference for trend, mean-reversion,
and institutional-level analysis.
PURPOSE
This indicator solves the common problem of VWAP behaving incorrectly on higher
timeframes, on synthetic data, or with unusual anchors. By implementing VWAP
manually and allowing flexible reset conditions, it functions reliably as
an institutional-style fair value benchmark across any timeframe.

TREND_34EMA_RDTREND_34EMA_RD - Enhanced 34 EMA Trend Suite (Ryan DeBraal)
This indicator overlays a trend-adaptive 34 EMA along with optional ATR-based
volatility bands, trend-strength scoring, and crossover alerts. It is built
to give a clean, fast visual read on the current trend direction, volatility,
and momentum quality.
FEATURES
-----------------------------------------------------------------------------
• Core 34 EMA Trend Line
- Standard EMA calculation (default length 34)
- Aqua coloring for clean visibility
- Adjustable line thickness
• ATR-Based Volatility Bands
- Upper and lower bands derived from ATR
- Adjustable ATR length and multiplier
- Optional shaded channel for volatility visualization
- Helps identify trend stability and over-extension
• Trend Strength Score
- Measures slope of the EMA over a lookback window
- Normalizes slope using ATR for consistency across markets
- Outputs a 0–100 score
- Auto-updating label placed at the latest bar
• Gray for weak trend
• Orange for moderate trend
• Green for strong trend
• Optional Crossover Signals
- Detects when price crosses above or below the EMA
- Can display arrows on the chart
- Built-in alert conditions
PURPOSE
-----------------------------------------------------------------------------
This suite provides a clean, minimalistic way to monitor directional bias,
volatility, and trend quality. Ideal for:
• Identifying early trend shifts
• Confirming trend continuation
• Filtering trades based on trend strength
• Detecting over-extension using volatility bands

Watchlist Volume Surge AlertOverview
This indicator is designed for traders who monitor large watchlists and need instant notification when a stock is experiencing unusual volume activity relative to its recent history.
Standard volume indicators often include the current day's volume in the average calculation. This causes a problem: if a stock is having a massive breakout, that high volume pulls the average up immediately, making it harder to hit the "relative" threshold.
This script solves that by comparing the current volume against the Simple Moving Average (SMA) of the previous n bars. This ensures a clean baseline and accurate alerts, even during massive volatility.
Key Features
Smart RVOL Calculation: Calculates Relative Volume (RVOL) based on the previous 30 bars (adjustable), ensuring the current breakout doesn't skew the average.
Visual Clarity:
Bars: Normal volume is transparent. Surge volume turns bright Teal (Bullish Close) or Red (Bearish Close).
Background: The indicator panel background highlights when a surge is active, making it impossible to miss when scanning visually.
Data Window: Displays the exact RVOL ratio (e.g., 2.11) in the Data Window for verification.
Watchlist Alert Optimized: Specifically designed to work with TradingView's "Any alert function call" or standard condition alerts across multiple tickers.
How to Set Up Alerts
This script is perfect for setting a single alert on a large watchlist to catch breakouts as they happen.
Add the indicator to your chart.
Go to the Alerts menu and create a new alert.
Condition: Select Watchlist Volume Surge Alert.
Trigger: Select "Once Per Bar".
Note: Using "Once Per Bar" ensures you are notified the moment the volume crosses the threshold during the trading day, rather than waiting for the market to close.
Message: The script includes a dynamic message: "Volume Surge! {{ticker}} volume is {{plot("RVOL Ratio")}}x the average."
Settings
Average Length (Days): The lookback period for the volume average (Default: 30).
Alert Threshold (x Average): The multiple required to trigger an alert (Default: 1.5x).
Note: This works better when you have a watchlist with similar volatility and/or market cap

Market Regime & Bias Assistant [Prototype v1.1]
Market Regime & Bias Assistant
### **Overview**
The **Market Regime & Bias Assistant** is an all-in-one trend filtration and trading system designed to keep traders on the right side of the market. Instead of relying on a single moving average, this indicator combines **ADX (Trend Strength)**, **Multi-Timeframe EMAs**, **RSI**, and **Volume Spread Analysis (VSA)** concepts to generate a quantitative "Confidence Score" for the current market bias.
It automatically adapts its settings based on your timeframe (Intraday vs. Swing) and provides clear visual cues via background shading, candle coloring, and a data panel.
---
### **Key Features**
* **Auto-Adaptive Modes:** Automatically switches between "Intraday" and "Swing" settings based on your timeframe.
* *Intraday:* Uses faster EMAs (Aggressive 9/30 or Conservative 20/50) and VWAP.
* *Swing:* Uses standard 20/50 EMAs with 200/800 long-term context moving averages.
* **Market Regime Detection:** Identifies if the market is in a **Trend (Bull/Bear)** or a **Range (Neutral)** using a combination of ADX thresholds and EMA alignment.
* **Confidence Scoring (0-100):** A proprietary algorithm that scores the quality of the trend based on RSI alignment, Volume confirmation, and Long-term EMA context.
* **Vector Volume Candles:** Color-coded candles to highlight institutional activity (High Volume) vs. Climactic Volume (Exhaustion).
* **Pullback Signals:** "L" and "S" markers indicating high-probability entries after a pullback into the EMA value zone.
* **Data Dashboard:** A bottom-right panel displaying the current Mode, Regime, Bias, and quantitative Confidence Score.
---
### **How to Read the Visuals**
#### **1. Background Colors (The Regime)**
* **Green Background:** Confirmed **Bullish Trend**. Only look for Longs.
* **Red Background:** Confirmed **Bearish Trend**. Only look for Shorts.
* **Gray Background:** **Neutral / Range**. The market is chopping or consolidating. Stand aside or trade strictly mean-reversion.
#### **2. Candle Colors (Vector Volume)**
* **Green/Red Borders:** Normal volume.
* **Blue / Fuchsia:** **High Volume (1.2x Average)**. Indicates institutional interest or a breakout.
* **Lime / Bright Red:** **Climactic Volume (1.8x Average)**. Indicates potential exhaustion or a stopping volume event.
#### **3. The EMAs**
* **Fast/Slow Lines:** Show the immediate trend direction.
* **Gray/White Lines:** The 200 and 800 EMAs. These act as major support/resistance levels and define the "Big Picture" bias.
* **Lime Line (Intraday Only):** The VWAP (Volume Weighted Average Price).
---
### **How to Use This Indicator**
**Step 1: Check the Regime**
Look at the background color and the Dashboard panel. Is the Trend Strength "Strong" or "Very Strong"?
* *Rule:* Do not take trend-following trades if the Regime is "Range/Neutral."
**Step 2: Check the Confidence**
The dashboard calculates a score from 0 to 100.
* **High Confidence (>67):** All systems go. Alignment of RSI, Volume, and Trend.
* **Medium Confidence (34-66):** Caution warranted. Usually implies divergence in RSI or low volume.
* **Low Confidence (<34):** The trend is weak or failing.
**Step 3: Wait for the Setup (The Arrows)**
The indicator looks for pullbacks into the "Value Zone" (the space between the Fast and Slow EMA).
* **Triangle Up (L):** Appears when price pulls back into the zone during a Bull trend, then bounces out with volume confirmation.
* **Triangle Down (S):** Appears when price rallies into the zone during a Bear trend, then rejects lower.
---
### **Settings & Customization**
* **Mode:** Default is "Auto," but you can force "Intraday" or "Swing" manually.
* **Intraday Style:** Choose between "Aggressive" (9 EMA / 30 EMA) for scalping or "Conservative" (20 EMA / 50 EMA) for day trading.
* **ADX Threshold:** Adjusts how strict the trend filter is (Default: 20).
* **Visual Toggles:** Turn off/on the Panel, Background shading, or Vector candles to clean up your chart.
### **Alerts**
This script comes with built-in alert conditions for:
1. **Bullish Regime Start**
2. **Bearish Regime Start**
3. **High-Confidence Setup Detected**

RSI < 25 + Price Below 200 SMA (4H) - Text Signal
Price below 200MA on 4hr chart
RSI is below 25 ovsersold
Start buying small positions at every signal
Eventually price will capture the 200MA on 4hr
This will work great for NVDA, AAPL, MSFT, NFLX, PANW, AMZN, PLTR, CRWD and META.
Good for swing trading based on price action, RSI oversold and reversal
Add more on the Pin bar candles on 4hr time frame once the price is oversold.
