Machine Learning: STDEV Oscillator [YinYangAlgorithms]This Indicator aims to fill a gap within traditional Standard Deviation Analysis. Rather than its usual applications, this Indicator focuses on applying Standard Deviation within an Oscillator and likewise applying a Machine Learning approach to it. By doing so, we may hope to achieve an Adaptive Oscillator which can help display when the price is deviating from its standard movement. This Indicator may help display both when the price is Overbought or Underbought, and likewise, where the price may face Support and Resistance. The reason for this is that rather than simply plotting a Machine Learning Standard Deviation (STDEV), we instead create a High and a Low variant of STDEV, and then use its Highest and Lowest values calculated within another Deviation to create Deviation Zones. These zones may help to display these Support and Resistance locations; and likewise may help to show if the price is Overbought or Oversold based on its placement within these zones. This Oscillator may also help display Momentum when the High and/or Low STDEV crosses the midline (0). Lastly, this Oscillator may also be useful for seeing the spacing between the High and Low of the STDEV; large spacing may represent volatility within the STDEV which may be helpful for seeing when there is Momentum in the form of volatility.
Tutorial:
Above is an example of how this Indicator looks on BTC/USDT 1 Day. As you may see, when the price has parabolic movement, so does the STDEV. This is due to this price movement deviating from the mean of the data. Therefore when these parabolic movements occur, we create the Deviation Zones accordingly, in hopes that it may help to project future Support and Resistance locations as well as helping to display when the price is Overbought and Oversold.
If we zoom in a little bit, you may notice that the Support Zone (Blue) is smaller than the Resistance Zone (Orange). This is simply because during the last Bull Market there was more parabolic price deviation than there was during the Bear Market. You may see this if you refer to their values; the Resistance Zone goes to ~18k whereas the Support Zone is ~10.5k. This is completely normal and the way it is supposed to work. Due to the nature of how STDEV works, this Oscillator doesn’t use a 1:1 ratio and instead can develop and expand as exponential price action occurs.
The Neutral (0) line may also act as a Support and Resistance location. In the example above we can see how when the STDEV is below it, it acts as Resistance; and when it’s above it, it acts as Support.
This Neutral line may also provide us with insight as towards the momentum within the market and when it has shifted. When the STDEV is below the Neutral line, the market may be considered Bearish. When the STDEV is above the Neutral line, the market may be considered Bullish.
The Red Line represents the STDEV’s High and the Green Line represents the STDEV’s Low. When the STDEV’s High and Low get tight and close together, this may represent there is currently Low Volatility in the market. Low Volatility may cause consolidation to occur, however it also leaves room for expansion.
However, when the STDEV’s High and Low are quite spaced apart, this may represent High levels of Volatility in the market. This may mean the market is more prone to parabolic movements and expansion.
We will conclude our Tutorial here. Hopefully this has given you some insight into how applying Machine Learning to a High and Low STDEV then creating Deviation Zones based on it may help project when the Momentum of the Market is Bullish or Bearish; likewise when the price is Overbought or Oversold; and lastly where the price may face Support and Resistance in the form of STDEV.
If you have any questions, comments, ideas or concerns please don't hesitate to contact us.
HAPPY TRADING!
Moving_average

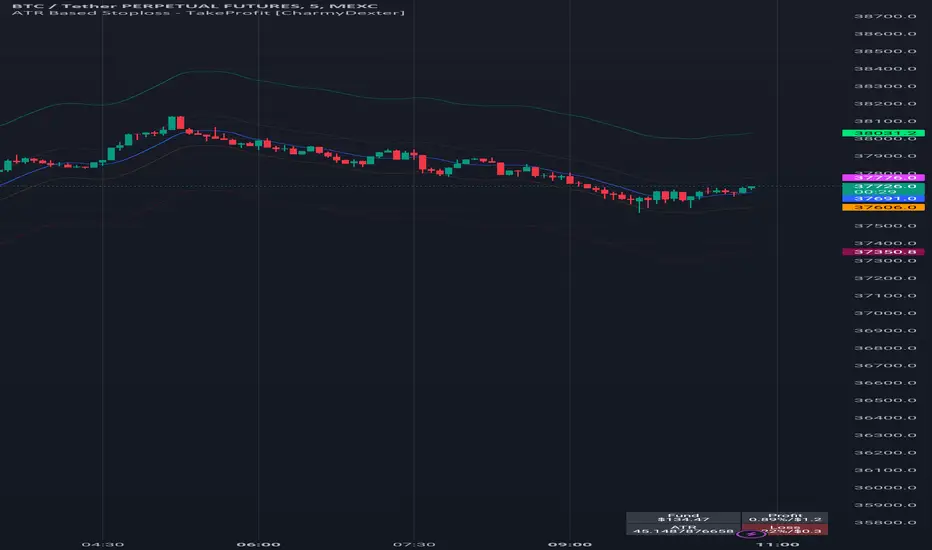
ATR Based Stoploss - TakeProfit [CharmyDexter]
This script combines the power of Average True Range (ATR) and a Moving Average (MA) to dynamically set stop-loss and take-profit levels. It introduces a volatility surge condition and includes a risk management table for comprehensive trade insights.
1) **Originality:**
- This script is original in its approach to combining Average True Range (ATR) with a Moving Average (MA) to create a dynamic stop-loss and take-profit strategy. The addition of a volatility surge condition and the inclusion of a risk management table further contribute to its uniqueness.
2) **Functionality:**
- The script aims to provide traders with a dynamic stop-loss and take-profit strategy based on ATR, incorporating a volatility surge condition and a moving average. The risk management table displays crucial information, including the fund size, potential profit/loss, ATR values, and risk.
3) **Operation:**
- The script uses ATR to calculate volatility, identifying surges in volatility. It adjusts the stop-loss and take-profit levels based on the average of ATR during these surge periods. The moving average acts as a trend indicator, and the script dynamically adjusts stop-loss and take-profit levels accordingly.
4) **Usage:**
- Traders can use this script by applying it to their preferred financial instrument's chart. The script automatically plots the moving average and dynamically adjusts stop-loss and take-profit levels based on ATR and volatility surges. Users can observe the levels on the chart for potential trade management.
5) **Concepts:**
- The script employs concepts of ATR for volatility, moving average for trend identification, and a dynamic adjustment mechanism during volatility surges. Risk management is incorporated by calculating potential profit/loss percentages based on user-defined risk.
6) **Mashup Explanation:**
- The script combines ATR, moving average, and volatility conditions to create a comprehensive strategy. ATR determines the market's volatility, the moving average serves as a trend indicator, and volatility surges trigger dynamic adjustments to stop-loss and take-profit levels. The risk management table enhances the script's utility.
7) **Line Descriptions:**
- Blue Line (Moving Average): Indicates the trend direction.
- Lime Line (Long Take Profit): Represents the level for taking profit in a long position.
- Maroon Line (Short Take Profit): Represents the level for taking profit in a short position.
- Fuchsia Line (Short Stop Loss): Represents the level for setting a stop loss in a short position.
- Orange Line (Long Stop Loss): Represents the level for setting a stop loss in a long position.
8) **Line Usage:**
- Use the blue line for trend identification.
- When taking long positions, the close should be above the blue line.
- For long positions, the lime line is a potential take-profit level, and the orange line is a potential stop-loss level.
- For short positions, the maroon line is a potential take-profit level, and the fuchsia line is a potential stop-loss level.
- The risk management table provides insights into fund size, potential profit/loss, ATR values, and risk.
Note: The profit/loss calculations in this script may not be entirely accurate due to factors like market execution. Market execution may not always occur at the exact levels specified by the script due to slippage or delays in order processing. This can impact the realized profit or loss compared to the calculated levels.
It is crucial to note that this ATR Based Stop-loss - Take-Profit indicator is merely one tool among many that traders can employ to establish trading targets. Additional technical indicators are essential for taking trades and making informed decisions.
Commented-out sections for alerts and shape plotting are provided, allowing for visual and auditory notifications if desired.
It's crucial for traders to be aware of these factors and use the script as a tool within a broader trading strategy. Additionally, regular monitoring and adjustments based on real-time market conditions are recommended to enhance the accuracy of profit/loss assessments.
SMA Cross with a Price FilterA moving average strategy generates an entry (buy) signal when the price goes above the moving average, and an exit (sell) signal when the price goes below the moving average. But it gives lots of whipsaws and noise depends on the moving average we use. A fast moving average gives more whipsaws and a slow moving average gives less whipsaws. To reduce the noise/whipsaws, we can add a filter on a fast/slow moving average. It will improve entry/exit performance significantly specially for those who don't want to watch the market actively.
I created this indicator with a price filter. This means the price of an underlying asset must be at least a specific percentage above its moving average to generate a buy signal and a specific percentage below its moving average to generate a sell signal. This price filter can also be a confirmation after the price crosses above/below its SMA. I couldn't find any indicator yet based on this idea. So I wrote this indicator and publishing it so it helps those who are interested.
I use 200 SMA and 3% price filter as default and using SPY as an example. So,
ENTRY signal when the closing price of SPY is 3% above its 200 SMA.
EXIT signal when the closing price of SPY is 3% below its 200 SMA.
Enjoy and let me know if it works.
** This chart only generates entry (buy) and exit (sell) signals. Please, do your own diligence to make any investment or trading decisions.

[KVA] Extremes ProfilerExtremes Profiler is a specialized indicator crafted for traders focusing on the relationship between price extremes and moving averages. This tool offers a comprehensive perspective on price dynamics by quantifying and visualizing significant distances of current prices from various moving averages. It effectively highlights the top extremes in market movements, providing key insights into price extremities relative to these averages. The indicator's ability to analyze and display these distances makes it a valuable tool for understanding market trends and potential turning points. Traders can leverage the Extremes Profiler to gain a deeper understanding of how prices behave in relation to commonly watched moving averages, thus aiding in making informed trading decisions
Key Features :
Extensive MA Analysis : Tracks the price distance from multiple moving averages including EMA, SMA, WMA, RMA, and HMA.
Top 50 (100) Distance Metrics : Highlights the 50 (100)greatest (highest or lowest) distances from each selected MA, pinpointing significant market deviations.
Customizable Periods : Offers flexibility with adjustable periods to align with diverse trading strategies.
Comprehensive View : Switch between timeframes for a well-rounded understanding of short-term fluctuations and long-term market trends.
Cross-Asset Comparison : Utilize the indicator to compare different assets, gaining insights into the relative dynamics and volatility of various markets. By analyzing multiple assets, traders can discern broader market trends and better understand asset-specific behaviors.
Customizable Display : Users can adjust the periods and number of results to suit their analytical needs.

K`s Extreme DurationExtreme duration uses a special combination of the RSI and its relative position to deliver a reversal signal.
The following are the conditions to generate signals:
* Bullish signal: The current 8-period RSI is below 50 and above 35 while the previous 5 RSI's are below 35.
* Bearish signal: The current 8-period RSI is above 50 and below 65 while the previous 5 RSI's are above 65.

Smart MAThe Smart MA indicator is a tool designed for traders seeking insights into market trends, with its foundation rooted in moving averages. It offers two distinctive color options, with "Crossing" as the default choice and "Direction" as an alternative. Let's delve deeper into these options:
1. "Crossing" Color Option (Default):
Key Features:
Utilizes the interaction between fast and slow moving averages.
The color of the base moving average (MA) line dynamically changes based on crossovers between these moving averages.
Offers real-time visual signals for potential shifts in market sentiment.
Interpretation:
With the "Crossing" color option as the default setting, the base MA line's color responds to the interaction of the fast and slow moving averages.
A crossover where the fast MA crosses above the slow MA may prompt the base MA line to change to a bullish color (e.g., teal), indicating a potential bullish trend.
Conversely, if the fast MA crosses below the slow MA, the base MA line's color may alter to represent a bearish sentiment (e.g., red). This color shift provides a visual marker for a potential bearish trend, potentially guiding traders towards shorting opportunities.
2. "Direction" Color Option:
Key Features:
Focuses on the directional trend of the base moving average (MA).
The color of the base MA line signifies the direction in which the base MA is moving.
Aids in quickly identifying the prevailing market trend.
Interpretation:
Uptrend - Bullish Direction: When the base MA slopes upward, indicating an average price increase over the chosen base MA length, the base MA line's color may shift to a bullish hue (e.g., teal). This visual cue signals a potential uptrend, suggesting favorable long positions.
Downtrend - Bearish Direction: If the base MA slopes downward, signifying an average price decrease over the selected base MA length, the base MA line could change to a bearish shade (e.g., red). This color shift acts as an indicator of a potential downtrend, implying possible opportunities for shorting.
Customization:
Both color options allow traders to adjust the indicator's parameters, including base MA length, MA type, fast MA length, and slow MA length, to align with their trading strategies and preferred timeframes.
In summary, the Smart MA indicator, based on moving averages, provides traders with two color options: the default "Crossing" and "Direction" as an alternative. The "Crossing" option leverages fast and slow moving averages to offer real-time visual cues for dynamic market shifts. The "Direction" option simplifies trend analysis by focusing on the directional trend of the base MA. The choice between these options depends on your trading style and the depth of analysis you require. With the Smart MA indicator, you're equipped to make informed trading decisions in today's financial markets.

Machine Learning: VWAP [YinYangAlgorithms]Machine Learning: VWAP aims to use Machine Learning to Identify the best location to Anchor the VWAP at. Rather than using a traditional fixed length or simply adjusting based on a Date / Time; by applying Machine Learning we may hope to identify crucial areas which make sense to reset the VWAP and start anew. VWAP’s may act similar to a Bollinger Band in the sense that they help to identify both Overbought and Oversold Price locations based on previous movements and help to identify how far the price may move within the current Trend. However, unlike Bollinger Bands, VWAPs have the ability to parabolically get quite spaced out and also reset. For this reason, the price may never actually go from the Lower to the Upper and vice versa (when very spaced out; when the Upper and Lower zones are narrow, it may bounce between the two). The reason for this is due to how the anchor location is calculated and in this specific Indicator, how it changes anchors based on price movement calculated within Machine Learning.
This Indicator changes the anchor if the Low < Lowest Low of a length of X and likewise if the High > Highest High of a length of X. This logic is applied within a Machine Learning standpoint that likewise amplifies this Lookback Length by adding a Machine Learning Length to it and increasing the lookback length even further.
Due to how the anchor for this VWAP changes, you may notice that the Basis Line (Orange) may act as a Trend Identifier. When the Price is above the basis line, it may represent a bullish trend; and likewise it may represent a bearish trend when below it. You may also notice what may happen is when the trend occurs, it may push all the way to the Upper or Lower levels of this VWAP. It may then proceed to move horizontally until the VWAP expands more and it may gain more movement; or it may correct back to the Basis Line. If it corrects back to the basis line, what may happen is it either uses the Basis Line as a Support and continues in its current direction, or it will change the VWAP anchor and start anew.
Tutorial:
If we zoom in on the most recent VWAP we can see how it expands. Expansion may be caused by time but generally it may be caused by price movement and volume. Exponential Price movement causes the VWAP to expand, even if there are corrections to it. However, please note Volume adds a large weighted factor to the calculation; hence Volume Weighted Average Price (VWAP).
If you refer to the white circle in the example above; you’ll be able to see that the VWAP expanded even while the price was correcting to the Basis line. This happens due to exponential movement which holds high volume. If you look at the volume below the white circle, you’ll notice it was very large; however even though there was exponential price movement after the white circle, since the volume was low, the VWAP didn’t expand much more than it already had.
There may be times where both Volume and Price movement isn’t significant enough to cause much of an expansion. During this time it may be considered to be in a state of consolidation. While looking at this example, you may also notice the color switch from red to green to red. The color of the VWAP is related to the movement of the Basis line (Orange middle line). When the current basis is > the basis of the previous bar the color of the VWAP is green, and when the current basis is < the basis of the previous bar, the color of the VWAP is red. The color may help you gauge the current directional movement the price is facing within the VWAP.
You may have noticed there are signals within this Indicator. These signals are composed of Green and Red Triangles which represent potential Bullish and Bearish momentum changes. The Momentum changes happen when the Signal Type:
The High/Low or Close (You pick in settings)
Crosses one of the locations within the VWAP.
Bullish Momentum change signals occur when :
Signal Type crosses OVER the Basis
Signal Type crosses OVER the lower level
Bearish Momentum change signals occur when:
Signal Type crosses UNDER the Basis
Signal Type Crosses UNDER the upper level
These signals may represent locations where momentum may occur in the direction of these signals. For these reasons there are also alerts available to be set up for them.
If you refer to the two circles within the example above, you may see that when the close goes above the basis line, how it mat represents bullish momentum. Likewise if it corrects back to the basis and the basis acts as a support, it may continue its bullish momentum back to the upper levels again. However, if you refer to the red circle, you’ll see if the basis fails to act as a support, it may then start to correct all the way to the lower levels, or depending on how expanded the VWAP is, it may just reset its anchor due to such drastic movement.
You also have the ability to disable Machine Learning by setting ‘Machine Learning Type’ to ‘None’. If this is done, it will go off whether you have it set to:
Bullish
Bearish
Neutral
For the type of VWAP you want to see. In this example above we have it set to ‘Bullish’. Non Machine Learning VWAP are still calculated using the same logic of if low < lowest low over length of X and if high > highest high over length of X.
Non Machine Learning VWAP’s change much quicker but may also allow the price to correct from one side to the other without changing VWAP Anchor. They may be useful for breaking up a trend into smaller pieces after momentum may have changed.
Above is an example of how the Non Machine Learning VWAP looks like when in Bearish. As you can see based on if it is Bullish or Bearish is how it favors the trend to be and may likewise dictate when it changes the Anchor.
When set to neutral however, the Anchor may change quite quickly. This results in a still useful VWAP to help dictate possible zones that the price may move within, but they’re also much tighter zones that may not expand the same way.
We will conclude this Tutorial here, hopefully this gives you some insight as to why and how Machine Learning VWAPs may be useful; as well as how to use them.
Settings:
VWAP:
VWAP Type: Type of VWAP. You can favor specific direction changes or let it be Neutral where there is even weight to both. Please note, these do not apply to the Machine Learning VWAP.
Source: VWAP Source. By default VWAP usually uses HLC3; however OHLC4 may help by providing more data.
Lookback Length: The Length of this VWAP when it comes to seeing if the current High > Highest of this length; or if the current Low is < Lowest of this length.
Standard VWAP Multiplier: This multiplier is applied only to the Standard VWMA. This is when 'Machine Learning Type' is set to 'None'.
Machine Learning:
Use Rational Quadratics: Rationalizing our source may be beneficial for usage within ML calculations.
Signal Type: Bullish and Bearish Signals are when the price crosses over/under the basis, as well as the Upper and Lower levels. These may act as indicators to where price movement may occur.
Machine Learning Type: Are we using a Simple ML Average, KNN Mean Average, KNN Exponential Average or None?
KNN Distance Type: We need to check if distance is within the KNN Min/Max distance, which distance checks are we using.
Machine Learning Length: How far back is our Machine Learning going to keep data for.
k-Nearest Neighbour (KNN) Length: How many k-Nearest Neighbours will we account for?
Fast ML Data Length: What is our Fast ML Length? This is used with our Slow Length to create our KNN Distance.
Slow ML Data Length: What is our Slow ML Length? This is used with our Fast Length to create our KNN Distance.
If you have any questions, comments, ideas or concerns please don't hesitate to contact us.
HAPPY TRADING!

Fisher+ [OSC]The Fisher Transform Indicator is classified as an oscillator, meaning that its value swings above and below a central point. This characteristic allows traders to identify overbought and oversold conditions, providing potential clues about market reversals. As mentioned previously, it is an oscillator so the strength of the move is displayed by how long the fisher line stays above/below zero. Indicator can be used to aid in confluence near supply/demand zones.
White Line = Fisher
Red/Blue Line = Moving Average
--Changes color whether fisher line is above/below the MA
Red/Blue Shaded Line = Moving Average
--Changes color based on a smoothing factor
Red/Blue Shaded Fill = Asset in Overbought/Oversold Conditions
Red/Blue Circles = Asset in Extreme Overbought/Oversold Conditions
Red/Blue Triangles = MACD Signals Below/Above "0"
Divergence Labels = Asset Signaling Divergence
The moving average line will turn red/blue as long as the fisher line is below/above the moving average. The shaded MA line will switch colors based on if it is moving in an up/down trend. The MA can also be used as a signal and treated similar to an oscillator. Market trending conditions will either keep the MA below/above the dashed zero line.
MACD code credited to LazyBear's MACD Leader indicator. It is used to filter out/confirm any signals such as divergences. As long as the MACD Leader line is above both the MACD line and signal lines then it'll signal with with a triangle. MACD divergences will be added at a later time.

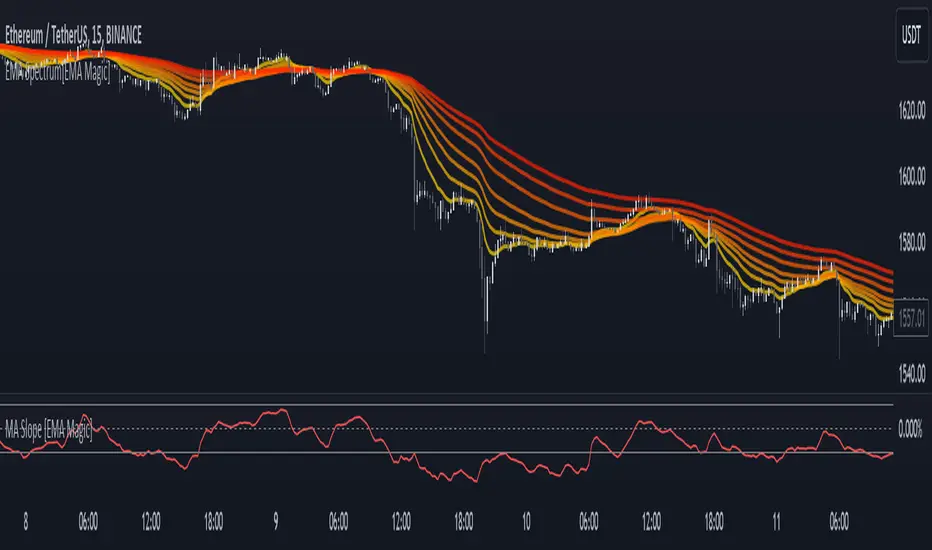
MA Slope [EMA Magic]█ Overview:
The MA Slope calculates the slope based on a given moving average.
The Moving Average Slope indicator allows you to identify the direction and the strength of a trend.
It calculates the rate of change in percentage based on the user-defined moving average.
█ Calculation: This indicator calculates the slope based on the changes of moving average and normalizes it with Average True Range(ATR).
The default value of ATR is 7.I recommend not changing it unless you know exactly what are you doing.
█ Input Settings:
The settings are divided into three sections:
The first section is for time frame adjustments. Modify it separately from the chart, Allows you to use moving averages from different time frames.
In the second section, you can configure the base calculation,including Moving Average and Average True Range(ATR) settings.
In the third section, you can detect breakout and sudden change signals, which are highlighted in the background of the indicator.
Note that When you change the breakout limit value, it also affects the band limit indicator on your chart.
To avoid signal confusion, use only one at a time.
Here is the example the breakout signals:
█ Usage:
When the slope is increasing, it indicates an uptrend.
When the slope is decreasing, it indicates a downtrend.
When the slope is moving around zero and choppy, it indicates no specific trend or price is in a range zone.
Uptrend and Range Zone example:
Downtrend example:
Slope peaks on extreme levels can signal a potential trend reversal point.
Breakout of the upper or lower bands can be translated into a trading signal.Indicating that price will probably continue to move in the direction of the breakout.
Favor long setups when the slope is increasing or it is positive and favor short setups when the slope is decreasing or it is negative.
Fits with any moving average you use, e.g., EMA, WMA, MA Ribbon, and more.
█ Alert
Alerts are available for both signal conditions.
█ Recap
Take the time to study price movements alongside this indicator for a deeper understanding.Whether you're a novice or experienced trader, this indicator can come helpful
Hull WavesThe Hull Waves indicator is based on the Hull Moving Averages (HMA), which are special moving averages that stand out for their ability to filter out market noise and offer a clearer view of price trends. Compared to traditional moving averages, HMAs are more responsive yet smoother, allowing traders to capture significant price movements without getting overwhelmed by short-term fluctuations.
The HMAs integrated into Hull Waves provide two distinct perspectives on the price trend:
8-period HMA: This short-term HMA is extremely reactive and closely follows price changes. It is ideal for capturing short-term trading signals while the medium-term 21-period HMA offers a more balanced view of price trends and identifies medium-term trends.
By crossing HMAs, traders can efficiently identify trend reversal points or strong market continuations.
Another feature of the indicator is the “fan” of dynamic lines, which acts as a visual float for price candles, allowing traders to quickly evaluate trading opportunities.
The "fan" or float of dynamic lines represents a visual representation of the candle's price movements. These lines extend from the start point to the end point, like an open fan. This visual approach makes the market dynamics immediately evident.
Strategy:
Long Entry Signal (Buy):
When the Hull Waves range shows a series of upward sloping lines and the Hull Moving Averages (e.g. 8-period HMA) crosses the 21-period HMA upwards, it is a long entry signal.
Confirmation of the signal can come from an increase in trader volume or other supporting indicators.
Place a buy order at the next closing price.
Short Entry Signal (Sell):
When the Hull Waves range shows a series of downward sloping lines and the Hull Moving Averages (e.g. 8-period HMA) crosses the 21-period HMA downward, it is a short entry signal.
Confirm the signal with an increase in trader volume or other relevant indicators.
Place a sell order at the next closing price.
Exit Signal (Closing a Position):
To close a long position, wait for a signal reversal, such as the Hull Moving Averages crossing downwards or a change in the Hull Waves range.
To close a short position, wait for a signal reversal, such as the Hull Moving Averages crossing higher or a change in the Hull Waves range.

Crossover EMMMCrossover EMMM is an indicator that displays the Madrid Moving Averages (EMMM) and detects crossovers (upward crossings) and crossunders (downward crossings) between two moving averages. It uses two input parameters to define the fast and slow EMMM lengths. The script calculates the EMMM values, their changes, and assigns colors based on the change direction. The fast EMMM is plotted in green or red, and the slow EMMM is plotted in blue or red, depending on the change direction. The script also displays triangle shapes below or above the bars to indicate crossovers and crossunders.
The "Madrid Moving Average" (EMMMM) is a type of moving average used in technical analysis to smooth price fluctuations of financial assets, such as stocks or currency pairs. Unlike the Simple Moving Average (SMA), which treats all data equally, the EMMM gives more weight to recent data. This results in the EMMM responding more swiftly to price changes, making it well-suited for identifying short-term trends.
Donchian MA Bands [LuxAlgo]The Donchian MA Bands script is a complete trend indicator derived from the popular Donchian channel indicator as well as various customizable moving averages to estimate trend direction and build support/resistance levels & zones.
🔶 USAGE
The indicator outputs various elements, the main ones being a lower dynamic zone (blue by default), an upper dynamic zone (in orange by default), and one support and resistance level/zones (red/green by default).
A prominent lower zone is indicative of an uptrend, while a prominent upper zone is indicative of a downtrend. These zones can be used as support/resistance as well.
Support/resistance zones and levels can be used using a breakout methodology or to determine price bounced if a level was tested multiple times.
The indicator contains various modes affecting the output of the indicator, described below.
🔹 Clouds
Clouds return one upper/lower dynamic zone and look/act similarly to a trailing stop. Price over the lower zone is indicative of an uptrend, and price under the upper zone is indicative of a downtrend.
🔹 Upper Band
The upper band mode returns a dynamic zone closer to prices during an uptrend, and farther away during a downtrend.
This band can act as a support during uptrends.
🔹 Lower Band
The lower band mode returns a dynamic zone closer to prices during an uptrend, and farther away during a downtrend.
This band can act as a resistance during downtrends.
🔹 Bands
Bands return both upper and lower zones, the zones are more apparent depending on the price trend direction, with uptrends being indicated by a more visible lower zone, and downtrends being indicated by a more visible upper zone.
Breakout dots are highlighted when price breakout the indicator displayed extremities, and can be indicative of a confirmed trend reversal.
These breakouts can be more effective for trend following during trending markets. Ranging markets might return breakouts highlighting the top/bottom.
🔶 DETAILS
The core of this script is the highest / lowest mean average (MA) value for a given number of bars back ( Donchian lines).
This is repeated a few times with the obtained values.
When Bands are chosen ( Style ) this will be repeated 1 more time.
The type of mean average can be customized ( Type MA ), as well as the number of bars back ( Length ).
Depending on the choice of bands ( Style ) the script will focus on certain area's of interest.
When the option Clouds , Upper band or Lower band is chosen, an extra feature, support/resistance (S/R), will be shown.
These color-filled areas are visible when there is a difference between the 2nd and 3rd highest/lowest values.
The lines/areas can be used for stop loss, entry, exit,...
You can set the type of MA and Length separately ( Settings -> S/R ).
If you don't need this feature, simply set Type ( Settings -> S/R ) -> NONE
The shape sometimes resembles triangles, indicating a potential direction
Default the average of the highest and lowest values is plotted (Style -> Mid Donchian)
This can act as potential support/resistance or visualization of the trend, the mean average is not plotted but can be (Style -> MA)
🔹 Note
When the option Bands is chosen, an indication is plotted when the closing price breaks above the highest band or breaks below the lower band. This isn't necessarily a buy/sell signal, it is merely a signal that these lines are broken.
Users should decide on their own how they use the bands/lines/areas as entry, exit, trailing stop, stop loss, profit taking,...
🔶 SETTINGS
🔹 Bands
Style: Clouds (default), Upper band, Lower band, Bands
Type MA: choose between SMA, EMA, RMA, HullMA, WMA, VWMA (default), DEMA, TEMA, NONE (off)
Length: Length of moving average and Donchian calculations (default 20)
Colour Bands
🔹 S/R (Support/Resistance, visible with Clouds, Upper band or Lower band)
Type MA: choose between SMA, EMA, RMA, HullMA, WMA, VWMA (default), DEMA, TEMA, NONE (off)
Length: Length of moving average and Donchian calculations (default 20)
Colour S/R

Ehlers DecyclerJohn F. Ehlers introuced Decycler in his book "Cycle Analytics for Traders", chapter 4.
The decycler is designed to remove the influence of shorter cycle fluctuations, resulting in an output that closely resembles a one-pole low-pass filter.
A standout feature of the decycler is its notably minimal lag. The most extended cycle elements experience a delay of less than five bars. When considering a frequency of 0.05 cycles per bar (equivalent to a 20-bar cycle period), the lag approximates 1.5 bars. Components with a higher frequency face even lesser delays. Consequently, any higher-frequency variations that pass the filter's attenuation align closely with the price fluctuations. This makes the decycler an optimal "immediate trend detector," giving a true depiction of the data's trend.
While the SuperSmoother filter can yield a comparably smoothed output, the decycler typically exhibits less lag when the two are juxtaposed. It's worth noting that the decycler operates as a one-pole filter, implying it doesn't have the best filtering capabilities. It's not advisable to use the decycler as a smoothing filter to eliminate aliasing disturbances. Instead, its application should focus on generating an immediate trend representation, especially when choosing a larger cutoff period. The broad cutoff period equips the decycler with the ability to reduce aliasing disturbances, given that it's significantly distant from the Nyquist frequency.
There are already several decycler indicators on Tradingview, but I like to structure the code and highlight the main components as functions rather than hiding them in the code. I hope this is useful for those who are starting to learn Pine Script.

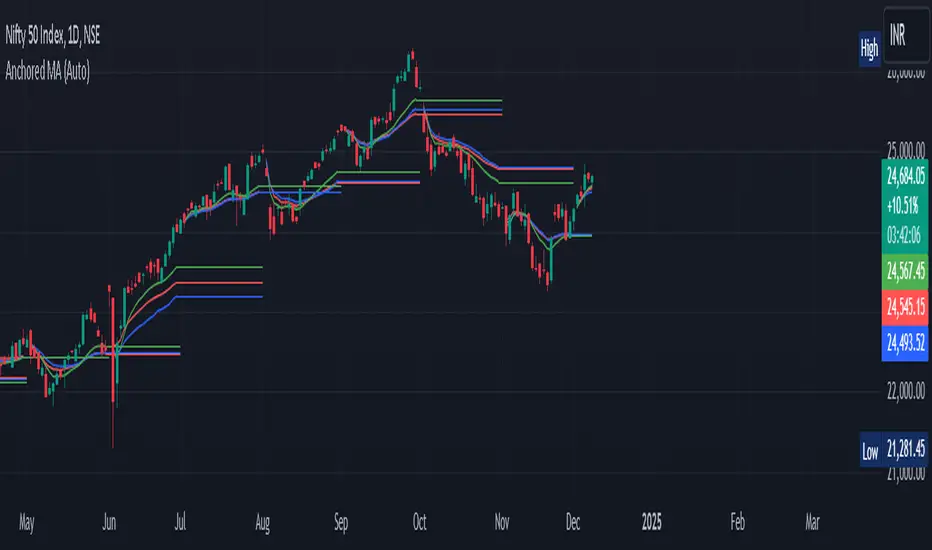
Anchored Moving Average By Market Mindset - Zero To EndlessAnchored Moving Average?
An anchored moving average (AMA) is created when you select a point on the chart and start calculating the moving average from there. Thus the moving average’s denominator is not fixed but cumulative and dynamic.
In this indicator, I've provided three different types of Anchored Moving Averages, viz., WMA, SMA and VWAP.
WMA is relevant if big moves are there.
SMA is relevant if volume data is not to be considered or if it is not available.
VWAP is the standard anchored MA, which is most commontly used. Is consider the volume data along with the price move.
In this indicator, Auto anchor is time based anchor. A trader can opt for Pivot Type Anchor or Volume Type Anchor or some higher resolution based anchor too. The length of the pivot lookback can also be changed by the user.
It can be used for intraday, swing trading and even for technical based investment purpose.
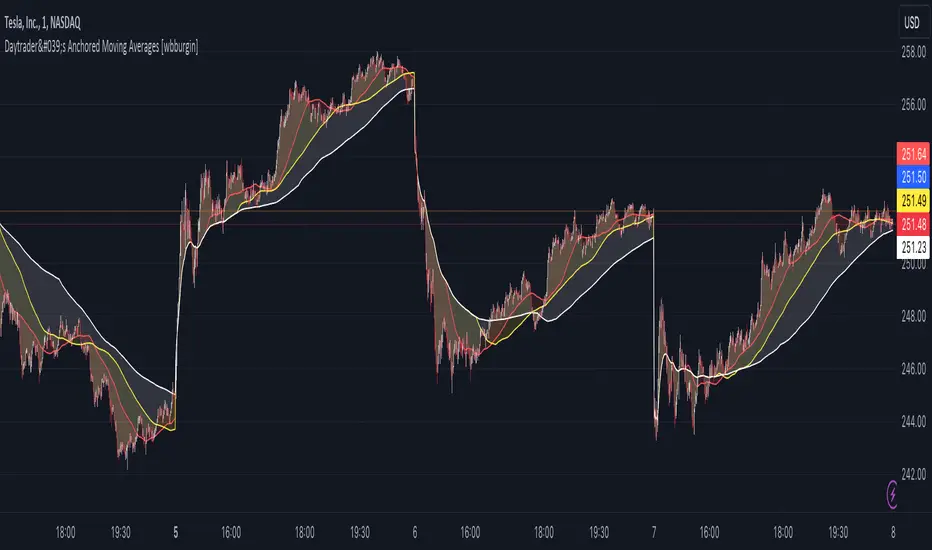
Day Trader's Anchored Moving Averages [wbburgin]For day traders, establishing a trend at the start of the day is critically important for setting targets and entering positions. This can be difficult when traditional moving averages lag from previous days, causing late entry and/or incorrect trend interpretation.
The Day Trader's Anchored MA indicator plots three dynamic moving averages which restart on each new period (session or monthly - more coming soon). This eliminates the lag in traditional moving averages while better identifying the trend, as the moving averages essentially 'build up' their lengths as the day progresses, until they reach your chosen maximum length.
This means that these anchored moving averages are
Quicker to identify the start-of-day trend, as markets tend to establish and then follow one trend throughout the day;
Dynamically increasing throughout the day (to your specifications)
Completely independent from previous days
Quick usage note: make sure that your moving average length is less than the number of bars in the period, or it won't reach the maximum length you specified.
TL;DR: Moving average that resets every day and does not lag. Inspired by the VWAP.
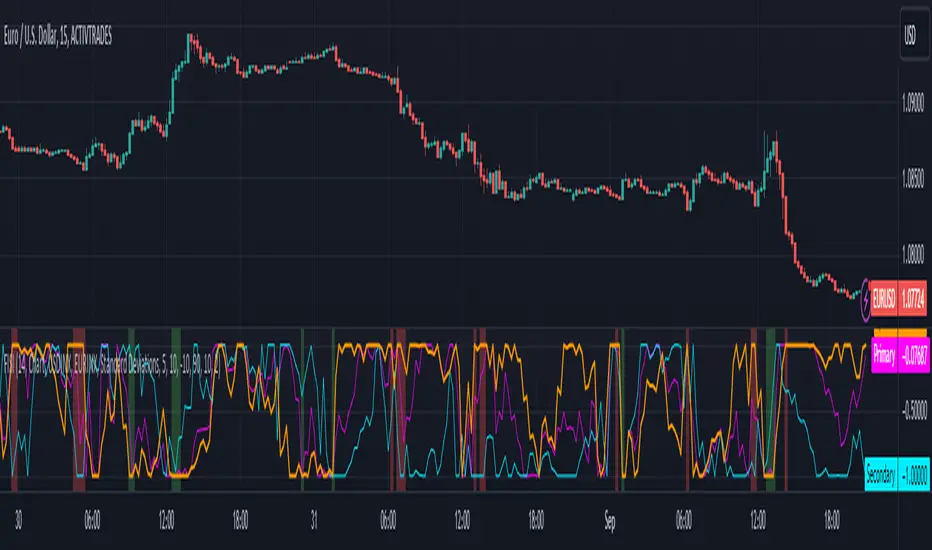
Zaree - FX Index Spread IndicatorDescription:
The "Zaree - FX Index Spread Indicator" (FISI) is a powerful technical analysis tool designed to provide insights into the spread between two selected currency indices. By calculating and visualizing the percentage difference between the values of a primary and a secondary currency index, traders can gain valuable information about potential market dynamics and trends.
Details of the Indicator:
The indicator calculates the spread percentage between a primary and a secondary currency index, allowing traders to understand the relative strength of the two indices.
Traders can choose from a list of currency indices to use as the primary and secondary indices for comparison.
The indicator offers multiple methods for setting thresholds to identify potential trading opportunities, including standard deviations, percentile ranks, historical highs and lows, and fixed thresholds.
Users can customize the length of the calculation period and choose whether to display the primary index, secondary index, and the spread percentage on the chart.
Shaded areas on the chart indicate regions where the spread percentage is above or below predefined thresholds, helping traders identify potential trading signals.
How to Use the Indicator:
Select the primary and secondary currency indices you want to compare from the provided dropdown menus. These indices will be used to calculate the spread percentage.
Choose the method for setting thresholds by selecting one of the options: "Standard Deviations," "Percentile Ranks," "Historical Highs and Lows," or "Fixed Thresholds."
Depending on the selected method, configure the relevant threshold parameters, such as historical threshold percentage, upper and lower fixed thresholds, upper and lower percentile thresholds, or the standard deviation multiplier.
Choose whether to visualize the primary index, secondary index, and spread percentage on the chart by enabling the respective options.
Observe the chart to identify potential trading signals based on the interactions between the spread percentage and the predefined thresholds.
Example of Usage:
Suppose you're interested in trading currency pairs involving the US Dollar (USD) and Euro (EUR), and you want to monitor the spread between the USD Index (USDINX) and the EUR Index (EURINX). Here's how you can use the FISI indicator:
Select "USDINX" as the primary index and "EURINX" as the secondary index.
Choose the method for setting thresholds based on your strategy. For instance, you can select "Standard Deviations" and adjust the standard deviation multiplier.
Enable the visualization of the primary index, secondary index, and spread percentage on the chart.
Observe the shaded areas on the chart. If the spread percentage crosses above the upper threshold, it may indicate a potential market overextension. Conversely, if the spread percentage crosses below the lower threshold, it could suggest an oversold market condition.
Look for instances where the spread percentage approaches or crosses the predefined thresholds. Consider these instances as potential entry or exit points for your trades.
Remember that the FISI indicator is a tool to assist you in your analysis. It's recommended to combine its insights with other technical and fundamental factors before making trading decisions. Adjust the indicator settings and thresholds based on your trading strategy and preferences.
As with any trading tool, practice and observation are key. Over time, you can refine your trading strategy by analyzing historical data and observing how the indicator performs in different market conditions.
Feel free to experiment with different settings and methods to find the configuration that aligns best with your trading style and goals.
@tk · fractal emas█ OVERVIEW
This script is an indicator that plots short, medium and long moving averages for multiple fractals. This script was based on sharks EMAs by rlvs indicator, that plots multiple rays for each fractals into the chart. The main feature of this indicator is the customizability. The calculation itself is simple as moving average.
█ MOTIVATION
The trader can customize all aspects of the plotted data. The text size, extended line length, the moving average type — exponential, simple, etc... — the length of fractal rays, line style, line width and visibility. To keep minimalist, this indicator simplifies the logic of line colors based on the purpose of each moving averages. To prevent overnoise the chart with multiple lines with multiple colors for each fractal timefraes, the trader needs to keep in mind that the all lines with the "short" moving average color for example, will represents the short moving averages lines for all fractals. This logic is applied for medium and long moving averages either.
█ CONCEPT
The trading concept to use this indicator is to make entries on uptrend or downtrend pullbacks when the asset price reaches the short, medium or long moving averages price levels. But this strategy don't works alone. It needs to be aligned together with others indicators like RSI, Chart Patterns, Support and Resistance, and so on... Even more confluences that you have, bigger are your chances to increase the probability for a successful trade. So, don't use this indicator alone. Compose a trading strategy and use it to improve your analysis.
█ CUSTOMIZATION
This indicator allows the trader to customize the following settings:
GENERAL
Text size
Changes the font size of the labels to improve accessibility.
Type: string
Options: `tiny`, `small`, `normal`, `large`.
Default: `small`
SHORT
Type
Select the Short Moving Average calculation type.
Type: string
Options: `EMA`, `SMA`, `HMA`, `VWMA`, `WMA`.
Default: `EMA`
Length
Changes the base length for the Short Moving Average calculation.
Type: int
Default: 12
Source
Changes the base source for the Short Moving Average calculation.
Type: float
Default: close
Color
The base color that will represent the Short Moving Average.
Type: color
Default: color.rgb(255, 235, 59) (yellow)
Fractal Style
The fractal ray line style.
Type: string
Options: `dotted`, `dashed`, `solid`.
Default: `dotted`
Fractal Width
The fractal ray line width.
Type: string
Options: `1px`, `2px`, `3px`, `4px`.
Default: `1px`
Fractal Ray Length
The fractal ray line length.
Type: int
Default: 12
MEDIUM
Type
Select the Medium Moving Average calculation type.
Type: string
Options: `EMA`, `SMA`, `HMA`, `VWMA`, `WMA`.
Default: `EMA`
Length
Changes the base length for the Medium Moving Average calculation.
Type: int
Default: 26
Source
Changes the base source for the Medium Moving Average calculation.
Type: float
Default: close
Color
The base color that will represent the Short Moving Average.
Type: color
Default: color.rgb(0, 230, 118) (lime)
Fractal Style
The fractal ray line style.
Type: string
Options: `dotted`, `dashed`, `solid`.
Default: `dotted`
Fractal Width
The fractal ray line width.
Type: string
Options: `1px`, `2px`, `3px`, `4px`.
Default: `1px`
Fractal Ray Length
The fractal ray line length.
Type: int
Default: 12
LONG
Type
Select the Long Moving Average calculation type.
Type: string
Options: `EMA`, `SMA`, `HMA`, `VWMA`, `WMA`.
Default: `EMA`
Length
Changes the base length for the Long Moving Average calculation.
Type: int
Default: 200
Source
Changes the base source for the Long Moving Average calculation.
Type: float
Default: close
Color
The base color that will represent the Short Moving Average.
Type: color
Default: color.rgb(255, 82, 82) (red)
Fractal Style
The fractal ray line style.
Type: string
Options: `dotted`, `dashed`, `solid`.
Default: `dotted`
Fractal Width
The fractal ray line width.
Type: string
Options: `1px`, `2px`, `3px`, `4px`.
Default: `1px`
Fractal Ray Length
The fractal ray line length.
Type: int
Default: 12
VISIBILITY
Show Fractal Rays · (Short)
Shows short moving average fractal rays.
Type: bool
Default: true
Show Fractal Rays · (Medium)
Shows short moving average fractal rays.
Type: bool
Default: true
Show Fractal Rays · (Long)
Shows short moving average fractal rays.
Type: bool
Default: true
█ FUNCTIONS
The script contains the following functions:
`fn_labelizeTimeFrame`
Labelize timeframe period in minutes and hours.
Parameters:
tf: (string) Timeframe period to be labelized.
Returns: (string) Labelized timeframe string.
`fn_builtInLineStyle`
Converts simple string to built-in line style variable value.
Parameters:
lineStyle: (string) The line style simple string.
Returns: (string) Built-in line style string value.
`fn_builtInLineWidth`
Converts simple pixel string to line width number value.
Parameters:
lineWidth: (string) The line width pixel simple string.
Returns: (string) Built-in line width number value.
`fn_requestFractal`
Requests fractal data based on `period` given an expression.
Parameters:
period: (string) The period timeframe of fractal.
expression: (series float) The expression to retrieve data from fractal.
Returns: (mixed) A result determined by `expression`.
`fn_plotRay`
Plots line after chart bars.
Parameters:
y: (float) Y axis line position.
label: (string) Label to be ploted after line.
color: (color) Line and label color.
length: (int) Line length.
show: (bool) Flag to display the line. (default: `true`)
lineStyle: (string) Line style to be applied. (default: `line.style_dotted`)
lineWidth: (int) Line width. (default: `1`)
Returns: void
`fn_plotEmaRay`
Plots moving average line for a specific period.
Parameters:
period: (simple string) Period of fractal to retrieve
expression: (series float) The expression to retrieve data from fractal.
color: (color) Line and label color.
length: (int) Line length. (default: `12`)
show: (bool) Flag to display the line. (default: `true`)
lineStyle: (string) Line style to be applied. (default: `line.style_dotted`)
lineWidth: (string) Line width. (default: `1px`)
Returns: void
`fn_plotExtendedEmaRay`
Draws extended line for current timeframe moving average.
Parameters:
coordY: (float) Extended line Y axis position.
textValue: (simple string) Extended line label text.
textColor: (color) Extended line text color.
length: (int) Extended length. (default: `5`)
Returns: void

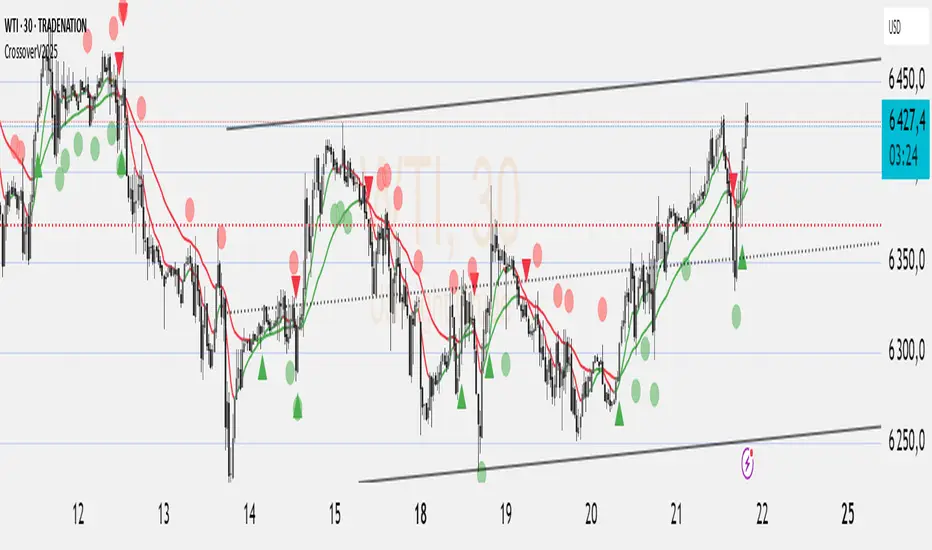
Adaptive Trend Indicator [Quantigenics]Our Adaptive Trend Indicator is an advanced trading indicator using price and time series analysis to adapt to market trends. It calculates a weighted average of the median price and twice-smoothed average price, then applies a linear regression over twice the user-defined period, generating a trend line. This trend line represents the prevailing market direction and adjusts dynamically based on price fluctuations. When the Adaptive Trend value increases compared to the previous value, the line turns aqua, signaling an upward trend. Conversely, if it decreases, the line turns red, indicating a downward trend. This color coding provides visual guidance for traders. By combining advanced statistical techniques with real-time adaptation, the Adaptive Trend indicator provides timely trend information, supporting traders in navigating various market conditions.
Additionally, this indicator may be applied multiple times to the same chart. Traders may adjust the length of each instance to show a group of trendlines that can indicate when price action is overbought or oversold as well as support or resistance at different indicator lengths. Example below.
CRYPTO:BTCUSD
CRYPTO:BTCUSD
NASDAQ:TSLA
We hope you enjoy this indicator. Happy Trading!

L&S Volatility Index Refurbished█ Introduction
This is my second version of the L&S Volatility Index, hence the name "Refurbished".
The first version can be found at this link:
The reason I released a separate version is because I rewrote the source code from scratch with the aim of both improving the indicator and staying as close as possible to the original concept.
I feel that the first version was somewhat exotic and polluted in relation to the indicator originally described by the authors.
In short, the main idea remains the same, however, the way of presenting the result has been changed, reiterating what was said.
█ CONCEPTS
The L&S Volatility Index measures the volatility of price in relation to a moving average.
The indicator was originally described by Brazilian traders Alexandre Wolwacz (Stormer) and Fábio Figueiredo (Vlad) from L&S Educação Financeira.
Basically, this indicator can be used in two ways:
1. In a mean reversion strategy, when there is an unusual distance from it;
2. In a trend following strategy, when the price is in an acceptable region.
As an indicator of volatility, the greatest utility is shown in first case.
This is because it allows identifying abnormal prices, extremely stretched in relation to an average, including market crashes.
How the calculation is done:
First, the distance of the price from a given average in percentage terms is measured.
Then, the historical average volatility is obtained.
Finally the indicator is calculated through the ratio between the distance and the historical volatility.
According to the description proposed by the creators, when the L&S Volatility Index is above 30 it means that the price is "stretched".
The closer to 100 the more stretched.
When it reaches 0, it means the price is on average.
█ What to look for
Basically, you should look at non-standard prices.
How to identify it?
When the oscillator is outside the Dynamic Zone and/or the Fixed Zone (above 30), it is because the price is stretched.
Nothing on the market is guaranteed.
As with the RSI, it is not because the RSI is overbought or oversold that the price will necessarily go down or up.
It is critical to know when NOT to buy, NOT to sell or NOT to do anything.
It is always important to consider the context.
█ Improvements
The following improvements have been implemented.
It should be noted that these improvements can be disabled, thus using the indicator in the "purest" version, the same as the one conceived by the creators.
Resources:
1. Customization of limits and zones:
2. Customization of the timeframe, which can be different from the current one.
3. Repaint option (prints the indicator in real time even if the bar has not yet closed. This produces more signals).
4. Customization of price inputs. This affects the calculation.
5. Customization of the reference moving average (the moving average used to calculate the price distance).
6. Customization of the historical volatility calculation strategy.
- Accumulated ATR: calculates the historical volatility based on the accumulated ATR.
- Returns: calculates the historical volatility based on the returns of the source.
Both forms of volatility calculation have their specific utilities and applications.
Therefore, it is worthwhile to have both approaches available, and one should not necessarily replace the other.
Each method has its advantages and may be more appropriate in different contexts.
The first approach, using the accumulated ATR, can be useful when you want to take into account the implied volatility of prices over time,
reflecting broader price movements and higher impact events. It can be especially relevant in scenarios where unexpected events can drastically affect prices.
The second approach, using the standard deviation of returns, is more common and traditionally used to measure historical volatility.
It considers the variability of prices relative to their average, providing a more general measure of market volatility.
Therefore, both forms of calculation have their merits and can be useful depending on the context and specific analysis needs.
Having both options available gives users flexibility in choosing the most appropriate volatility measure for the situation at hand.
* When choosing "Accumulated ATR", if the indicator becomes difficult to see, there are 3 possibilities:
a) manually adjust the Fixed Zone value;
b) disable the Fixed Zone and use only the Dynamic Zone;
c) normalize the indicator.
7. Signal line (a moving average of the oscillator).
8. Option to normalize the indicator or not.
9. Colors to facilitate direction interpretation.
Since the L&S is a volatility indicator, it does not show whether the price is rising or falling.
This can sometimes confuse the user.
That said, the idea here is to show certain colors where the price is relative to the average, making it easier to analyze.
10. Alert messages for automations.

Moving Average Continuity [QuantVue]"Moving Average Continuity," is designed to compare the position of two Moving Averages (MAs) across multiple timeframes.
The user can select three timeframes and determine the length and type of both a fast and slow moving average.
The indicator will display a small table in a user selected location.
This table helps traders quickly determine if, for their selected timeframes, the faster moving average is trending above or below the slower moving average.
The “Moving Average Continuity” indicator can also send you three types of alerts;
1. All moving averages are aligned bullish
2. All moving averages are aligned bearish
3. Moving averages are mixed
Key Features:
1. Timeframes: The user can select up to three distinct timeframes to compare the moving averages.
2. Moving Average Inputs: For each MA, users can determine:
• Length of the MA
• Type of the MA - Options include EMA (Exponential Moving Average), SMA (Simple Moving Average), HMA (Hull Moving Average), WMA (Weighted Moving Average), and VWMA (Volume Weighted Moving Average).
3. Positioning: Users have the ability to adjust the table's positioning (top, middle, or bottom) and horizontal alignment (right, center, or left) on the chart overlay.
4. Runtime Error Prevention: The indicator will throw an error if the chart's timeframe exceeds the maximum selected timeframe, ensuring that comparisons are done correctly.
Give this indicator a BOOST and COMMENT your thoughts!
We hope you enjoy.
Cheers.

Moving Average Exponential Angle DetectionMoving Average exponential angle detection use to find the angle of moving average so we can take trade according to our strategy.
Hope you like this.
Thanks and Regards,
TradingTail

GDCA ScreenerThis is upgrated system for Screener to DCA from "Grospector DCA V.3".
This has 5 zone Extreme high , high , normal , low , Extreme low. You can dynamic set min - max percent every zone.
Extreme zone is derivative short and long which It change Extreme zone to Normal zone all position will be closed.
Every Zone is splitted 10 channel. and this strategy calculate contribution.
and now can predict price in future.
Price Type: Allows the user to select the price type (open, high, low, close) for calculations.
ALL SET
Length MA for normal zone: The length of the moving average used in the normal zone.
Length for strong zone: The length of the moving average used in the strong zone, which is averaged from the normal zone moving average.
Multiple for Short: The multiplication factor applied to determine the threshold for the short zone.
Multiple for Strong Sell: The multiplication factor applied to determine the threshold for the strong sell zone.
Multiple for Sell Zone: The multiplication factor applied to determine the threshold for the sell zone.
Multiple for Buy Zone: The multiplication factor applied to determine the threshold for the buy zone.
Multiple for Strong Buy: The multiplication factor applied to determine the threshold for the strong buy zone.
Multiple for Long: The multiplication factor applied to determine the threshold for the long zone.
ZONE
Start Short Zone %: The start percentage of the short zone.
End Short Zone %: The end percentage of the short zone.
Start Sell Zone %: The start percentage of the sell zone.
End Sell Zone %: The end percentage of the sell zone.
Start Normal Zone %: The start percentage of the normal zone.
End Normal Zone %: The end percentage of the normal zone.
Start Buy Zone %: The start percentage of the buy zone.
End Buy Zone %: The end percentage of the buy zone.
Start Long Zone %: The start percentage of the long zone.
End Long Zone %: The end percentage of the long zone.
DISPLAY
Show Price: Controls the visibility of the price column in the display table.
Show Mode: Controls the visibility of the mode column in the display table.
Show GDCA: Controls the visibility of the GDCA column in the display table.
Show %: Controls the visibility of the percentage column in the display table.
Show Short: Controls the visibility of the short column in the display table.
Show Strong Sell: Controls the visibility of the strong sell column in the display table.
Show Sell: Controls the visibility of the sell column in the display table.
Show Buy: Controls the visibility of the buy column in the display table.
Show Strong Buy: Controls the visibility of the strong buy column in the display table.
Show Long: Controls the visibility of the long column in the display table.
Show Suggestion Trend: Controls the visibility of the suggestion trend column in the display table.
Show Manual Custom Code: Controls the visibility of the manual custom code column in the display table.
Show Dynamic Trend: Controls the visibility of the dynamic trend column in the display table.
Symbols: Boolean parameters that control the visibility of individual symbols in the display table.
Mode: Integer parameters that determine the mode for each symbol, specifying different settings or trends.
My mindset has been customed = AAPL , MSFT
To effectively make the DCA plan, I recommend adopting a comprehensive strategy that takes into consideration your mindset as the best indicator of the optimal approach. By leveraging your mindset, the task can be made more manageable and adaptable to any market
Dollar-cost averaging (DCA) is a suitable investment strategy for sound money and growth assets which It is Bitcoin, as it allows for consistent and disciplined investment over time, minimizing the impact of market volatility and potential risks associated with market timing

Sessioned EMA - Frozen EMA in post market hoursWhy I develop this indicator?
In future indices, post market data with little volume distort the moving average seriously. This indicator is to eliminate the distortion of data during low volume post market hours.
How to use?
There is a time session setting in the indicator, you can set the cash hour time, moving average outside the session will be frozen.
What this indicator gives you
This indicator give you a more make sense ema pattern, the ema lines are more respected by the prices when you set the session properly.
Setup
1. Session setting
In US indices, such as NQ, ES etc, when there was data release at 0830 hr, huge volume transaction order appears, that makes the 0830 price data important that should be included in your ema trend line calculating. If that is the case, I will set the session begin from 0830, otherwise, I start the session at 0930. Golden rule : Price with huge volume counts.
2. Time zone
The coding is decided for GMT+8 time zone, you may amend the code to fit your timezone.
