GoM Scalping Pro V1.20 GoM Scalping Pro — Smart ALMA Signal System
GoM Scalping Pro is a professional trading indicator designed to identify high-quality market entries using a smart trend-based signal engine combined with volatility filtering and built-in risk visualization.
The indicator automatically highlights **potential BUY and SELL opportunities and displays structured trading levels directly on the chart, making it suitable for scalping, intraday, and short-term swing trading.
🔹 Key Features
Smart trend-based signal detection
Volatility filter to avoid low-quality market conditions
Automatic calculation of Entry, Stop Loss, and Take Profit levels
Multiple Take Profit targets for flexible trade management
Clear and uncluttered chart visualization
Customizable alerts (Push / Sound / Popup)
Works on all markets and timeframes
📊 How to Use
Signals appear directly on the chart when market conditions are valid
Follow the displayed Entry, SL, and TP levels for structured execution
Can be combined with your own market context or risk rules
The indicator is designed to assist decision-making, not to replace trading discipline.
🎯 Recommended Markets
For best performance, use on liquid instruments such as:
Major Forex pairs
Gold (XAUUSD)
Major indices (US500, NAS100)
Bitcoin (BTCUSD)
⚙️ Alerts
Enable alerts to receive real-time notifications when new signals are detected.
This allows you to monitor multiple instruments efficiently without staring at charts.
⚠️ Disclaimer
This indicator is a technical analysis tool, not financial advice.
Always test settings on a demo account and manage risk carefully.
If you want, I can also provide:
a shorter “store-style” description
a premium / institutional tone version
or a version optimized for conversions on TradingView
Moving

Multi-indicator Signal Builder [Skyrexio]Overview
Multi-Indicator Signal Builder is a versatile, all-in-one script designed to streamline your trading workflow by combining multiple popular technical indicators under a single roof.
It features a single-entry, single-exit logic, intrabar stop-loss/take-profit handling, an optional time filter, a visually accessible condition table, and a built-in statistics label.
Traders can choose any combination of 12+ indicators (RSI, Ultimate Oscillator, Bollinger %B, Moving Averages, ADX, Stochastic, MACD, PSAR, MFI, CCI, Heikin Ashi, and a “TV Screener” placeholder) to form entry or exit conditions.
This script aims to simplify strategy creation and analysis , making it a powerful toolkit for technical traders.
Indicators Overview
RSI (Relative Strength Index)
Measures recent price changes to evaluate overbought or oversold conditions on a 0–100 scale.
Ultimate Oscillator (UO)
Uses weighted averages of three different timeframes, aiming to confirm price momentum while avoiding false divergences.
Bollinger %B
Expresses price relative to Bollinger Bands, indicating whether price is near the upper band (overbought) or lower band (oversold).
Moving Average (MA)
Smooths price data over a specified period. The script supports both SMA and EMA to help identify trend direction and potential crossovers.
ADX (Average Directional Index)
Gauges the strength of a trend (0–100). Higher ADX signals stronger momentum, while lower ADX indicates a weaker trend.
Stochastic
Compares a closing price to a price range over a given period to identify momentum shifts and potential reversals.
MACD (Moving Average Convergence/Divergence)
Tracks the difference between two EMAs plus a signal line, commonly used to spot momentum flips through crossovers.
PSAR (Parabolic SAR)
Plots a trailing stop-and-reverse dot that moves with the trend. Often used to signal potential reversals when price crosses PSAR.
MFI (Money Flow Index)
Similar to RSI but incorporates volume data. A reading above 80 can suggest overbought conditions, while below 20 may indicate oversold.
CCI (Commodity Channel Index)
Identifies cyclical trends or overbought/oversold levels by comparing current price to an average price over a set timeframe.
Heikin Ashi
A type of candlestick charting that filters out market noise. The script uses a streak-based approach (multiple consecutive bullish or bearish bars) to gauge mini-trends.
TV Screener
A placeholder condition designed to integrate external buy/sell logic (like a TradingView “Buy” or “Sell” rating). Users can override or reference external signals if desired.
Unique Features
Multi-Indicator Entry and Exit
You can selectively enable any subset of 12+ classic indicators, each with customizable parameters and conditions. A position opens only if all enabled entry conditions are met, and it closes only when all enabled exit conditions are satisfied, helping reduce false triggers.
Single-Entry / Single-Exit with Intrabar SL/TP
The script supports a single position at a time. Once a position is open, it monitors intrabar to see if the price hits your stop-loss or take-profit levels before the bar closes, making results more realistic for fast-moving markets.
Time Window Filter
Users may specify a start/end date range during which trades are allowed, making it convenient to focus on specific market cycles for backtesting or live trading.
Condition Table and Statistics
A table at the bottom of the chart lists all active entry/exit indicators. Upon each closed trade, an integrated statistics label displays net profit, total trades, win/loss count, average and median PnL, etc.
Seamless Alerts and Automation
• Configure alerts in TradingView using “Any alert() function call.”
• The script sends JSON alert messages you can route to your own webhook.
• The indicator can be integrated with Skyrexio alert bots to automate execution on major cryptocurrency exchanges.
Optional MA/PSAR Plots
For added visual clarity, optionally plot the chosen moving averages or PSAR on the chart to confirm signals without stacking multiple indicators.
Methodology
Multi-Indicator Entry Logic
When multiple entry indicators are enabled (e.g., RSI + Stochastic + MACD), the script requires all signals to align before generating an entry. Each indicator can be set for crossovers, crossunders, thresholds (above/below), etc. This “AND” logic aims to filter out low-confidence triggers.
Single-Entry Intrabar SL/TP
• One Position At a Time: Once an entry signal triggers, a trade opens at the bar’s close.
• Intrabar Checks: Stop-loss and take-profit levels (if enabled) are monitored on every tick. If either is reached, the position closes immediately, without waiting for the bar to end.
Exit Logic
All Conditions Must Agree: If the trade is still open (SL/TP not triggered), then all enabled exit indicators must confirm a closure before the script exits on the bar’s close.
Time Filter
Optional Trading Window: You can activate a date/time range to constrain entries and exits strictly to that interval.
Justification of Methodology
Indicator Confluence: Combining multiple tools (RSI, MACD, etc.) can reduce noise and false signals.
Intrabar SL/TP: Capturing real-time spikes or dips provides a more precise reflection of typical live trading scenarios.
Single-Entry Model: Straightforward for both manual and automated tracking (especially important in bridging to bots).
Custom Date Range: Helps refine backtesting for specific market conditions or to avoid known irregular data periods.
How to Use
Add the Script to Your Chart
• In TradingView, open Indicators , search for “Multi-indicator Signal Builder” .
• Click to add it to your chart.
Configure Inputs
• Time Filter: Set a start and end date for trades.
• Alerts Messages: Input any JSON or text payload needed by your external service or bot.
• Entry Conditions: Enable and configure any indicators (e.g., RSI, MACD) for a confluence-based entry.
• Close Conditions: Enable exit indicators, along with optional SL (negative %) and TP (positive %) levels.
Set Up Alerts
• In TradingView, select “Create Alert” → Condition = “Any alert() function call” → choose this script.
• Entry Alert: Triggers on the script’s entry signal.
• Close Alert: Triggers on the script’s close signal (or if SL/TP is hit).
• Skyrexio Alert Bots: You can route these alerts via webhook to Skyrexio alert bots to automate order execution on major crypto exchanges (or any other supported broker).
Visual Reference
• A condition table at the bottom summarizes active signals.
• Statistics Label updates automatically as trades are closed, showing PnL stats and distribution metrics.
Backtesting Guidelines
Symbol/Timeframe: Works on multiple assets and timeframes; always do thorough testing.
Realistic Costs: Adjust commissions and potential slippage to match typical exchange conditions.
Risk Management: If using the built-in stop-loss/take-profit, set percentages that reflect your personal risk tolerance.
Longer Test Horizons: Verify performance across diverse market cycles to gauge reliability.
Example of statistic calculation
Test Period: 2023-01-01 to 2025-12-31
Initial Capital: $1,000
Commission: 0.1%, Slippage ~5 ticks
Trade Count: 680 (varies by strategy conditions)
Win rate: 75.44% (varies by strategy conditions)
Net Profit: +90.14% (varies by strategy conditions)
Disclaimer
This indicator is provided strictly for informational and educational purposes.
It does not constitute financial or trading advice.
Past performance never guarantees future results.
Always test thoroughly in demo environments before using real capital.
Enjoy exploring the Multi-Indicator Signal Builder! Experiment with different indicator combinations and adjust parameters to align with your trading preferences, whether you trade manually or link your alerts to external automation services. Happy trading and stay safe!

ThaiRiches Predictor [AI Premium]ThaiRiches Predictor is a comprehensive trend-following system designed to help traders identify high-probability entries while managing risk effectively. This script combines Zero-Lag technology (ZLEMA) with volatility filters and an intelligent AI Dashboard to analyze market conditions in real-time.
Key Features:
Zero-Lag Trend Engine: Uses a custom Zero-Lag EMA (ZLEMA) logic combined with volatility bands to detect trend changes earlier than traditional Moving Averages.
AI Analysis Dashboard: A real-time monitor panel that evaluates Trend, Momentum (RSI), and Volatility to provide actionable advice (e.g., "Strong Uptrend", "Overbought - Wait for Pullback", or "Low Volatility - Caution").
Auto TP & SL System: Automatically calculates and displays Stop Loss (SL), Take Profit 1 (TP1), and Take Profit 2 (TP2) based on ATR, adapting to the current market volatility.
Improved Safety: SL is calculated from the High/Low of the signal candle to prevent premature stop-outs.
Visual Alerts: Clear BUY/SELL labels with price targets and color-coded candlesticks for easy visual confirmation.
How to Use:
BUY Signal: Look for the Green Label and Green Trend Line. Confirm with the Dashboard (Status: BULLISH).
S ELL Signal: Look for the Red Label and Red Trend Line. Confirm with the Dashboard (Status: BEARISH).
Risk Management: Use the provided SL levels. It is recommended to take partial profit at TP1 and trail your stop to entry.
Caution: Avoid trading when the Dashboard shows "Low Volatility" or "Choppy" warnings.
Settings:
You can adjust the Trend Sensitivity and RSI Period.
TP/SL Multipliers are fully customizable to fit different assets (Gold, Forex, Crypto).

cd_VW_Cx IMPROVED - Quant VWAP System: Regime, Magnets & Z-ScoQuant VWAP System: Regime, Magnets & Z-Score Matrix
This indicator is a comprehensive Quantitative Trading System designed to move beyond simple support and resistance. Instead of static lines, it uses Statistical Probability (Z-Score) and Standard Deviation to define the current market regime, identify institutional value zones, and project high-probability liquidity targets.
It is engineered for Day Traders and Scalpers (Crypto & Futures) who need to know if the market is Trending, Ranging, or preparing for a Breakout.
1. The "Regime" System (Standard Deviation Bands)
The core engine anchors a VWAP (Volume Weighted Average Price) to your chosen timeframe (Daily, Weekly, or Monthly) and projects volatility bands based on market variance.
The Trend Zone (Inner Band / 1.0 SD): This is the "Fair Value" zone. In a healthy trend, price will pull back into this zone and hold. A hold here signals a high-probability continuation (Trend Following).
The Reversion Zone (Outer Band / 2.0 SD): This represents a statistical extreme. Price rarely sustains movement beyond 2 Standard Deviations without a reversion. A touch of this band signals "Overbought" or "Oversold" conditions.
2. Liquidity Magnets (Virgin VWAPs)
The script automatically tracks "Unvisited VWAPs" from previous sessions. These are price levels where significant volume occurred but have not yet been re-tested.
The Logic: Algorithms often target these "open loops." The script visualizes them as Blue Dashed Lines with price tags.
Smart Scaling (Anti-Scrunch): Includes a custom "Ghost Engine" that automatically hides or "ghosts" magnets that are too far away. This prevents your chart from being squashed (scrunched) on lower timeframes, keeping your candles perfectly readable while still tracking targets in the background.
3. The Quant Matrix (Dashboard)
A real-time Heads-Up Display (HUD) that interprets the data for you:
Regime: Detects Volatility Squeezes. If the bands compress, it signals "⚠ SQUEEZE", warning you to stop mean-reversion trading and prepare for an explosive breakout.
Bias: Color-coded Trend Direction (Bullish/Bearish) based on VWAP slope.
Signal: actionable text prompts such as "BUY DIP" (Trend Following), "FADE EXT" (Mean Reversion), or "PREP BREAK" (Squeeze).
4. Visual Intelligence
Bold Day Separators: Clear, vertical dotted dividers with Date Stamps to instantly separate trading sessions.
Dynamic Labels: Floating labels on the right axis identify exactly which deviation level is which, preventing chart confusion.
How to Use
Strategy A: The Trend Pullback (continuation)
Check Matrix: Ensure Bias is BULLISH (Green).
Wait: Allow price to pull back into the Inner Band (Dark Green Zone).
Trigger: If price holds the Center VWAP or the -1.0 SD line, enter Long.
Target: The next Liquidity Magnet above or the +2.0 SD band.
Strategy B: The Reversion Fade (Counter-Trend)
Check Matrix: Ensure price is labeled "EXTREME" or Signal says "FADE EXT".
Trigger: Price touches or pierces the Outer Band (2.0 SD).
Action: Enter counter-trend (Short) with a target back to the Center VWAP (Mean Reversion).
Strategy C: The Magnet Target
Identify a "MAGNET" line (Blue Dashed) near current price.
These act as high-probability Take Profit levels. Price will often rush to these levels to "close the loop" before reversing.
Settings
Anchor: Daily (default), Weekly, or Monthly.
Magnet Focus Range: Adjusts how aggressively the script hides distant magnets to fix chart scaling (Default: 2%).
Visuals: Fully customizable colors, label sizes, and dashboard position.

Smart MA Zone Crossover [HMA-EMA]Smart MA Zone Crossover is a trend-following indicator designed to capture early momentum shifts using the crossover between Hull Moving Average (HMA) and Exponential Moving Average (EMA).
The indicator visually highlights trend direction using a dynamic colored zone, making it easy to identify bullish and bearish market phases at a glance.
🔸 Step 1: Moving Average Calculation
HMA (Hull Moving Average) → Faster, smoother, reacts quickly to price
EMA (Exponential Moving Average) → Stable trend reference
Both MA lengths are **fully adjustable** from the settings panel.
🔸 Step 2: Trend Detection
Bullish Trend: HMA is above EMA
Bearish Trend: HMA is below EMA
The area between the two averages is filled with color to visually represent the current trend state.
Step 3: Signal Generation (Non-Repainting)
Signals are generated **only on confirmed crossovers**:
✅ BUY Signal- HMA crosses above EMA
❌ SELL Signal-HMA crosses belowEMA
Signals do **not repaint** and appear only once per crossover.
🔸 Step 4: Visual Customization
Users can enable or disable:
* Moving average lines
* Colored MA zone fill
* Buy/Sell arrows
* Buy/Sell text labels
This allows the indicator to remain **minimal or detailed**, depending on user preference.
🔹 Key Features
✔ Non-repainting logic
✔ Clean crossover-based signals
✔ Customizable HMA & EMA lengths
✔ Optional MA zone fill
✔ Buy/Sell arrows & labels
✔ Works on all timeframes
✔ Beginner-friendly & scalper-ready
🔹 Best Use Cases
* Trend confirmation
* Momentum trading
* Scalping & intraday trading
* Swing trend filtering
For best results, combine with:
* Support & resistance
* Volume
* Higher-timeframe trend
🔹 Disclaimer
This indicator is provided for **educational purposes only**.
It is **not financial advice**. Always backtest and use proper risk management before trading live markets.

Multi-Trend + Credit Risk DashboardHello This is showing 20,50,200 as well as some other useful indicators. hope you like it, its my first! D and P is discount or premium to nav

VWMA CloudA volume-weighted moving average (VWMA) cloud consisting of fast and slow VWMAs. The lines are dynamically colored based on their relative positions, forming a visual cloud that highlights bullish and bearish trends.
A normal moving average (SMA or EMA) weights prices equally (or by recency) and ignores volume, so it reacts the same regardless of how much trading occurred. A volume-weighted moving average (VWMA) weights each price by its trading volume, so high-volume moves shift the average more and low-volume moves shift it less. This makes VWMA more representative of where the market is actually trading and filters out weak, low-participation moves.

Daily Close Breakout 20/10 + 200 (Signals)Daily Close Breakout 20/10 + 200 (Signals)
A simple “check once per day” breakout signal tool designed for the Daily (1D) chart.
Quickstart:
* Signals are confirmed at the daily candle close.
* If a triangle prints today, the earliest you act is the next day’s open (not the same candle).
* Green triangle = consider entering long.
* Red triangle = consider exiting.
* Long-only (no shorts).
How to use:
* Use on the Daily (1D) timeframe.
* Check the chart once per day after the daily candle closes.
* Do not act intraday on signals.
Rules (default settings 20 / 10 / 200):
* BUY: A green up triangle prints when the daily close is above the prior 20-day high and above the 200-day Simple Moving Average.
* SELL: A red down triangle prints when the daily close is below the prior 10-day low.
Lines and colors:
* Prior 20-day high (entry level): red
* Prior 10-day low (exit level): yellow
* 200-day Simple Moving Average: aqua
Notes:
* Best used on the Daily (1D) timeframe. Other timeframes may behave differently.
* This script plots signals and reference levels only. For performance metrics, use a matching strategy/backtest script.
* Educational use only. Not financial advice.

MA and EMA Cross [Pure Strategy]Simple EMA/SMA Crossover
This indicator signals BUY or SELL entries when the Fast EMA crosses the Slow SMA.
✅ Best For: Catching the start of strong trends.
⚠️ Warning: May give false signals in sideways (choppy) markets.
💡 Tip: Use this as a secondary confirmation for your existing strategy, rather than a standalone tool.

Phenom(指標版:EMA 交叉訊號 v8.8 + 結構與風險)標題 (Title): Phenom Intelligence: Trend & Risk Structure System (v8.8)
內文 (Description):
Introduction Phenom Intelligence v8.8 is a comprehensive trading system designed to capture trends while strictly managing risk. It integrates Dynamic EMA Structures, Momentum Filters, and Risk Boundaries (ATR & Pivots) into one chart, providing a complete decision-making framework.
Key Features
Dynamic EMA Ribbon: Automatically adjusts EMA lengths based on the selected mode (Swing, Scalping, Trend-Following, or Long-Term Investment).
ATR Risk Channel: Visualizes volatility risk. A close below the lower ATR band signals a potential structure break and suggests defensive measures.
Pivot Points (Auto-Structure): Automatically plots Pivot (P), Resistance (R1), and Support (S1) levels to identify optimal take-profit and stop-loss zones.
Golden Confluence Signals: High-quality buy/sell signals are triggered only when Trend, Momentum (MACD), RSI, and Multi-Timeframe (MTF) conditions align.
Disclaimer This script is "Invite-Only" and intended for educational purposes. It does not constitute financial advice.
系統簡介 Phenom Intelligence v8.8 是一套專為捕捉波段趨勢與風險控管而設計的綜合交易系統。整合了「趨勢結構」、「動能濾網」與「風險邊界」,協助交易者在進場前具備完整的決策依據。
核心功能
智能趨勢均線 (Dynamic EMA): 內建四種戰略模式,系統會根據選定的模式自動調整均線週期。
ATR 動態風險通道: 以均線為軸心繪製波動率通道。當價格跌破下通道時,視為結構破壞警訊,提供客觀的離場參考。
結構支撐壓力 (Pivots): 自動計算關鍵結構點位。R1 (阻力) 可作為獲利調節目標,S1 (支撐) 作為防守區。
黃金共振訊號: 當 EMA 趨勢、MACD 動能、RSI 強度與多週期狀態完全共振時,才會觸發特定訊號,過濾雜訊。
免責聲明 本指標僅供技術分析參考與教育用途,不代表任何形式的投資建議。

Multi EMA (10)Allows you to add and configure up to 10 EMAs to your chart with a single indicator. Enjoy.

Strategy: HMA 50 + Supertrend SniperHMA 50 + Supertrend Confluence Strategy (Trend Following with Noise Filtering)
Description:
Introduction and Concept This strategy is designed to solve a common problem in trend-following trading: Lag vs. False Signals. Standard Moving Averages often lag too much, while price action indicators can generate false signals during choppy markets. This script combines the speed of the Hull Moving Average (HMA) with the volatility-based filtering of the Supertrend indicator to create a robust "Confluence System."
The primary goal of this script is not just to overlay two indicators, but to enforce a strict rule where a trade is only taken when Momentum (HMA) and Volatility Direction (Supertrend) are in perfect agreement.
Why this combination? (The Logic Behind the Mashup)
Hull Moving Average (HMA 50): We use the HMA because it significantly reduces lag compared to SMA or EMA by using weighted calculations. It acts as our primary Trend Direction detector. However, HMA can be too sensitive and "whipsaw" during sideways markets.
Supertrend (ATR-based): We use the Supertrend (Factor 3.0, Period 10) as our Volatility Filter. It uses Average True Range (ATR) to determine the significant trend boundary.
How it Works (Methodology) The strategy uses a boolean logic system to filter out low-quality trades:
Bullish Confluence: The HMA must be rising (Slope > 0) AND the Close Price must be above the Supertrend line (Uptrend).
Bearish Confluence: The HMA must be falling (Slope < 0) AND the Close Price must be below the Supertrend line (Downtrend).
The "Choppy Zone" (Noise Filter): This is a unique feature of this script. If the HMA indicates one direction (e.g., Rising) but the Supertrend indicates the opposite (e.g., Downtrend), the market is considered "Choppy" or indecisive. In this state, the script paints the candles or HMA line Gray and exits all positions (optional setting) to preserve capital.
Visual Guide & Signals To make the script easy to interpret for traders who do not read Pine Script, I have implemented specific visual cues:
Green Cross (+): Indicates a LONG entry signal. Both HMA and Supertrend align bullishly.
Red Cross (X): Indicates a SHORT entry signal. Both HMA and Supertrend align bearishly.
Thick Line (HMA): The main line changes color based on the trend.
Green: Bullish Confluence.
Red: Bearish Confluence.
Gray: Divergence/Choppy (No Trade Zone).
Thin Step Line: This is the Supertrend line, serving as your dynamic Trailing Stop Loss.
Strategy Settings
HMA Length: Default is 50 (Mid-term trend).
ATR Factor/Period: Default is 3.0/10 (Standard for trend catching).
Exit on Choppy: A toggle switch allowing users to decide whether to hold through noise or exit immediately when indicators disagree.
Risk Warning This strategy performs best in trending markets (Forex, Crypto, Indices). Like all trend-following systems, it may experience drawdown during prolonged accumulation/distribution phases. Please backtest with your specific asset before using it with real capital.

Trend Follow Line Point📌 Trend Follow Line Point
The Trend Follow Line Point indicator removes the confusing, repainting-based swing connections commonly found in traditional swing tools.
It maintains consistent swing-point calculation, keeps structural swing lines intact even when trend lines are broken, and integrates market structure + trend + volatility + volume into one intuitive, visual indicator.
This tool is designed for:
Trend Following
Swing Structure Analysis
Volatility-Based Entry & Exit
Market Strength Evaluation
📊 Component Explanation
🔹 1. Swing High / Swing Low Detection
Based on the user-defined sensitivity (swgLen):
A Swing High forms when the current high exceeds the previous swgLen highs.
A Swing Low forms when the current low falls below the previous swgLen lows.
🔹 2. Swing-Based Structure Lines
Connect Swing Highs → Structural visualization
Connect Swing Lows → Structural visualization
These lines reveal the underlying market structure without repainting or disappearing unexpectedly.
🔹 3. Dynamic ATR + Volume Weighting
ATR values combined with the volume ratio (vol / volMA) create a dynamic volatility channel that reflects real-time market pressure.
🔹 4. Enhanced SuperTrend Calculation
Uses ATR-based stability to produce more realistic and smoother trend lines, reducing noise and improving signal clarity.
🔹 5. Trend Color Mapping
Up Trend → User-selected color
Down Trend → User-selected color
Visual trend direction and strength can be identified immediately.
🧭 How to Use
When Swing Highs/Lows are detected, structure lines are automatically drawn between previous swings.
Use these lines to evaluate support/resistance breaks and overall structural direction.
Manage risk with volatility guidance:
Higher ATR (volume-weighted) → wider trend spacing → increased risk
Lower ATR → tighter spacing → reduced risk
This helps with position sizing, entry timing, and exit decisions.
+

Magic Equity Trend & PivotsMagic Equity Trend & Pivots is a robust technical analysis engine designed specifically for equity and index traders. It serves as a comprehensive "Trend & Level" companion, combining institutional Pivot Points with a proprietary EMA trend filtering system to identify high-probability setups.
How the Magic Works
This indicator simplifies complex market data into a clear visual workflow:
1. The Magic Equity Trend (Trend Identification) The script uses a weighted system to determine the dominant market direction:
Bullish Trend: Price holds above the primary Trend SMA + a Volatility Buffer (Green Zone).
Bearish Trend: Price is rejected below the Trend SMA - Buffer (Red Zone).
No-Trade Zone: When the price is trapped inside the buffer (Gray Channel), the trend is considered weak or ranging.
2. Institutional Pivot Points Price often reacts at hidden levels. This tool calculates and overlays these levels automatically:
Multi-Type Support: Choose between Traditional, Fibonacci, Woodie, Classic, DM, and Camarilla pivots.
Timeframe Smart-Switching: Use fixed timeframes (e.g., Weekly Pivots on a Daily chart) or let the "Auto" mode decide the best reference period for your current view.
Historical Mode: Unlike standard pivots, these can be back-tested visually to see how prices respected levels in the past.
3. Precision Entry & Exit Logic Trade signals are not random; they are based on a strict confluence of "Magic" factors:
Entry Signal: Requires Trend Alignment + Fast/Slow EMA Crossover + RSI Strength (>60) + Relative Volume Spike.
Top-Up (Add-on): Detects low-risk opportunities to add to a position when price pulls back to the EMA10/20 during a strong trend.
Two-Stage Exit: Secures profits using either an ATR Trailing Stop or an Intraday RSI Breakdown, depending on your settings.
4. Divergence & Momentum
RSI Divergence: Automatically plots Regular Bullish and Bearish divergences to warn of potential reversals at tops or bottoms.
Darvas Boxes: Visualizes consolidation ranges to help identify breakouts.
5. Performance Dashboard A data table provides a snapshot of the asset's health:
Mean Reversion: Measures the % distance from key EMAs (10, 20, 50).
RVOL & ADR: Displays Relative Volume and Average Daily Range to gauge volatility.
Performance Tracker: A theoretical summary table showing how the trend signals have performed over the last 1W, 1M, and 1Y periods.
Settings & Customization
Visuals: Fully customizable colors for the Trend Cloud, Pivots, and Backgrounds.
Filters: Toggle specific filters (Volume, RSI, Trend Buffer) to adapt the sensitivity to different asset classes.
Disclaimer: This tool is for educational purposes and technical analysis assistance only. Past performance displayed in the dashboard does not guarantee future results.

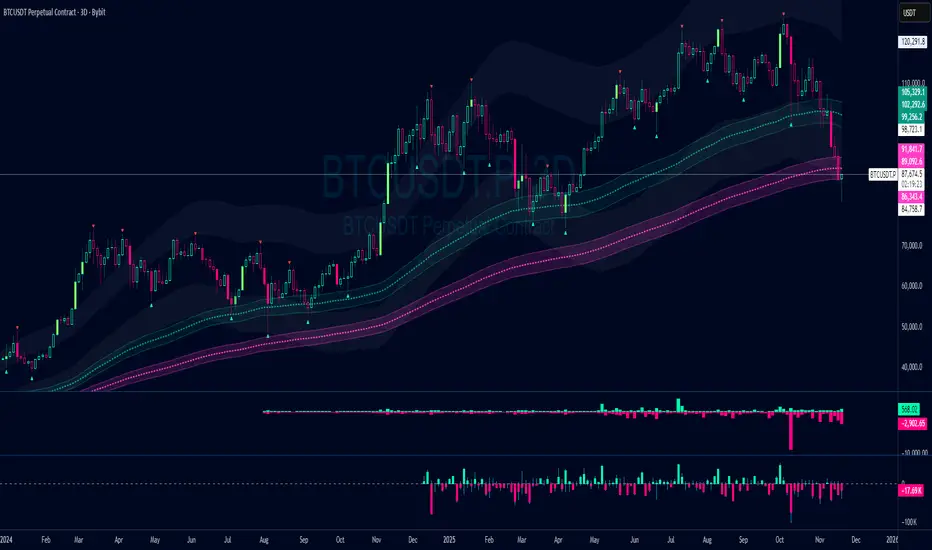
Damo's Custom EMA Bands 1.0I was making these manually for a long time. They just give me more peace of mind when I'm using EMAs. They feel more like a net catching price. These are easy to make. All they are is 3 EMAs with the Source at High, Low and (H+L)/2 for the midpoint.
I find on a 3-Day chart on BTC the 100 EMA is great for telling what trend we're are in.
i.postimg.cc
Liquidity Hunt Detector PDH/PDL [SmartFoxy]Liquidity Hunt Detector PDH/PDL
The Liquidity Hunt Detector (LHD) is designed to identify and anticipate liquidity grabs around the:
• Previous Day High (PDH);
• Previous Day Low (PDL).
It builds dynamic trigger levels that highlight where price may deliver its first impulse before reaching PDH/PDL.
The Liquidity Hunt Detector (LHD) identifies high-probability reversals and continuations around the Previous Day High (PDH) and Previous Day Low (PDL).
It dynamically tracks the market’s move from the session open, builds trigger levels toward PDH/PDL, and highlights where liquidity is most likely to be taken.
When price taps a Trigger Up/Down level, the indicator generates Long/Short signals with optional confirmation from the integrated MA Ribbon , ensuring only high-quality, trend-aligned setups are shown.
When price interacts with these trigger levels, the indicator generates signals that help traders evaluate the market structure and prepare for potential entries.
Designed for Forex, Crypto, Indices, Stocks , the LHD provides a clean and intuitive structure for navigating intraday liquidity grabs, session impulses, and directional bias shifts.
The indicator is built from three fully independent modules, each of which can be used separately:
Liquidity Hunt Detector (LHD)
Moving Average Ribbon (MA Ribbon)
Previous Day High/Low (PDH/PDL) levels
Liquidity Hunt Detector (LHD) Logic
1.1 Display LHD – Enables or disables the entire Liquidity Hunt Detector module.
1.2 Max Days – Number of previous days used to generate PDH/PDL levels.
1.3 GMT – Corrects all time-based calculations based on your broker/session timezone.
1.4 Calculation Method (Point A Logic)
1) Static Method
Point A = the session’s opening price.
Trigger lines are calculated strictly as a percentage of the move A → PDH or A → PDL.
Intraday fluctuations do not affect the calculation.
2) Dynamic Method
Point A updates using the current intraday high/low:
• If price forms a new low, Point A updates for the PDH-side calculations;
• If price forms a new high, Point A updates for the PDL-side calculations.
This produces trigger lines that reflect the true live market structure rather than a fixed opening reference.
1.5 Main OTT Time (Operational Trading Time)
This is the core time window during which the indicator:
• updates Point A;
• calculates trigger levels;
• validates PDH/PDL;
• draws AB / AC movement structure;
• generates entry signals.
Outside this window, no new signals or recalculations occur.
⚠ If your broker’s first candle opens at a non-standard time (e.g., 00:08), adjust the OTT start time to avoid visual artifacts.
1.6 Show Line A – Displays the opening price level (Point A) until the end of the OTT window.
Style, width, and color are customizable.
1.7 Show Line AB — Price Movement Toward PDH.
Static Method – Single line: A → PDH
Dynamic Method – Two segments:
• A → Daily Low;
• Daily Low → PDH.
If PDH is swept, the “B” label switches to Sweep PDH.
1.8 Show Line AC – Price Movement Toward PDL.
Static Method – Single line: A → PDL
Dynamic Method – Two segments:
• A → Daily High;
• Daily High → PDL.
If PDL is swept, the “C” label switches to Sweep PDL.
1.9 Show Trigger Up Line (LONG Trigger) – Defines the level where the Long signal can activate.
By default, at 50% of the A → PDH movement.
When price touches this line, the script may:
• show a LONG label;
• trigger an alert.
All visual parameters are customizable.
1.10 Show Trigger Up Line (LONG Trigger)
Same logic as Trigger Up, but based on A → PDL.
1.11 Show Main Zone (OTT Zone) – Visual background highlighting of the active OTT window.
Helps instantly see:
• whether signals are allowed;
• how much time remains in the trading window?
Color and opacity are adjustable.
1.12 Upper Zone (toward PDH) – Tracks the protected area towards PDH.
Updates dynamically with new highs.
1.13 Lower Zone (toward PDL) – Tracks the zone toward PDL.
Updates dynamically with new lows.
1.14 Show Labels – Displays reference labels (A, B, C, Trigger Up, Trigger Down).
Label size is customizable.
1.15 Add Price – Adds the exact price value to each label.
1.16 Change Color after Sweep PDH or PDL – After PDH or PDL is broken, the indicator automatically recolors lines and labels to visually confirm the sweep.
1.17 Show SHORT Label – Displays the SHORT entry label when all conditions for a bearish signal are met.
Style parameters are set in the previous blocks.
1.18 Alert on Bearish Trigger Down – Triggers an alert when the price activates the bearish trigger.
1.19 Show LONG Label – Displays the LONG entry label when bullish conditions are met.
Style parameters are set in the previous blocks.
1.20 Alert on Bullish Trigger Up – Triggers an alert when the price activates the bullish trigger.
1.21 Alerts Active Time – Defines a custom time interval during which trigger signals are allowed.
Even if price touches a trigger level,
❗ signals will NOT be generated outside this allowed time.
Useful for:
• avoiding Asian session signals;
• reducing noise in low-liquidity periods.
1.22 Labels and Alerts Display Mode
Two settings modes:
• On Trigger (Instant Mode) – Signals appear immediately when price touches the trigger.
• On Candle Close (Conservative Mode) – Signals form only after the candle closes beyond the trigger level.
A more conservative option.
1.23 Delay LHD Signal Until MA Ribbon Confirms Direction – If enabled, LHD signals will NOT fire until the MA Ribbon produces a matching directional signal.
Logic:
• Price hits the trigger → LHD conditions become “armed”;
• The indicator waits;
• When MA Ribbon confirms trend direction (Long/Short);
• The final LHD label + alert is generated.
This ensures LHD trades are filtered and aligned with MA-based trend confirmation.
⚠ Works only when the MA Ribbon module is active.

BVC - Optimized Trend StrengthOverview
BVC-Optimized Trend Strength is a next-generation trend evaluation system designed specifically for the Casablanca Stock Exchange (BVC).
It measures the true strength of bullish and bearish pressure using a combination of advanced technical filters:
• Trend structure via MM20 & MM50
• Market momentum via RSI
• Breakout confirmation using Donchian levels
• Volume validation based on BVC liquidity characteristics
• Slope strength of the fast moving average
• Weighted scoring engine (0 → 100)
• Non-repainting BUY/SELL signals
• Background regime detection (Bull / Bear / Neutral)
It is engineered to be highly configurable, lightweight, and fully adapted to BVC market behavior, where liquidity, breakout reliability, and trend confirmation behave differently from US or European markets.
⸻
How It Works
At every bar, the script evaluates 6 categories of trend evidence.
Each category contributes a configurable weight to a final Bull Score and Bear Score, each ranging from 0 to 100.
Bull Score Components
• Price above MM20
• MM20 above MM50
• Positive MA slope
• RSI above bullish threshold
• Donchian bullish breakout (non-repainting)
• Volume confirmation
Bear Score Components
Exact mirror of the bullish setup.
The result is a quantitative trend strength meter that reflects the true pressure behind the market.
⸻
Non-Repainting BUY & SELL Signals
Signals only trigger when the calculated score crosses your minimum threshold (default: 60).
Labels fire once, at the close of the candle, using:
MM crossovers
RSI regime shifts
Donchian breakouts
Trend structure & volume validation
All signals are non-repainting, meaning what you see historically is exactly what was printed live.
Labels include:
BUY • Very Strong (85/100)
SELL • Strong (65/100)
⸻
Background Regime Detection
The chart background automatically adapts to market conditions:
• Green → confirmed bullish regime
• Red → confirmed bearish regime
• Gray → mixed or transition phase
You may customize transparency and behavior.
⸻
Top-Right Dashboard
A clean summary panel displays:
• Price
• MM20
• MM50
• RSI
• Bull/Bear scores
• Recommended Action: BUY / HOLD, SELL / AVOID or WAIT
This gives traders an instant, objective view of market conditions.
⸻
Alerts
Built-in TradingView alerts:
• BUY Signal
• SELL Signal
Customize them directly through the TradingView alerts panel.
⸻
Ideal For
Swing traders
Position traders
Portfolio managers
Trend-followers
BVC investors wanting objective confirmation
Traders who hate repainting signals
⸻
Why It Works on the BVC
The BVC behaves differently from high-frequency markets.
Breakouts often require confirmation, low volume distorts momentum, and many assets move in structured waves.
This script integrates all these insights into a single, powerful and unified indicator—built for Morocco, by someone who trades Morocco.
⸻
Disclaimer
This indicator does not guarantee profits and should be combined with market structure, liquidity evaluation, and proper risk management. Past performance does not guarantee future results.

Fixed High Timeframe Moving AveragesFixed High Timeframe Moving Averages (W/D/4H)
Summary
This indicator plots essential, high-timeframe (HTF) Moving Averages onto your chart, **no matter which timeframe you are currently viewing**.
It is designed for traders who need multi-timeframe context at a glance. Stop switching charts to see where the 200-Week or 50-Day MA is—now you can see all critical HTF levels directly on your 5-minute (or any other) chart.
---
Who it’s for
Traders who rely on moving averages but like to work on lower chart timeframes while keeping higher timeframe context in sight. If you scalp on 1–15m yet want Weekly/Daily/4H MAs always visible, this is for you.
---
What it shows
Pinned (“fixed”) moving averages from higher timeframes—Weekly (20/100/200) , Daily (50/100/200/365) and 4H (200) —rendered on any chart timeframe. Your favorite HTF MAs stay on screen no matter what TF you’re currently analyzing.
---
Features
* **MA types:** SMA, EMA, VWMA, Hull.
* **Fully configurable:** toggle each line, set periods, colors, and thickness.
* **Two alert modes (see below):** intrabar vs confirmed HTF close.
* **Works on any symbol & chart TF** using `request.security` to fetch HTF data.
---
Alerts & Modes
This indicator solves the biggest problem with MTF alerts: false signals. You can choose one of two modes:
1. **Intrabar mode** — compares current chart price to the HTF MA. Triggers as soon as price crosses the HTF line; great for early signals but may update until the HTF bar closes.
2. **Confirmed mode** — checks HTF close vs HTF MA. Signals only on the higher-TF bar close; fewer false starts, no intrabar repainting on that TF.
Per-line *Cross Above / Cross Below* conditions are provided for all enabled MAs (e.g., “20W — Cross Above”, “365D — Cross Below”, etc.).
**How to use alerts:** add the script → “Create Alert” → pick any condition from the script’s list.
---
Why this helps
* Keeps Weekly/Daily structure visible while you execute on LTF.
* Classic anchors (e.g., 200D, 20W/100W/200W) are popular for trend bias, dynamic support/resistance, and pullback context.
* Lets you standardize MA references across all your lower-TF playbooks.
---
Notes on confirmation & repainting
* Intrabar signals can change until the higher-TF bar closes (that’s expected with multi-TF data).
* Confirmed mode waits for the HTF close—cleaner, but later. Choose what fits your workflow.
---
Quick setup
1. Pick `MA Type` (SMA/EMA/VWMA/Hull).
2. Enable the HTF lines you want (Weekly 20/100/200; Daily 50/100/200/365; 4H 200).
3. Choose `Alert Mode` (Intrabar vs Confirmed).
4. Style colors/widths to taste and set alerts on the lines you care about.
---
Good practice
* Combine HTF MAs with price action (swings, structure, liquidity grabs) rather than using them in isolation.
* Always validate signals in your execution TF and use a risk plan tailored to volatility.
* Protect your capital: position sizing, stops, and disciplined risk management matter more than any single line on the chart.
---
Disclaimer
For educational/informational purposes only; not financial advice. Trading involves risk—manage it responsibly.

MA Oscillator Map [ChartPrime]⯁ OVERVIEW
The MA Oscillator Map transforms moving average deviations into an oscillator framework that highlights overextended price conditions. By normalizing the difference between price and a chosen moving average, the tool maps oscillations between -100 and +100 , with gradient coloring to emphasize bullish and bearish momentum. When the oscillator cools from extreme levels (-100/100), the indicator marks potential reversal points and extends short-term levels from those extremes. A compact side table and dynamic bar coloring make momentum context visible at a glance.
⯁ KEY FEATURES
Oscillator Mapping (±100 Scale):
Price deviation from the selected MA is normalized into a percentage scale, allowing consistent overbought/oversold readings across assets and timeframes.
// MA
MA = ma(close, maLengthInput, maTypeInput)
diff = src - MA
maxVal = ta.highest(math.abs(diff), 50)
osc = diff / maxVal * 100
Customizable MA Types:
Choose SMA, EMA, SMMA, WMA, or VWMA to fine-tune the smoothing method that powers the oscillator.
Extreme Signal Diamonds:
When the oscillator retreats from +100 or -100, the script plots diamonds to flag potential exhaustion and reversal zones.
Dynamic Levels from Extremes:
Upper and lower dotted lines extend from recent overextension points, projecting temporary barriers until broken by price.
Gradient Bar Coloring:
Candles and oscillator values adopt a bullish-to-bearish gradient, making shifts in momentum instantly visible on the chart.
Compact Momentum Map:
A table at the chart’s edge plots the oscillator position with a gradient scale and live percentage label for precise momentum tracking.
⯁ USAGE
Watch for diamonds after the oscillator exits ±100 — these mark potential exhaustion zones.
Use extended dotted levels as short-term reference lines; if broken, trend continuation is favored.
Combine gradient bar coloring with oscillator shifts for confirmation of momentum reversals.
Experiment with different MA types to adapt sensitivity for trending vs. ranging markets.
Use the side momentum table as a quick-read gauge of trend strength in percent terms.
⯁ CONCLUSION
The MA Oscillator Map reframes moving average deviations into a visual momentum tracker with extremes, reversal signals, and dynamic levels. By blending oscillator math with intuitive visuals like gradient candles, diamonds, and a live gauge, it helps traders spot overextension, exhaustion, and momentum shifts across any market.

BND Trader (By Vahid.Jz) 🇮🇷🎉 The first Persian indicator on TradingView, released for free to celebrate my daughter's birthday. 🎉
**Trading Assistant (by Vahid.Jz)** is an all-in-one tool designed to simplify analysis and improve accuracy. It acts as an intelligent trading partner.
**Features:**
- Market Structure detection
- Multi-Timeframe “Third Eye” analysis
- Professional Order Blocks recognition
- Fair Value Gaps (FVGs) detection
- Customizable alerts
- Fully Persian interface
- Create Custom Alarm
Developed with love by **Vahid.Jz**, a trader and Pine Script enthusiast.
*“Trading is not a destination; it’s the journey — a path of learning, growth, and experience.”*

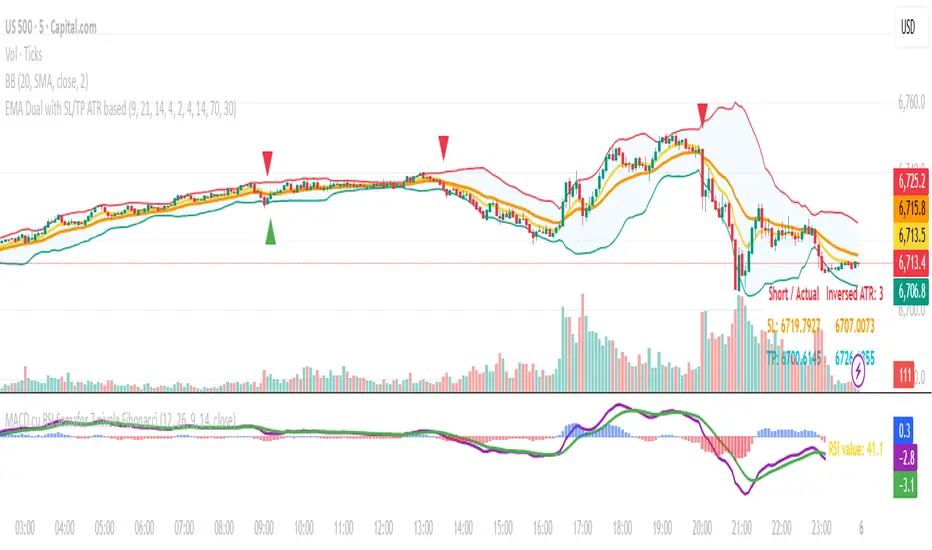
MACD cu RSI 7 Fibonacci color levelsMACD with RSI info
The RSI is display as value with changing color as Fibonacci levels.
Stalonte EMA - Stable Long-Term EMA with AlertsStalonte EMA - The Adaptive & Stable EMA - Almost Eternal
Here's why you will love "Stalonte":
The Stalonte (Stable Long-Term EMA) is a highly versatile trend-following tool. Unlike standard EMAs with fixed periods, it uses a configurable smoothing constant (alpha), allowing traders to dial in the exact level of responsiveness and stability they need. Finding the "sweet spot" (e.g., alpha ~0.03) creates a uniquely effective moving average: it is smooth enough to filter out noise and identify safe, high-probability trends, yet responsive enough to provide actionable signals without extreme lag. It includes alerts for crossovers and retests.
Pros and Cons of the Stalonte EMA
Pros:
Unparalleled Adaptability: This is its greatest strength. The alpha input lets you seamlessly transform the indicator from an ultra-slow "trend-revealer" (low alpha) into a highly effective and "safe" trend-following tool (medium alpha, e.g., 0.03), all the way to a more reactive one.
Optimized for Safety & Signal Quality: As you astutely pointed out, with the proper setting (like 0.03), it finds the perfect balance. It provides a smoother path than a standard 20-50 period EMA, which reduces whipsaws and false breakouts, leading to safer, higher-confidence signals.
Superior Trend Visualization: It gives a cleaner and more intuitive representation of the market's direction than many conventional moving averages, making it easier to "see" the trend and stick with it.
Objective Dynamic Support/Resistance: The line created with a medium alpha setting acts as a powerful dynamic support in uptrends and resistance in downtrends, offering excellent areas for entries on retests with integrated alerts.
Cons:
Requires Calibration: The only "con" is that its performance is not plug-and-play; it requires the user to find their optimal alpha value for their specific trading style and the instrument they are trading. This demands a period of testing and customization, which a standard 50-period EMA does not.
Conceptual Hurdle: For traders only familiar with period-based EMAs, the concept of a "smoothing constant" can be initially confusing compared to simply setting a "length."
In summary:
The Stalonte EMA is not a laggy relic. It is a highly sophisticated and adaptable tool. Its design allows for precise tuning, enabling a trader to discover a setting that offers a superior blend of stability and responsiveness—a "sweet spot" that provides safer and often more effective signals than many traditional moving averages. Thank you for pushing for a more accurate and fair assessment.
Use Case Example:
You can combine it with classical EMAs to find the perfect entry.
HMA super trade by @arkancapMulti-HMA with five customizable moving averages: visual colors, transparency via picker, flexible line styles, and label/alert for HMA50↔HMA100 crossovers. Lightweight, readable, and ready for trading templates.
Мульти-HMA с пятью настраиваемыми скользящими: визуальные цвета, прозрачность через пикер, гибкие стили линий и метка/алерт для пересечений HMA50↔HMA100. Лёгкий, читабельный и готовый к торговым шаблонам.
Five Hull moving averages that show the trend and indicate key crossovers. Customize colors, thickness, and get accurate alerts. Suitable for scalping and multi-timeframes. Support for filling between moving averages to visually highlight areas of strength or weakness.
Пять Hull-скользящих, которые показывают тренд и подсказывают ключевые пересечения. Настраивай цвета, толщину и получай аккуратные алерты. Подходит для скальпа и мульти-таймфрейма. Поддержка заливки между скользящими для наглядного выделения зон силы или слабости.
