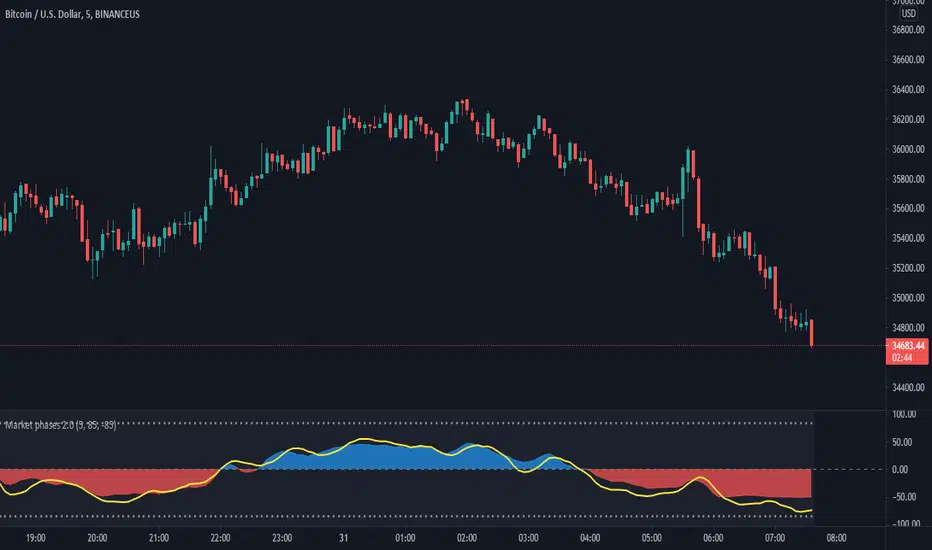
Market phases 2.0The Market Phase 2.0 indicator is designed to display the following features:
1) The TREND OSCILLATOR : This trend oscillator indicates the trend of the stock/instrument. It is calculated on the basis of number of positive candles or negative candles formed during a specific period.
The oscillator oscillates around the zero horizontal line. The trend is considered bullish if the oscillator value is positive and the trend is considered negative if the oscillator value is negative.
2) The MOMENTUM OSCILLATOR:
The momentum oscillator indicates the short term momentum of the stock/instrument. It is calculated on the rate of change of close price for a specific period in the past.
The Momentum oscillator oscillates around the zero horizontal line. If the momentum oscillator has a positive value, the momentum is considered to be on the bullish side and similarly if the momentum oscillator has a negative value, the momentum is considered to be on the bearish side.
3) The SIGNAL LINE: The signal line is represented by the yellow color line. The Signal line combines the value of the Trend oscillator and the Momentum oscillator. The signal also moves around the zero line. There are two dotted lines above and below the zero line.
When the signal line crosses the upper dotted line, it indicates that the stock/instrument has moved on the upper side too quickly or sharply and the ongoing move may not continue for long. It may also be considered as overbought at that point. A red triangle appears at that point.
Similarly, when the signal line crosses the lower dotted line, it indicates that the stock/instrument has moved on the downside too quickly or sharply and the ongoing down move may not continue for long. It may also be considered as oversold at that point. A green triangle appears at that point.
The values for the look back period of the signal line and the values for the upper range and lower range of the indicator can be changed by going to the settings of the indicator.
***Disclaimer: The market movement depends upon a lot of factors which are beyond the scope of this indicator. Hence the indicator may display results not intended on rare occasions.
Trading in the markets involves involves huge risks and one should always follow his/her own research before taking any trading decisions.
Momentumanalysis
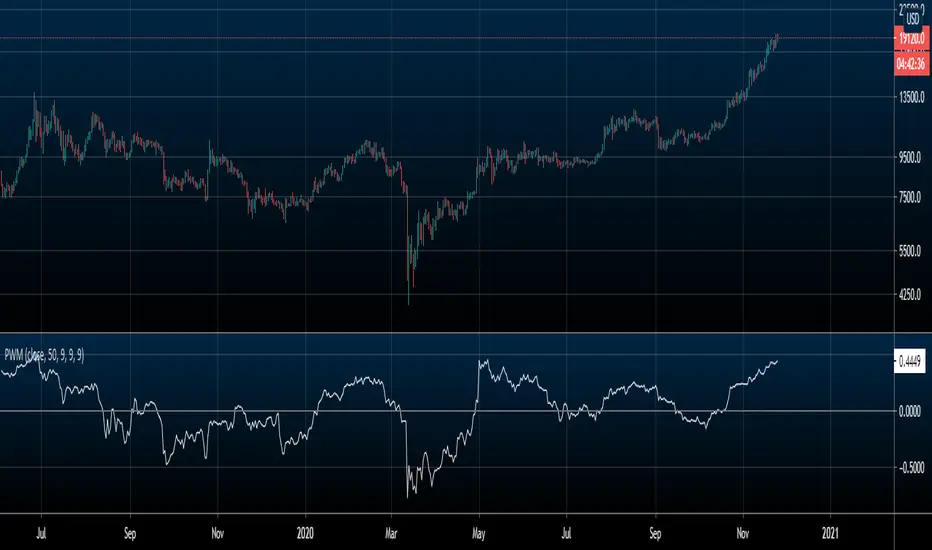
Price Weighted MomentumThis indicator is a momentum indicator that is standardized by price. A.K.A (momentum / price)
The purpose of this indicator is to compare momentum between different assets regardless of price.
EX: Bitcoin will always have more momentum than XLE because it's price is $19000 (as of writing this) compared to XLE's price of $40 (as of writing this). But if you divide the momentum by price, you get a standardized value to better compare the 2.
This indicator can be used to compare everything on TradingView.
HOW TO USE/INTERPRET
Positive values denote an uptrend
Negative values denote a downtrend
A value of 0 (or very very close to 0) denotes sideways price action
WHAT'S INCLUDED
Price Weighted Momentum (Unsmoothed by default)
Optional smoothing with either a simple or exponential moving average
Side note: I only added functionality of smoothing for EMA and SMA for my personal uses, but if you want a version of this with another way of smoothing (e.g. HMA, SSMA, etc.) that you would like, the cost of me adding that for you is a follow on Twitter. Just DM me there :)
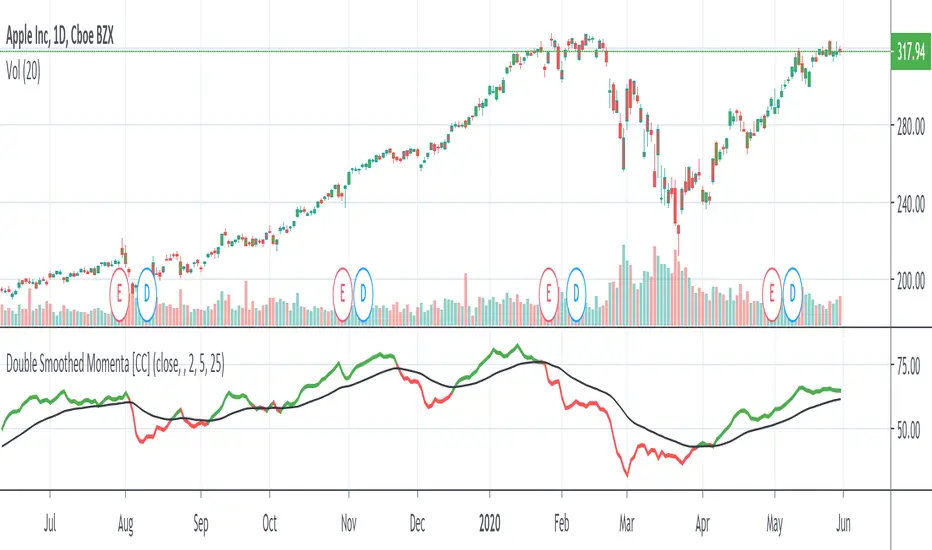
Double Smoothed MomentaDouble Smoothed Momenta was created by William Blau (Stocks & Commodities V. 9:5 (202-205)). His original indicator didn't use a signal period so I added one to notify you when to buy or sell. Buy when the indicator goes over the signal line and sell when it is falls below the signal line.
Let me know what other indicators you would like me to write scripts for!
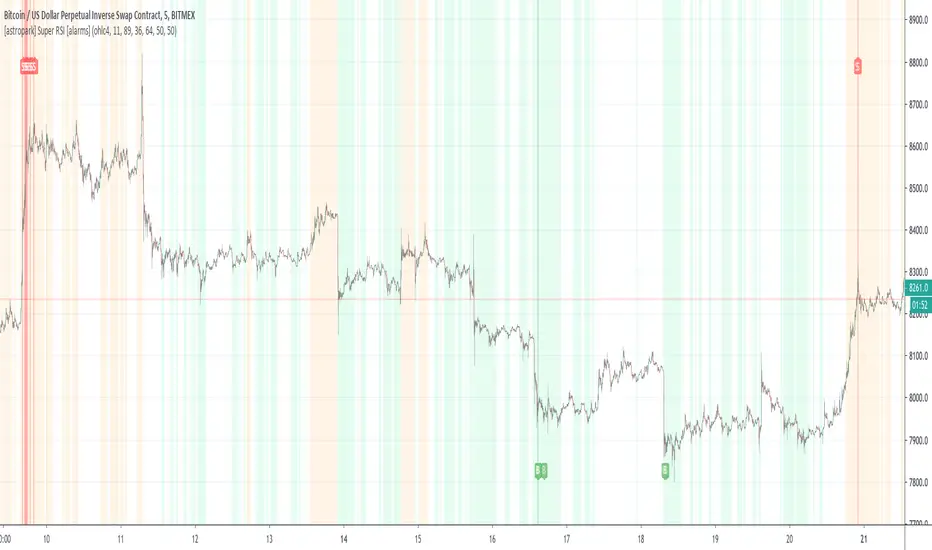
[astropark] Super RSI [alarms]Dear Followers,
today a new Scalper Tool , which works great on 3 minutes and 5 minutes timeframes , but also down to 1m and up to 30m!
I called it " Super RSI ", as it is based on RSI and inherits some basic functionality from it.
If you check its settings, you will see that you can have 3 different buy-sell sources (first two are active by default):
STRONG BUY/SELL : buy when white area deeply falls into oversold-red zone and sell when white area gets into overbought-green zone (you can set and edit at which level oversold and overbought zones start);
CROSSES : buy when the black RSI line in the middle between red and green area cross under the buy cross limit value and sell when it crosso over the sell cross limit value (you can set and edit specific cross ranges for both buy and sell);
WEAK BUY/SELL : buy when green area at least go below 50 level and sell when red area at least goes above 50 level (you can edit both levels); these conditions are highlighted as background color and are very useful for taking (at least partial) profits in trades.
By default the script will be placed as overlay on the chart, but
> you can activate the oscillator plot by disabling the "hide all plot" option
> and place it in a below pane by clicking on the black arrow at then end on the indicator name in chart and selecting "move to -> a new pane below"
This strategy can trigger till 10 buy or 10 sell signals in a row before reverting, so use a proper money management .
Strategy results are calculated on 20 trading days using 1000$ as initial capital and working at 10x leverage.
The user who wants to use this strategy, especially via an automated bot, must always set a stoploss at 3-5% from entry point or use a proper risk management strategy .
This is not the "Holy Grail", so use it with caution.
This script will let you set all notifications you may need in order to be alerted on each triggered signals.
The backtesting script version of this indicator, which will let you backtest this script and find best settings for your preferred market, can be found here below:
This is a premium indicator , so send me a private message in order to get access to this script .
[astropark] Super RSI [strategy]Dear Followers,
today a new Scalper Tool , which works great on 3 minutes and 5 minutes timeframes , but also down to 1m and up to 30m!
I called it " Super RSI ", as it is based on RSI and inherits some basic functionality from it.
If you check its settings, you will see that you can have 3 different buy-sell sources (first two are active by default):
STRONG BUY/SELL : buy when white area deeply falls into oversold-red zone and sell when white area gets into overbought-green zone (you can set and edit at which level oversold and overbought zones start);
CROSSES : buy when the black RSI line in the middle between red and green area cross under the buy cross limit value and sell when it crosso over the sell cross limit value (you can set and edit specific cross ranges for both buy and sell);
WEAK BUY/SELL : buy when green area at least go below 50 level and sell when red area at least goes above 50 level (you can edit both levels); these conditions are highlighted as background color and are very useful for taking (at least partial) profits in trades.
By default the script will be placed as oscillator on a specific pane below the chart, but
> you can disable the oscillator plot by enabling the "hide all plot" option
> and place it as overlay on chart by clicking on the black arrow at then end on the indicator name in chart and selecting "move to -> existing pane above"
This strategy can trigger till 10 buy or 10 sell signals in a row before reverting, so use a proper money management .
Strategy results are calculated on 20 trading days using 1000$ as initial capital and working at 10x leverage.
The user who wants to use this strategy, especially via an automated bot, must always set a stoploss at 3-5% from entry point or use a proper risk management strategy .
This is not the "Holy Grail", so use it with caution.
This script will let you backtest the strategy and find best settings for your preferred market.
The alarms script version of this indicator, which will let you set all notifications you may need in order to be alerted on each triggered signals, can be found by searching for " Super RSI".
This is a premium indicator , so send me a private message in order to get access to this script .

[astropark] Super Stochastic RSI [alarms]Dear Followers,
today a new Scalper Tool , which works great on 3 minutes and 5 minutes timeframes !
I called it " Super Stochastic RSI ", as it is based on StochRSI and inherits some basic functionality from it.
If you check its settings, you will see that you can have 3 different buy-sell sources (first two are active by default):
STRONG BUY/SELL : buy when green area deeply falls into oversold zone and sell when red area gets into overbought zone (you can set and edit at which level oversold and overbought zones start);
K/D CROSSES : buy when k-line cross above d-line and sell viceversa (you can set and edit specific cross ranges for both buy and sell);
WEAK BUY/SELL : buy when green area at least go below 50 level and sell when red area at least goes above 50 level (you can edit both levels); these conditions are highlighted as background color and are very useful for taking (at least partial) profits in trades.
By default the script will be placed as overlay on the chart, but
> you can activate the oscillator plot by disabling the "hide all plot" option
> and place it in a below pane by clicking on the black arrow at then end on the indicator name in chart and selecting "move to -> a new pane below"
This strategy can trigger till 10 buy or 10 sell signals in a row before reverting, so use a proper money management .
Strategy results are calculated on 20 trading days using 1000$ as initial capital and working at 10x leverage.
The user who wants to use this strategy, especially via an automated bot, must always set a stoploss at 3-5% from entry point or use a proper risk management strategy .
This is not the "Holy Grail", so use it with caution.
This script will let you set all notifications you may need in order to be alerted on each triggered signals.
The backtesting script version of this indicator, which will let you backtest this script and find best settings for your preferred market, can be found here below:
This is a premium indicator , so send me a private message in order to get access to this script .

[astropark] Super Stochastic RSI [strategy]Dear Followers,
today a new Scalper Tool , which works great on 3 minutes and 5 minutes timeframes !
I called it " Super Stochastic RSI ", as it is based on StochRSI and inherits some basic functionality from it.
If you check its settings, you will see that you can have 3 different buy-sell sources (first two are active by default):
STRONG BUY/SELL : buy when green area deeply falls into oversold zone and sell when red area gets into overbought zone (you can set and edit at which level oversold and overbought zones start);
K/D CROSSES : buy when k-line cross above d-line and sell viceversa (you can set and edit specific cross ranges for both buy and sell);
WEAK BUY/SELL : buy when green area at least go below 50 level and sell when red area at least goes above 50 level (you can edit both levels); these conditions are highlighted as background color and are very useful for taking (at least partial) profits in trades.
By default the script will be placed as oscillator on a specific pane below the chart, but
> you can disable the oscillator plot by enabling the "hide all plot" option
> and place it as overlay on chart by clicking on the black arrow at then end on the indicator name in chart and selecting "move to -> existing pane above"
This strategy can trigger till 10 buy or 10 sell signals in a row before reverting, so use a proper money management .
Strategy results are calculated on 20 trading days using 1000$ as initial capital and working at 10x leverage.
The user who wants to use this strategy, especially via an automated bot, must always set a stoploss at 3-5% from entry point or use a proper risk management strategy .
This is not the "Holy Grail", so use it with caution.
This script will let you backtest the strategy and find best settings for your preferred market.
The alarms script version of this indicator, which will let you set all notifications you may need in order to be alerted on each triggered signals, can be found here below:
This is a premium indicator , so send me a private message in order to get access to this script .

Cyber Momentum StrategyStrategy base on the PRISM Oscillators Set as it foundation, with stop-loss algorithm integrated.
~ * ~ * ~ * ~ * ~ * ~ * ~ * ~ * ~ * ~ * ~ * ~ * ~ * ~ * ~ * ~ * ~ * ~ * ~ * ~ * ~
Note:
In no way is this intended as a financial/investment/trading advice. You are responsible for your own investment decisions and trades.
Please exercise your own judgement for your own trades base on your own risk-aversion level and goals as an investor or a trader. The use of OTHER indicators and analysis in conjunction (tailored to your own style of investing/trading) will help improve confidence of your analysis, for you to determine your own trade decisions.
~ * ~ * ~ * ~ * ~ * ~ * ~ * ~ * ~ * ~ * ~ * ~ * ~ * ~ * ~ * ~ * ~ * ~ * ~ * ~ * ~
Please check out my other indicators sets and series, e.g.
LIVIDITIUM (dynamic levels),
AEONDRIFT (multi-levels standard deviation bands),
FUSIONGAPS (MA based oscillators),
MAJESTIC (Momentum/Acceleration/Jerk Oscillators),
PRISM (pSAR based oscillator, with RSI/StochRSI as well as Momentum/Acceleration/Jerk indicators),
PDF (parabolic SAR /w HighLow Trends Indicator/Bar-color-marking + Dynamic Fib Retrace and Extension Level)
and more to come.
Constructive feedback and suggestions are welcome.
To continue to keep this strategy free to use, especially if it has benefited your trades, please consider tipping a little of any gains you've made to my HRT fund. =D
cybernetwork @ EOS
37DzRVwodp5UZBYjCKvVoZ5bDdDqhr7798 @ BTC
MPr8Zhmpsx2uh3F5R4WD98MRJJpwuLBhA3 @ LTC
1Je6c1vvSCW7V2vA6RYDt6CEvqGYgT44F4 @ BCH
AS259bXGthuj4VZ1QPzD39W3ut4fQV5giC @ NEO
rDonew8fRDkZFv7dZYe5w3L1vJSE51zFAx @ Ripple XRP
0xc0161d27201914FC0bAe5e350a193c8658fc4742 @ ETH
GAX6UDAJ52OGZW4FVVG3WLGIOJLGG2C7CTO5ZDUK2P6M6QMYBJMSJTDL @ Stellar XLM
xrb_16s8cj8eoangfa96shsnkir3wctdzy76ajui4zexek6xmqssweu85rdjxrt4 @ Nano
~ JuniAiko
(=^~^=)v~
