Multi-Timeframe mybullandbearThis Multi-Timeframe RSI + Ultimate MA System combines RSI and customizable moving averages (SMA, EMA, WMA, HullMA, VWMA, RMA, TEMA) to generate powerful buy/sell signals across 5m, 15m, 1h, and 4h timeframes. Visualize signals with clear chart labels (BUY/SELL) and a multi-timeframe table showing RSI status, MA trends, and signal strength. Ideal for traders seeking trend confirmation and reversal signals.
Enable/disable RSI, MA cross, or combined signals, and adjust MA types/lengths. Use aligned signals across timeframes for stronger entries. Best with backtesting for your asset.
Momentum Göstergesi (MOM)
3CRGANG - SUPPLY/DEMAND ZONESOverview
The "3CRGANG - SUPPLY/DEMAND ZONES" indicator is a sophisticated tool designed to identify, classify, and visualize dynamic supply (resistance) and demand (support) zones on your TradingView charts. It goes beyond basic level plotting by incorporating a state-based system that tracks how zones evolve based on price interactions, helping traders anticipate potential reversals, continuations, or breakdowns at key levels. Zones are categorized into states like Untested, Verified, Weak, Flipped, and Broken, providing contextual insights into their strength and reliability. This indicator is particularly useful for swing traders, scalpers, and position traders who rely on price action around institutional levels, as it filters noise and highlights actionable zones with customizable alerts and visual aids.
Built on Pine Script v6, it overlays directly on your chart with semi-transparent boxes for zones, optional labels for quick reference, and alert triggers for zone tests. The invite-only access ensures users benefit from its proprietary enhancements, making it a premium alternative to generic zone indicators.
How It's Built: Core Concepts and Calculations
At its foundation, the indicator detects potential supply and demand zones using a fractal-based pivot detection method, which identifies local highs and lows by comparing a central bar's price to surrounding bars within a validation window. This window is dynamically adjusted via a "Fractal Sensitivity Factor" (default 6.0), which scales the lookback period relative to your chart's timeframe—ensuring zones adapt to market volatility without over- or under-fitting. For example, on a 15-minute chart, this might equate to checking 18-24 bars around a candidate pivot for confirmation.
Once a fractal pivot is confirmed:
Zone Boundaries: The zone is constructed around the pivot high/low, extended by a fraction of the Average True Range (ATR, period 7) using the "Zone Boundary ATR Multiplier" (default 0.3). This creates a band that accounts for typical price fluctuations, preventing overly tight or loose zones. A subtle "Zone Fuzz Factor" (default 0.15) adds a minor buffer to the ATR-derived extension, allowing for fine-tuning in choppy markets without altering the core range.
Merging Overlaps: To avoid clutter, overlapping zones of the same type (or flipped counterparts) are intelligently merged through up to 2-3 passes (configurable via "Max Merge Passes"). This consolidation increases the "test count" for the resulting zone, reflecting cumulative price rejections and enhancing its perceived strength.
Zone Testing and Classification: Price interactions with zones are evaluated using one of two methods:
Dynamic - Bars: Counts tests when price wicks into the zone from outside or closes out after entering, with a minimum gap (0-2 bars) to prevent rapid-fire counts in ranging markets.
Mechanical - Pivots: Enhances the dynamic method by requiring a mechanical pivot (e.g., via TradingView's built-in pivothigh/pivotlow) within the zone during the test, adding a layer of confirmation for more conservative signals. Tests are tallied with a "Weak Zone Test Threshold" (default 1), classifying zones as:
Untested: No interactions yet—fresh levels with high potential.
Weak: 1 or fewer meaningful tests—early signals that may fade.
Verified: Multiple tests (above threshold)—strong, repeatedly respected levels.
Flipped: A broken zone that reverses role (e.g., resistance becomes support), based on a decisive close beyond the boundary.
Broken: Permanently invalidated by a strong breakout, optionally displayed for historical context.
Time and Session Integration: Zones are timestamped and limited to a "Back Limit" (default 500 bars) for performance. It incorporates a custom holiday library (importing from RotemB's LIBRARY_3CRGANG_Holidays_Library) to detect closures across major exchanges (NYSE, LSE, FSE, SSX, TSE, HKSE), adjusting session times for half-days and full holidays. Alerts are filtered by user-selected sessions, weekends, and a "Do Not Disturb" (DND) mode with timezone-aware scheduling (e.g., UTC+3 Jerusalem default, selectable from 90+ global options).
This combination of fractal detection, ATR-based sizing, multi-pass merging, and test-driven state evolution draws from classic supply/demand principles but refines them with proprietary logic to handle real-world market dynamics, such as volatility clustering and institutional session biases.
Why It’s Useful
Supply and demand zones are foundational to price action trading, representing areas where large orders accumulate and cause reversals or pauses. This indicator streamlines the process by automating zone discovery and maintenance, saving time compared to manual drawing. Its state system adds predictive value: Verified zones often signal high-probability bounces, while Flipped ones highlight role reversals for trend continuation trades. Alerts notify you of tests in real-time, ideal for multi-chart monitoring, and session/holiday filters reduce false signals during low-liquidity periods (e.g., no alerts on Christmas for NYSE-linked assets).
Traders benefit from reduced emotional bias—zones "age out" beyond the back limit, focusing on recent action—and customizable visuals prevent chart overload. In volatile markets like forex or crypto, the ATR-adjusted boundaries adapt better than fixed-percentage methods, while the test count helps gauge exhaustion (e.g., over-tested Weak zones may signal impending breaks). Overall, it enhances decision-making by providing not just levels, but their evolving context.
How to Use It
Add to Chart:
Search for "3CRGANG - SUPPLY/DEMAND ZONES" in TradingView's invite-only scripts (access required). Apply to any timeframe from 1-minute to yearly, though it shines on intraday (15M-4H) for active trading.
Configure Inputs:
Test Mode: Choose "Dynamic - Bars" for sensitive, wick-focused testing or "Mechanical - Pivots" for stricter, pivot-confirmed interactions. Adjust "Minimum Test Gap" (0-2) to filter rapid tests and "Weak Zone Test Threshold" (1-3) to define strength tiers.
Pivot Filters: Tune "Fractal Sensitivity Factor" (5-14) for fewer/more zones—higher values for smoother trends, lower for chop.
Zone Width: Set "Zone Boundary ATR Multiplier" (0-1) for tighter/wider bands; use "Zone Fuzz Factor" (0-1) sparingly for boundary tweaks.
Visual: Select zone style (Solid/Dashed/Dotted), linewidth (1-3), and horizontal extension (None/Right/Both). Toggle visibility per state (e.g., hide Broken for cleaner charts).
Labels: Enable "Show Labels" for state/type info; add "Show Zone Size" (in pips/$) and "Show Test Count" for details. Adjust shift for positioning.
Alerts: Enable per state (Untested/Weak/Verified/Flipped). Filter by sessions (e.g., enable NYSE for US equities), holidays, weekends, and DND (set time ranges in your timezone to mute notifications).
Colors: Customize per state/type for intuitive visuals (e.g., red shades for resistance).
Trading Application:
Entries: Buy at Verified Demand (green) tests, sell at Verified Supply (red). Use Flipped zones for breakout confirmation.
Exits/Risk: Place stops beyond zone boundaries; trail profits on Weak/Flipped signals indicating fading strength.
Alerts Setup: In TradingView's alert dialog, select this indicator and configure for "alert() function calls only" to receive zone-test notifications.
Multi-Timeframe: View higher-TF zones on lower charts for confluence (e.g., daily zones on 1H).
Best Practices: Combine with volume or oscillators; backtest on your asset to optimize sensitivity.
Chart Example: XAG/USD (m5 timeframe)
Chart Notes
The chart displays zones on XAGUSD (M5 timeframe), presenting a clear price action structure with three distinct zones. A green Verified Support zone, marked with a translucent green box, indicates a robust demand level that has been tested multiple times and held firm. A blue Weak Support zone, outlined with a lighter blue box, reflects a less-tested support level with fewer rejections, suggesting lower reliability. A gold Flipped Resistance zone, highlighted with a golden box, initially acted as a resistance with rejections before breaking through and retesting as a support zone, showcasing its transition. Labels appear to the right of each zone, displaying details such as "VERIFIED SUPPORT (6.72 points, T=3)" for the Verified zone, "WEAK SUPPORT (6.9 points, T=1)" for the Weak zone, and "FLIPPED SUPPORT (3.85 points, T=10)" for the Flipped zone, with sizes in dollars (or pips if under $1) and test counts included. Zones extend horizontally to the right based on the user-defined shift setting, with customizable dashed or dotted borders for enhanced visual clarity.
Requires 500 bars of history for optimal performance. Alerts are muted during holidays (e.g., Lunar New Year) or Do Not Disturb periods.
Settings
Test Mode: Choose method (Dynamic - Bars or Mechanical - Pivots), set minimum test gap (0-2 bars), and weak zone threshold (1-3 tests).
General: Adjust back limit (250-1000 bars).
Pivot Filters: Set fractal sensitivity factor (5-14) and max merge passes (1-3).
Zone Width: Define ATR multiplier (0-1) and fuzz factor (0-1).
Visual: Select zone style (Solid, Dashed, Dotted), line width (1-3), shift end right (1-50 bars), and extension (None, Right, Both).
Visibility: Toggle display for each state (Untested, Verified, Weak, Flipped, Broken).
Labels: Enable labels, set shift (1-50 bars), size, and show size/test counts.
Alerts: Enable alerts by state (Untested, Weak, Verified, Flipped).
DND Settings: Set timezone, Do Not Disturb hours, and weekend alerts.
Sessions Alerts: Filter alerts by exchange (NYSE, LSE, etc.) and holiday settings.
Colors: Assign colors to each zone state and type.
Why It's Unique and Worth Invite-Only Access
While supply/demand indicators exist, this one stands out through its integrated ecosystem: adaptive fractal pivots with sensitivity scaling, multi-pass overlap merging that preserves test history, and a nuanced state machine that evolves zones based on configurable test mechanics—far beyond simple high/low plotting or basic breakouts. The proprietary blending of ATR fuzzing, retroactive test validation during zone creation, and global exchange holiday/session filtering (with half-day adjustments) minimizes irrelevant alerts, a common pain point in public scripts. It doesn't rely solely on built-ins or educational code; instead, it enhances them with custom logic for zone lifecycle management, making it resilient across assets and timeframes.
This originality justifies its closed-source nature—revealing the full interplay of fractal windowing, merge algorithms, and alert conditioning could dilute its edge. As an invite-only script, it provides clear value through premium features like timezone-aware DND, comprehensive holiday integration (e.g., Lunar New Year for HKSE), and state-aware alerts, which aren't replicated in free alternatives. Traders seeking an efficient, low-noise tool for institutional-level analysis will find it worth the access, as it delivers actionable insights that generic indicators overlook.
Disclaimer
This indicator assists in zone identification but does not guarantee success. Trading involves risk, and past performance is not indicative of future results. Always use proper risk management.

Algorithmic Value Oscillator [CRYPTIK1]Algorithmic Value Oscillator
Introduction: What is the AVO? Welcome to the Algorithmic Value Oscillator (AVO), a powerful, modern momentum indicator that reframes the classic "overbought" and "oversold" concept. Instead of relying on a fixed lookback period like a standard RSI, the AVO measures the current price relative to a significant, higher-timeframe Value Zone .
This gives you a more contextual and structural understanding of price. The core question it answers is not just "Is the price moving up or down quickly?" but rather, " Where is the current price in relation to its recently established area of value? "
This allows traders to identify true "premium" (overbought) and "discount" (oversold) levels with greater accuracy, all presented with a clean, futuristic aesthetic designed for the modern trader.
The Core Concept: Price vs. Value The market is constantly trying to find equilibrium. The AVO is built on the principle that the high and low of a significant prior period (like the previous day or week) create a powerful area of perceived value.
The Value Zone: The range between the high and low of the selected higher timeframe.
Premium Territory (Distribution Zone): When the oscillator moves into the glowing pink/purple zone above +100, it is trading at a premium.
Discount Territory (Accumulation Zone): When the oscillator moves into the glowing teal/blue zone below -100, it is trading at a discount.
Key Features
1. Glowing Gradient Oscillator: The main oscillator line is a dynamic visual guide to momentum.
The line changes color smoothly from light blue to neon teal as bullish momentum increases.
It shifts from hot pink to bright purple as bearish momentum increases.
Multiple transparent layers create a professional "glow" effect, making the trend easy to see at a glance.
2. Dynamic Volatility Histogram: This histogram at the bottom of the indicator is a custom volatility meter. It has been engineered to be adaptive, ensuring that the visual differences between high and low volatility are always clear and dramatic, no matter your zoom level. It uses a multi-color gradient to visualize the intensity of market volatility.
3. Volatility Regime Dashboard: This simple on-screen table analyzes the histogram and provides a clear, one-word summary of the current market state: Compressing, Stable, or Expanding.
How to Use the AVO: Trading Strategies
1. Reversion Trading This is the most direct way to use the indicator.
Look for Buys: When the AVO line drops into the teal "Accumulation Zone" (below -100), the price is trading at a discount. Watch for the oscillator to form a bottom and start turning up as a signal that buying pressure is returning.
Look for Sells: When the AVO line moves into the pink "Distribution Zone" (above +100), the price is trading at a premium. Watch for the oscillator to form a peak and start turning down as a signal that selling pressure is increasing.
2. Best Practices & Settings
Timeframe Synergy: The AVO is most effective when your chart timeframe is lower than your selected "Value Zone Source." For example, if you trade on the 1-hour chart, set your Value Zone to "Previous Day."
Confirmation is Key: This indicator provides powerful context, but it should not be used in isolation. Always combine its readings with your primary analysis, such as market structure and support/resistance levels.

Multi Momentum 10/21/42/63 — Histogram + 2xSMAMY MM INDICATOR INDIRED BY KARADI
It averages four rate-of-change snapshots of price, all anchored at today’s close.
If “Show as %” is on, the value is multiplied by 100.
Each term is a simple momentum/ROC over a different lookback.
Combining 10, 21, 42, 63 bars blends short, medium, and intermediate horizons into one number.
Positive MM → average upward pressure across those horizons; negative MM → average downward pressure.
Why those lengths?
They roughly stack into ~2× progression (10→21≈2×10, 21→42=2×21, 63≈1.5×42). That creates a “multi-scale” momentum that’s less noisy than a single fast ROC but more responsive than a long ROC alone.
How to read the panel
Gray histogram = raw Multi-Momentum value each bar.
SMA Fast/Slow lines (defaults 12 & 26 over the MM values) = smoothing of the histogram to show the trend of momentum itself.
Typical signals
Zero-line context:
Above 0 → bullish momentum regime on average.
Below 0 → bearish regime.
Crosses of SMA Fast & Slow: momentum trend shifts (fast above slow = improving momentum; fast below slow = deteriorating).
Histogram vs SMA lines: widening distance suggests strengthening momentum; narrowing suggests momentum is fading.
Divergences: price makes a new high/low but MM doesn’t → potential exhaustion.
Compared to a classic ROC
A single ROC(20) is very sensitive to that one window.
MM averages several windows, smoothing idiosyncrasies (e.g., a one-off spike 21 bars ago) and reducing “lookback luck.”
Settings & customization
Lookbacks (10/21/42/63): you can tweak for your asset/timeframe; the idea is to mix short→medium horizons.
Percent vs raw ratio: percent is easier to compare across symbols.
SMA lengths: shorter = more reactive but choppier; longer = smoother but slower.
Practical tips
Use regime + signal: trade longs primarily when MM>0 and fast SMA>slow SMA; consider shorts when MM<0 and fast

Momentum Shift Oscillator (MSO) [SharpStrat]Momentum Shift Oscillator (MSO)
The Momentum Shift Oscillator (MSO) is a custom-built oscillator that combines the best parts of RSI, ROC, and MACD into one clean, powerful indicator. Its goal is to identify when momentum shifts are happening in the market, filtering out noise that a single momentum tool might miss.
Why MSO?
Most traders rely on just one momentum indicator like RSI, MACD, or ROC. Each has strengths, but also weaknesses:
RSI → great for overbought/oversold, but often lags in strong trends.
ROC (Rate of Change) → captures price velocity, but can be too noisy.
MACD Histogram → shows trend strength shifts, but reacts slowly at times.
By blending all three (with adjustable weights), MSO gives a balanced view of momentum. It captures trend strength, velocity, and exhaustion in one oscillator.
How MSO Works
Inputs:
RSI, ROC, and MACD Histogram are calculated with user-defined lengths.
Each is normalized (so they share the same scale of -100 to +100).
You can set weights for RSI, ROC, and MACD to emphasize different components.
The components are blended into a single oscillator value.
Smoothing (SMA, EMA, or WMA) is applied.
MSO plots as a smooth line, color-coded by slope (green rising, red falling).
Overbought and oversold levels are plotted (default: +60 / -60).
A zero line helps identify bullish vs bearish momentum shifts.
How to trade with MSO
Zero line crossovers → crossing above zero suggests bullish momentum; crossing below zero suggests bearish momentum.
Overbought and oversold zones → values above +60 may indicate exhaustion in bullish moves; values below -60 may signal exhaustion in bearish moves.
Slope of the line → a rising line shows strengthening momentum, while a falling line signals fading momentum.
Divergences → if price makes new highs or lows but MSO does not, it can point to a possible reversal.
Why MSO is Unique
Combines trend + momentum + velocity into one view.
Filters noise better than standalone RSI/MACD.
Adapts to both trend-following and mean-reversion styles.
Can be used across any timeframe for confirmation.

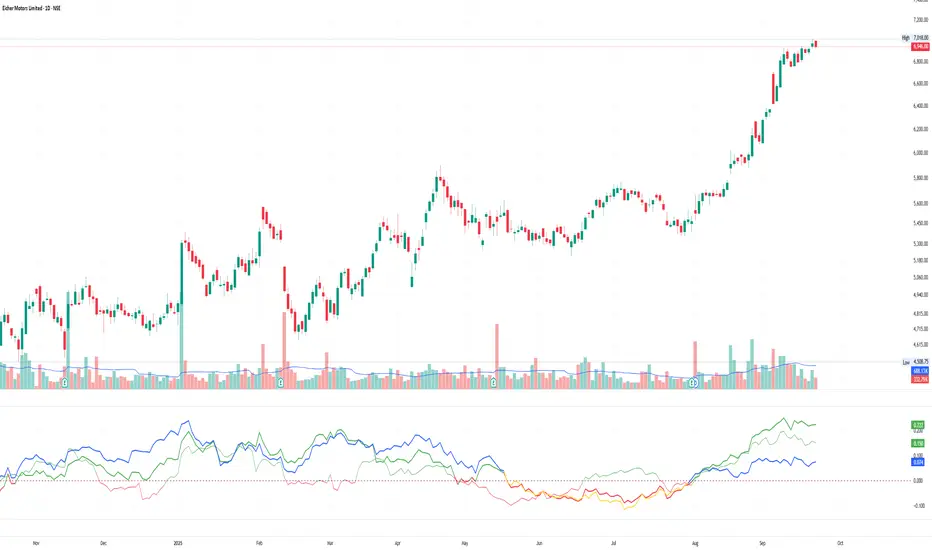
Multiple Relative Strength IndicatorThis indicator is used to display multiple Relative strength of a stock compared with another.
Default value for the first Relative strength period is 55
Default value for the second Relative strength period is 21
Default value for the comparable Index is CNX500
You can add the sectorial index for sector comparison
MACD ProThe MACD Pro is a modern take on the classic MACD, designed to give traders deeper insights into market momentum, trend conditions, and potential turning points. While it keeps the standard MACD foundation, it introduces a few enhancements to make it more adaptive and visually intuitive.
At its core, the indicator calculates the traditional MACD line, Signal line and Histogram. The histogram can be optionally displayed.
One of the things that set this version apart is the addition of the MACD Leader, an optional feature that makes the MACD more responsive to price action. By applying an adaptive smoothing factor (Leader Sensitivity), the Leader line can provide earlier momentum cues compared to the standard MACD and help anticipate shifts before they become obvious on a standard MACD indicator.
Another enhancement is the regime-based color system for the MACD line. Instead of simply coloring based on the MACD or histogram itself, this indicator identifies the overall market regime using momentum and trend strength conditions.
Bullish Regime: Momentum is positive and trend strength is above average.
Bearish Regime: Momentum is negative and trend strength is above average.
Sideways Regime: Momentum remains weak and within noise levels.
This regime detection allows the MACD line to visually adapt, giving traders an extra layer of context beyond standard MACD signals to blend momentum analysis with market conditions, helping distinguish between trending and ranging environments.

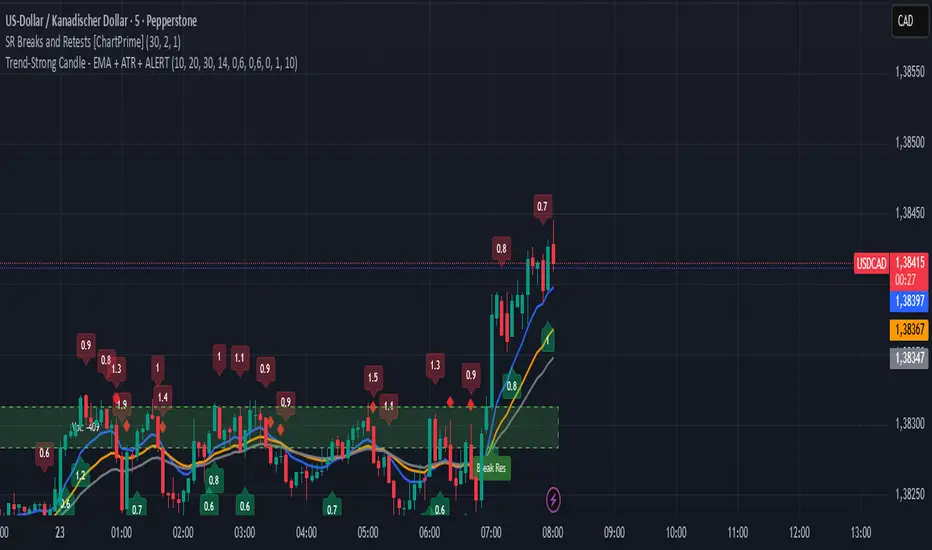
Trend-Strong Candle - Pro Multi Assetighlights:
Major Assets Mode (optional): EURUSD, GBPUSD, USDJPY, AUDUSD, USDCAD, NZDUSD, EURGBP, EURJPY
One‑per‑bar alerts, 24/7 toggle, no session limits
Default EMAs 20/40/60, improved stability and EMA-close filters
Lightweight performance, warning-free calculations, and clearer arrows/plots
HeatCandleHeatCandle - AOC Indicator
✨ Features
📊 Heat-Map Candles: Colors candles based on the price’s deviation from a Triangular Moving Average (TMA), creating a heat-map effect to visualize price zones.
📏 Zone-Based Coloring: Assigns colors to 20 distinct zones (Z0 to Z19) based on the percentage distance from the TMA, with customizable thresholds.
⚙️ Timeframe-Specific Zones: Tailored zone thresholds for 1-minute, 5-minute, 15-minute, 30-minute, 1-hour, and 4-hour timeframes for precise analysis.
🎨 Customizable Visuals: Gradient color scheme from deep blue (oversold) to red (overbought) for intuitive price movement interpretation.
🛠️ Adjustable Parameters: Configure TMA length and threshold multiplier to fine-tune sensitivity.
🛠️ How to Use
Add to Chart: Apply the "HeatCandle - AOC" indicator on TradingView.
Configure Inputs:
TMA Length: Set the period for the Triangular Moving Average (default: 150).
Threshold Multiplier: Adjust the multiplier to scale zone sensitivity (default: 1.0).
Analyze: Observe colored candles on the chart, where colors indicate the price’s deviation from the TMA:
Dark blue (Z0) indicates strong oversold conditions.
Red (Z19) signals strong overbought conditions.
Track Trends: Use the color zones to identify potential reversals, breakouts, or trend strength based on price distance from the TMA.
🎯 Why Use It?
Visual Clarity: The heat-map candle coloring simplifies identifying overbought/oversold conditions at a glance.
Timeframe Flexibility: Zone thresholds adapt to the selected timeframe, ensuring relevance across short and long-term trading.
Customizable Sensitivity: Adjust TMA length and multiplier to match your trading style or market conditions.
Versatile Analysis: Ideal for scalping, swing trading, or trend analysis when combined with other indicators.
📝 Notes
Ensure sufficient historical data for accurate TMA calculations, especially with longer lengths.
The indicator is most effective on volatile markets where price deviations are significant.
Pair with momentum indicators (e.g., RSI, MACD) or support/resistance levels for enhanced trading strategies.
Happy trading! 🚀📈

Dual-Frame Momentum OscillatorDual-Frame Momentum Oscillator (DFMO)
This is not just another oscillator. This is a confluence engine, built for the discerning trader who reads the story of price action and needs an objective tool to confirm the climax.
The Dual-Frame Momentum Oscillator was designed to solve a specific problem: how to differentiate a genuine, sustainable breakout from an exhaustive liquidity grab. It provides a visual confirmation for high-probability reversal and scalp setups by measuring momentum across two distinct time frames simultaneously.
This tool is for the trader who understands that indicators should not dictate trades, but rather confirm a well-defined thesis based on market structure, volume, and liquidity.
The Core Concept: Context Meets Trigger
The DFMO fuses a slow, methodical Stochastic with a hyper-sensitive RSI to give you a complete picture of momentum.
The Context (Slow Stochastic %K - default 40,4,4): This acts as your long-term momentum gauge. It tells you if the underlying trend is healthy or nearing exhaustion. A high reading suggests the market is overextended and vulnerable, while a low reading suggests the opposite.
The Trigger (Fast RSI - default 3): This is your immediate impulse reader. It measures the velocity and intensity of the current price thrust, making it incredibly sensitive to exhaustive moves, spikes, and bounces.
By themselves, they are useful. Together, they are formidable.
The Confluence Engine: Your Visual Edge
The true power of the DFMO lies in its "Confluence Engine." The indicator's background highlights in real-time when both oscillators are in agreement, visually flagging moments of maximum opportunity.
Bearish Confluence Zone (Red): The background turns red only when the Stochastic is overbought AND the RSI is overbought. This is your signal that the broader trend is exhausted and the current buying impulse has reached a climax. It is the ideal confirmation for a short entry following a liquidity sweep above a key high.
Bullish Confluence Zone (Green): The background turns green only when the Stochastic is oversold AND the RSI is oversold. This signals that the downtrend is tired and the immediate selling pressure is exhaustive, providing high-probability confirmation for a long entry at a key support level.
When these zones appear, the indicator is telling you that both the context and the trigger are aligned. This removes ambiguity and allows for decisive, confident execution.
Practical Application: The Liquidity Sweep
Imagine you're stalking a short on a futures contract like MCL or MES. You've marked the high of the day (HOD) as a key resistance level where liquidity is resting. You see a sharp, vertical impulse move that breaks the HOD, clearing out the stops.
Is this a real breakout, or is it a manipulation move—a classic liquidity grab?
You glance down at the DFMO. The moment price swept the high, the background flashed red. That's your objective confirmation. The slow Stoch was already overbought, and the fast RSI spiking confirmed the exhaustive, terminal nature of that price thrust. You now have the confidence to enter your short scalp, knowing you are aligned with the probable direction of the market's next move.
This is how you move from "feeling" the market to systematically executing a high-probability edge. This is how you aspire for greatness.
Add the Dual-Frame Momentum Oscillator to your toolkit and transform your ability to time entries with surgical precision.
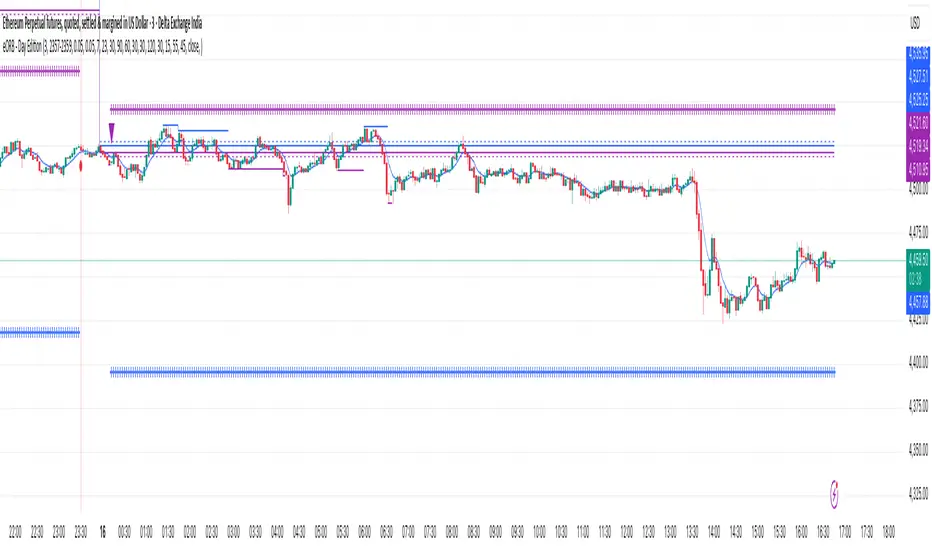
eORB - Day EditionThe eORB – Day Edition (Enhanced Opening Range Breakout) is a powerful intraday trading indicator designed for Algo Trading, Scalpers, Day Traders, and ORB-based strategies. It combines classic ORB logic with advanced filters, multiple exit strategies, and smart risk management tools. The default setup is optimised for a 3-minute ETHUSD chart.
Key Features:-
# Opening Range Breakout (ORB)
- Defines intraday high/low for the first X minutes.
- Automatically updates breakout levels.
- Optional buffer (%) for precision entries.
# Day & Session Filters
- Enable/disable trading on specific weekdays.
- Flexible session time configuration.
# EMA Crossover
- Option to trade based on EMA crossover with ORB levels.
# Breakout Candle Logic
- Detects breakout candle high/low for secondary confirmation.
# RSI Filter
- Confirms signals using RSI thresholds (customisable).
# Exit Strategies
- ORB High/Low Exit
- Buffer Exit
- Trailing Stop Loss (TSL) with activation, lock, and increments
- Target & Stoploss (fixed points)
- Universal Exit (UTC time-based) with background highlight
# Trade Sync Logic
- Prevents consecutive Buy → Buy or Sell → Sell without the opposite signal in between.
# Alerts Ready
- Buy, Sell, and Exit conditions are available for alerts.
- Compatible with TradingView alert system (popup, email, SMS, webhook).
How to Use:-
1. Add indicator to the chart.
2. Set ORB Time & Session (e.g., 3 min ORB at market open).
3. Enable/disable filters (EMA, RSI, Breakout candle).
4. Configure exits (TSL, Target, Stoploss, Universal Exit).
5. Add alerts for automation or notifications.
- This indicator is ideal for Crypto, Nifty, BankNifty, Index Futures, and Stocks, but it can be applied to any asset.
- The default settings are optimised for ETHUSD.
How it Works – eORB Day Edition:-
Step 1 – Define the Range
- At market open, the indicator records the Opening Range High & Low for the first X minutes (configurable by the user).
- This creates a price boundary (box) that acts as support and resistance for the rest of the session.
- Optional buffers can be added to make signals more reliable.
Step 2 – Generate the Signal
- When price (or EMA, if enabled) crosses above the Opening Range High, a Buy signal is generated.
- When price (or EMA) crosses below the Opening Range Low, a Sell signal is generated.
- Extra filters like RSI and Breakout Candle confirmation can be turned on to reduce false breakouts.
- Built-in sync logic ensures signals alternate properly (no double Buy or double Sell without the opposite in between).
Step 3 – Manage the Exit
- Trades can exit using multiple methods:
- Target (fixed profit in points)
- Stoploss (fixed risk in points)
- Trailing Stop-loss (TSL) that locks profit and trails as price moves further in your favour
- ORB/Buffer exit when price re-enters the range
- Universal Exit at a fixed UTC time to close all positions for the day
- Exits are visualised on the chart with shapes, labels, and optional background highlights.
In simple terms:-
Step 1: DEFINE
- Opening Range (first X minutes) → Marks High & Low → Creates breakout zone
Step 2: SIGNAL
- Price / EMA crosses High (+ Buffer) → BUY
- Price / EMA crosses Low (- Buffer) → SELL
- + Optional filters: RSI, Breakout Candle
Step 3: EXIT
- Target | Stoploss | Trailing Stoploss | Universal Exit
Important Note on Alert Setup
- When using the RSI filter, signals may fluctuate in some edge cases where RSI hovers near the Buy or Sell level.
- To avoid this, it is recommended to use “Once Per Bar Close” as the alert trigger, since signals confirm only after the bar closes (especially helpful when Breakout Candle High/Low Crossover is enabled).
- If you choose not to use RSI, you can safely use “Once Per Bar” alerts, even when the Breakout Candle High/Low Crossover option is enabled.
Disclaimer:-
- This tool is for educational and research purposes only.
- It does not guarantee profits. Always backtest and use proper risk management before live trading. The author is not responsible for financial losses.
Developer: @ikunalsingh
Built using AI + the best of human logic.
Fibo RSIThis is a customized Relative Strength Index (RSI) indicator designed to replicate TradingView’s default RSI while adding additional reference levels for deeper market analysis.
🔹 Features:
RSI length set to 8 by default (user adjustable).
Calculates RSI using the standard ta.rsi() function.
Plots the RSI line in a clean, separate panel.
Adds 7 key levels for analysis: 0, 20, 30, 50, 70, 80, 100.
Levels are drawn as thin, solid straight lines for a cleaner look (instead of default dashed).
🔹 Use cases:
Identify momentum shifts with enhanced precision.
Use intermediate levels (20, 30, 50, 70, 80) as potential support/resistance zones.
Ideal for traders who want a Fibonacci-like structure in RSI analysis.

High-and-Tight Impulse + Micro ConsolidationThis indicator detects a specific bullish continuation setup on daily charts:
- An impulse move (X% rise within N bars, mostly green candles)
- Immediately followed by a tight consolidation (small ranges, small bodies)
- Closes holding in the top zone of the impulse
On the chart, signals are plotted as orange dots above bars.
Labels show the last detected setup date, and a counter displays total matches in history.
Useful for backtesting "high-and-tight flag" type momentum patterns or any symbol.
Adjust inputs (impulse % threshold, bars, ATR ratios, top zone %) to make it stricter or looser.
Alerts are included when a new setup is detected.
This tool is not financial advice. For educational and research purposes only.
by fiyatherseydir

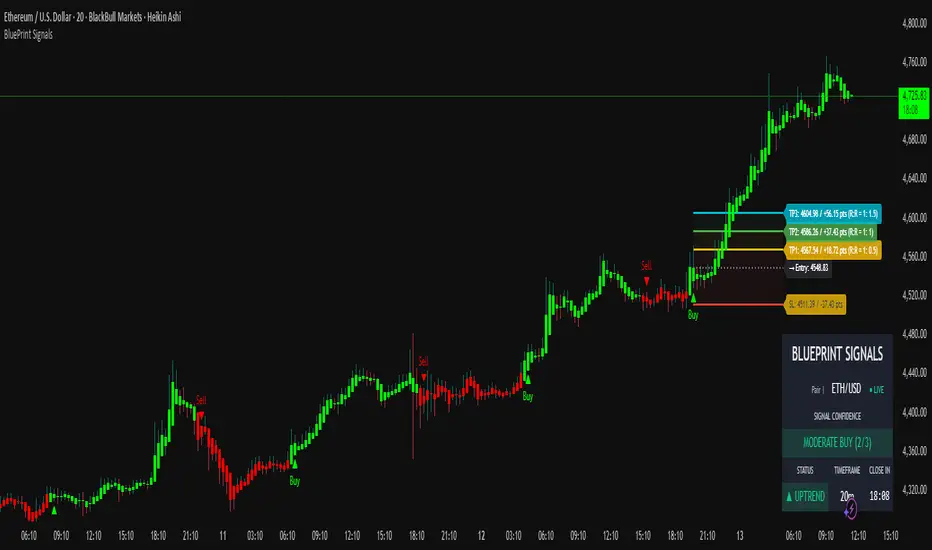
Blueprint Signals ProBlueprint Signals Pro is an advanced, all-in-one trading indicator designed for TradingView, built to provide high-quality buy/sell signals across various markets including cryptocurrencies, U.S. stocks, Indian indices, forex, and more. 📈 It leverages a proprietary ATR-based trailing stop mechanism combined with AI-optimized profiles for different trading styles (scalping, intraday, swing, and position trading) to generate reliable signals on bar close.
Key Features:
📊 Market Optimization: Tailored options for specific markets like Cryptocurrency (high volatility, 24/7 trading), U.S. Stocks (regulated exchanges, standard hours), Indian Indices (local dynamics like NIFTY), and Forex (high liquidity, global influences) to customize parameters and enhance signal accuracy.
🎨 Theme & Palette Customization: Supports dark/light chart themes with multiple color palettes for visual appeal.
🤖 Trading Profiles: Pre-built AI profiles like "Edge Signal", "Flash Signal", "Trend Rider", etc., tailored to your timeframe and style.
🔍 Signal Filters: Bullish/Bearish modes to focus on one-sided signals, with adjustable candle opacity.
🛡️ Support/Resistance Zones: Dynamic S/R levels with auto-adjusting lookback and wick warning markers for potential reversals.
⚠️ Swing Pattern Failure (SPF): Detects failure patterns with volume and wick filters for early reversal alerts.
🚨 Warnings: Proximity and wick-touch alerts on the trailing stop to signal momentum loss or trend challenges.
💡 Premium/Discount Zones: Neon-style P&D zones with glow effects to identify overvalued/undervalued areas.
📉 Custom Moving Averages: Up to 3 configurable MAs (EMA/SMA/WMA/HMA) with theme-based colors.
⚙️ Core Parameters: Manual/auto-tuning for scaling factor, period, min move filter, and anti-chop sensitivity.
⭐ Confidence Rating: Scores signals (Weak/Moderate/Strong) based on trend, S/R proximity, and volume.
🎯 SL/TP Levels: Displays stop loss (ATR trail, swing, or fixed ATR) and multiple take profits with R:R ratios, extendable lines, and zone fills. Additionally, clearly shows captured points/pips (e.g., +50 pts) and potential profit in points/pips/₹ for each level, making risk-reward analysis straightforward and visible on the chart.
🖥️ Display Options: Toggle trailing stop, text on signals, and more.
📅 Dashboard: Multi-timeframe overview with trend intelligence (using ADX), confidence, and candle timer.
🔔 Alerts: Configurable for buy/sell signals with detailed messages.
Usage Guidelines:
Select your market, theme, and trading style from the inputs.
Use on any timeframe; auto-adjusts for optimal performance.
Signals are confirmed on bar close to avoid repainting.
Combine with your risk management; backtest thoroughly.
This indicator is for educational and informational purposes only. Past performance is not indicative of future results. Trade at your own risk. © 2025 Raza | Blueprint Signals. All Rights Reserved.
Trend-Strong Candle - 3 EMAs with Filters# Trend-Strong Candle - Professional Trading Indicator
## 📊 What It Does
Identifies high-probability entries by combining triple EMA trend analysis with strong candle detection. Only signals when all conditions align for maximum accuracy.
## 🎯 Core Features
- Triple EMA System: Fast (20) / Medium (50) / Slow (200) for trend confirmation
- Strong Candle Filter: ATR-based sizing ensures genuine momentum
- Advanced Filters: EMA close validation + trend stability checks
- Live Alerts: Instant notifications for real-time signals
- Session Filter: Trade only during active EU/US market hours
## ⚡ Quick Setup
Scalping (1-5min): Default settings + enable session filter
Day Trading (15-60min): Default settings work perfectly
Swing Trading (4H+): Increase ATR multiplier to 0.8-1.0
## 📈 Trading Rules
Long Signals: Green triangle below candle
- Strong bullish candle during confirmed uptrend
- All EMAs properly aligned (Fast > Medium > Slow)
Short Signals: Red triangle above candle
- Strong bearish candle during confirmed downtrend
- All EMAs properly aligned (Fast < Medium < Slow)
## ⚠️ Critical Success Factors
1. Always Verify the Trend Yourself
The indicator helps identify signals, but YOU must confirm the larger trend context. Check higher timeframes and overall market structure before entering.
2. Understand the "Big Players"
Strong candles in trend direction usually come from institutional money (banks, funds, algorithms). These create the momentum that retail traders can follow. The indicator catches these institutional moves.
3. Distance to Next Value Level
NEVER enter if price is too close to major resistance/support levels:
- Check distance to round numbers (1.1000, 1.1050, etc.)
- Ensure at least 20-30 pips room to next key level
- You need space for profit - tight levels = limited upside
4. Risk Management
- Stop Loss: 1-2 ATR from entry
- Take Profit: 2-3 ATR target (minimum 1:2 R/R)
- Position Size: Risk max 1-2% per trade
## 💡 Pro Tips
- Best Sessions: London open (8-12 UTC) and NY open (13-17 UTC)
- Avoid: Major news, low liquidity periods, choppy markets
- Multiple Timeframes: Confirm signals on higher timeframe
- Value Levels: Always check daily/weekly support/resistance before entering
## 🎯 Success Formula
Trend Confirmation + Strong Institutional Candle + Distance to Value Levels = High Probability Trade
*
Remember: The indicator finds the signals, but successful trading requires your analysis of trend context and value level positioning. Trade smart, not just frequent.

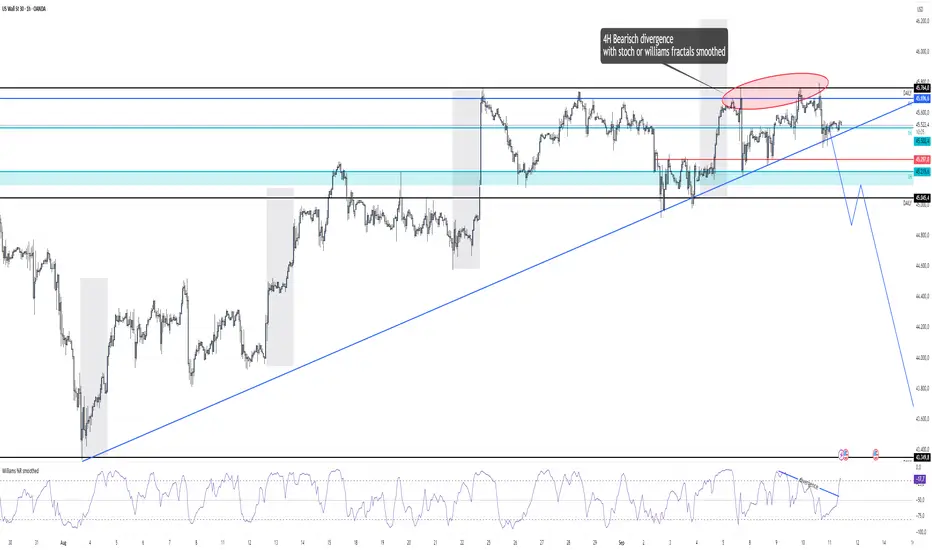
Williams %R smoothed🌍 English Description
Williams %R Smoothed – by Ján Salma
This is the first smoothed version of the Williams %R indicator published on TradingView.
The traditional Williams %R is a momentum oscillator that can be very choppy and noisy. Many traders find it hard to use because of the constant whipsaws.
This indicator solves that problem by applying an EMA smoothing on top of the raw Williams %R values.
Why is this special?
[* ]📉 Reduces noise → much cleaner signal, fewer false spikes.
🔍 Highlights real momentum shifts → easier to spot when the market truly changes direction.
🎯 Customizable smoothing → you decide how sensitive or smooth the curve should be.
⚡ Unique → currently, there is no other smoothed Williams %R available on TradingView.
Settings
Length → default 14 (standard Williams %R period).
Smoothing → default 3 EMA (smooths out the raw values).
Levels: -20 (overbought), -80 (oversold), -50 (mid-level).
This indicator is great for scalpers and swing traders who love Williams %R but hate the noise.
Now you can finally use %R with more confidence and clarity.
--------------------------------------------------------------------
Slovenský popis
Williams %R Smoothed – od Jána Salmu
Toto je prvá vyhladená verzia Williams %R indikátora publikovaná na TradingView.
Klasický Williams %R je oscilátor hybnosti, ktorý je často veľmi „roztrasený“ a plný šumu. Mnoho traderov s ním preto pracuje ťažko, pretože dáva veľa falošných signálov.
Tento indikátor to rieši tak, že na pôvodné hodnoty Williams %R aplikuje EMA vyhladenie .
Čo robí tento indikátor výnimočným?
📉 Redukuje šum → výsledná krivka je čistejšia, s menej falošnými výkyvmi.
🔍 Zvýrazňuje skutočné zmeny hybnosti → jasnejšie vidíš, kedy sa trh naozaj otáča.
🎯 Nastaviteľné vyhladenie → citlivosť indikátora si prispôsobíš podľa seba.
⚡ Unikát → na TradingView zatiaľ neexistuje žiadny iný vyhladený Williams %R.
Nastavenia
Dĺžka → predvolená hodnota 14 (štandardný Williams %R).
Smoothing (EMA) → predvolená hodnota 3 (vyhladenie krivky).
Úrovne: -20 (prekúpený trh), -80 (prepredaný trh), -50 (stredová hodnota).
Tento indikátor je skvelý pre scalperov aj swing traderov, ktorí majú radi Williams %R, ale chcú ho používať s väčšou presnosťou a prehľadnosťou.
3CRGANG - CANDLE CLOSE TIMER3CRGANG - CANDLE CLOSE TIMER
This indicator displays a timer for the current candle’s close and a multi-timeframe (MTF) timer table, showing the time remaining for various timeframes. It supports customizable timezones, visualization settings, and alerts for new candle openings and pre-close notifications, with filters for trading sessions and holidays.
Features:
Candle Timer: Displays the time remaining until the current candle closes, with color-coded visuals based on candle direction (green for up, red for down, gold when nearing close).
MTF Timer Table: Shows time remaining for multiple timeframes (M5, M15, M30, H1, H4, D, W, M, Q, Y) with a gradient-colored progress bar (green to red as time decreases).
Timezone Support: Choose from a wide range of timezones to align timer and alerts with your local time.
Visualization Options: Select device template (Desktop, Tablet, Mobile) and color theme (Light or Dark) for optimal display.
Alerts: Configurable alerts for new candle openings and pre-close thresholds across multiple timeframes, with session and holiday filters.
Session and Holiday Filters: Supports major exchanges (NYSE, LSE, FSE, SSX, TSE, HKSE) with holiday schedules and half-day considerations.
Do Not Disturb (DND): Set DND periods to suppress alerts during specific hours.
Time Settings:
Timezone: Select from a list of global timezones (e.g., UTC+3 Jerusalem, UTC-4 New York).
Time Format: Choose between Standard (12-hour with AM/PM) or Military (24-hour) time.
Visualization Setup:
Device: Select Desktop, Tablet, or Mobile template to adjust table sizes.
Color Theme: Choose Light or Dark theme for visual elements.
Timer Dashboard:
Timer Table Position: Set the position of the main timer table (e.g., top-right, bottom-center).
MTF Timer Dashboard:
Hide MTF Timer Table: Toggle visibility (off by default on Mobile template).
MTF Timer Table Position: Set position for the MTF timer table.
Offset Table Position: Adjust the Y-axis offset for the MTF table.
Notifications Settings:
Enable Alerts: Toggle alerts for Yearly, Quarterly, Monthly, Weekly, Daily, H4, H1, M30, and M15 timeframes.
Pre-Alert Threshold: Set the percentage of candle duration remaining for pre-close alerts (0–100%).
DND Settings:
Weekend Alerts: Enable/disable alerts during weekends.
DND Mode: Set start and end times for suppressing alerts.
Session Alerts Filter:
Holiday Alerts: Enable/disable alerts on exchange holidays.
Exchange Alerts: Toggle alerts for NYSE, LSE, FSE, SSX, TSE, and HKSE sessions.
Notes:
The indicator supports various asset types (stocks, forex, futures, crypto, commodities, indices) with tailored session detection.
The MTF timer table is hidden on Mobile template by default to optimize screen space.
Alerts respect user-defined session filters, holiday schedules, and DND settings for major exchanges.
Ensure sufficient chart history for accurate timeframe calculations.
Use the settings to customize timer display, alert behavior, and session filters to match your trading strategy.

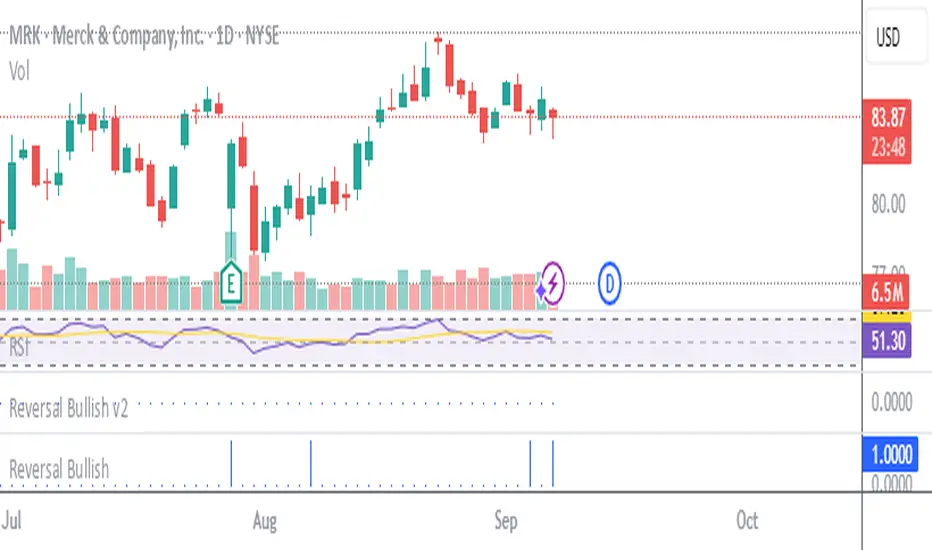
Stockbee Reversal BullishCustom indicator for identifying stocks that meet the Stockbee's Reversal Bullish criteria. This can be used as a standalone indicator or use it to screen for stocks in Pine Screener.
[ClearEdege] Momentum Suites V3 Advanced contrarian momentum analysis with intelligent pivot point integration for precision market timing. Developed for ClearEdge members
*This indicator is not publicly available.
Key Features
Smart Signal System
- Buy Low/Sell High Logic: Identifies oversold conditions for long entries and overbought conditions for short entries
- Multi-Timeframe Confirmation: Incorporates higher timeframe bias for enhanced signal reliability
- Momentum Convergence: Combines RSI, StochRSI, and Bollinger Bands for comprehensive market analysis
Dynamic Pivot Integration
- Classic Pivot Points: Auto-calculated daily/weekly/monthly support and resistance levels
- Pivot Confluence Detection: Signals gain strength when price approaches key pivot levels
- Smart Warning System: Single-alert approach prevents label spam while highlighting critical S/R interactions
Table Dashboard
- Compact Signal Table: Real-time buy/sell signal strength with scoring system
- Market Context: Momentum status, nearest pivot level, volume and trend analysis
- Clean Visual Design: Minimal interface focused on actionable information
Intelligent Alerts
- Approach Warnings: Alerts when price nears resistance with overbought momentum or support with oversold momentum
- Confluence Signals: High-probability setups combining momentum extremes with pivot level proximity
- Single-Shot Logic: Prevents alert fatigue with smart reset mechanisms
Best Use Cases
- Swing Trading: Ideal for identifying major reversal points at key levels
- Risk Management: Clear warning system for potential turning points
- Multi-Asset Analysis: Works across forex, crypto, stocks, and commodities
- All Timeframes: Scalable from 5-minute charts to daily analysis
Designed for traders who value precision over noise - combining classical pivot analysis with modern momentum indicators for superior market timing.

Momentum+This script provides a colored histogram of recent price action with the price derivative method for finding momentum.
buy sell ultra systemWhat it is
EMA-POC Momentum System Ultra combines a proven trend stack (EMA 20/50/238), a price-of-control layer (POC via Bar-POC or VWAP alternative), and a momentum trigger (RSI) to surface higher-quality entries only when multiple, independent conditions align. This is not a cosmetic mashup; each component gates the others.
How components work together
Trend (EMA 20/50/238): Defines short/medium/long bias and filters counter-trend signals.
POC (Bar-POC or Alt-POC/VWAP): Locates the most-traded/weighted price area; a neutral band around POC helps avoid chop.
Control background: Above POC → buyers likely in control; below → sellers.
Momentum (RSI): Entry arrows print only when RSI confirms with trend and price location vs POC; optional “cross 50” requirement reduces noise.
Optional HTF trend: Confluence with a higher-timeframe EMA stack for stricter filtering.
Why it’s original/useful
Signals require confluence of (1) EMA trend stack, (2) POC location and neutral-zone filtering, (3) momentum confirmation, (4) optional slope and distance-to-POC checks, and (5) optional HTF trend. This reduces false positives compared with using any layer in isolation.
How to use
Markets/TFs: Built for XAUUSD (Gold) and US30. Works 1m–1h for intraday; 2h–4h for swing.
Entries:
Long: EMA stack bullish, price above POC, not in neutral band, RSI condition true → “Buy” arrow.
Short: Opposite conditions → “Sell” arrow.
Stops/Targets (suggested):
Initial stop beyond POC/neutral band or recent swing.
First target around 1R; trail with EMA20/50 or structure breaks.
Settings to tune:
POC Mode: Bar-POC (highest-volume bar’s close over lookback) or Alt-POC (VWAP).
Neutral Band %: 0.10–0.35 typical intraday.
Min distance from POC: 0.10–0.50% helps avoid low-RR entries right at POC.
RSI: Choose “cross 50” for stricter triggers or simple >/< 50 for more signals.
HTF trend: Turn on for extra confluence.
Alerts:
Buy Signal and Sell Signal (separate), or one Combined Buy/Sell alert.
Set to “Once per bar close” if you want only confirmed arrows.
Repainting / limitations
Shapes can move until bar close (standard Pine behavior) when using intrabar conditions; final confirmation at close. No system guarantees profitability—forward test and adapt to your market/instrument.
Clean chart
The published chart contains only this script so outputs are easy to identify.
Versions / updates
Use Publish → Update for minor changes; do not create new publications for small tweaks. If you fork to preserve older behavior, explain why and how your fork differs.
Changelog
v1.1 – Tuning for Gold/US30, neutral-band & distance filters, optional HTF trend, combined alert.
v1.0 – Initial public release (EMA stack + POC modes + RSI + alerts).
License & credits
Open-source for learning and improvement. Please credit on forks and explain modifications in your description.

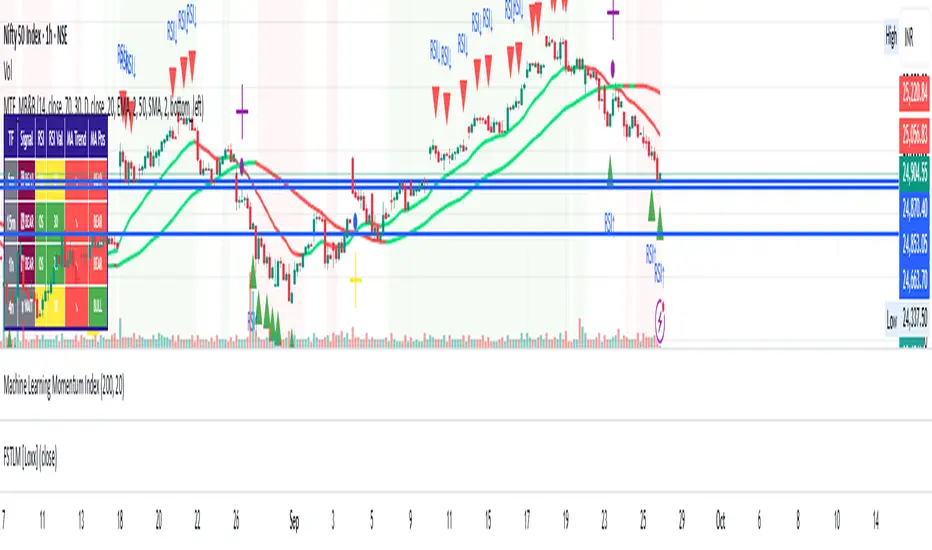
Momentum Index [BigBeluga]The Momentum Index is an innovative indicator designed to measure the momentum of price action by analyzing the distribution of positive and negative momentum values over a defined period. By incorporating delta-based calculations and smoothing techniques, it provides traders with a clear and actionable representation of market momentum dynamics.
🔵 Key Features:
Delta-Based Momentum Analysis:
Calculates the momentum of price by comparing its current state to its value from a defined number of bars back.
Inside a loop, it evaluates whether momentum values are above or below zero, producing a delta value that reflects the net momentum direction and intensity.
Double EMA Smoothing:
Smooths the raw delta-based momentum values with a double EMA filter, reducing noise and providing a clearer trend signal.
tmi(len) =>
sum = 0.0
sum1 = 0.0
above = 0.0
below = 0.0
src_ = src - src
for i = 0 to len
sum := sum + (src_ > nz(src_ ) ? 1 : -1)
sum1 := sum1 + (sum > 0 ? 1 : -1)
sum1 := emaEma(sum1, 10)
for i = 1 to len
above := above + (sum1 > 0 ? 1 : 0)
below := below + (sum1 > 0 ? 0 : 1)
Directional Momentum Signals:
Generates momentum shift signals and displays them on both the oscillator and the main chart:
- △ Aqua Triangles: Represent upward momentum shifts.
- ▽ Red Triangles: Represent downward momentum shifts.
Dynamic Gradient Display:
Highlights momentum zones with gradient fills:
- Aqua shades for positive momentum (above zero).
- Red shades for negative momentum (below zero).
Dashboard Display:
A dashboard summarizing the count of momentum values above and below zero for the defined period (Sentiment Length e.g. 100), helping traders assess market sentiment at a glance.
🔵 How It Works:
The indicator takes price momentum as its source and evaluates the number of momentum values above and below zero within a defined period.
The delta calculation aggregates this information, providing a net representation of the prevailing market momentum.
A double EMA filter is applied to the delta values, smoothing the momentum line and enhancing signal clarity.
Momentum shifts are highlighted with visual signals on the oscillator and price chart, while the gradient display provides a visual representation of intensity.
🔵 Use Cases:
Momentum Tracking: Identify whether market momentum is predominantly bullish or bearish.
Signal Confirmation: Use chart-based signals to confirm potential trend reversals or continuation.
Analyze Market Strength: Leverage the dashboard to quickly assess the distribution of momentum over the chosen period.
Overbought/Oversold Conditions: Utilize gradient zones to detect areas of momentum extremes and possible price exhaustion.
Momentum Index offers a refined approach to analyzing momentum dynamics, combining delta-based calculations with smoothing techniques and intuitive visuals, making it an essential tool for traders looking to anticipate market movements effectively.
