Interpolated Median Volatility LSMA | OttoThis indicator combines trend-following and volatility analysis by enhancing traditional LSMA with percentile-based linear interpolation applied to both the Least Squares Moving Average (LSMA) and standard deviation. Rather than relying on raw values, it uses the interpolated median (50th percentile) to smooth out noise while preserving sensitivity to significant price shifts. This approach produces a cleaner trend signal that remains responsive to real market changes, adapts to evolving volatility conditions, and improves the accuracy of breakout detection.
Core Concept
The indicator builds on these core components:
LSMA (Least Squares Moving Average): A linear regression-based moving average that fits line using user selected source over user defined period. It offers a smoother and more reactive trend signal compared to standard moving averages.
Standard Deviation shows how much price varies from the mean. In this indicator, it’s used to measure market volatility.
Volatility Bands: Instead of traditional Bollinger-style bands, this script calculates custom upper and lower bands using percentile-based linear interpolation on both the LSMA and standard deviation. This method produces smoother bands that filter out noise while remaining adaptive to meaningful price movements, making them more aligned with real market behavior and helping reduce false signals.
Percentile interpolation estimates a specific percentile (like the median — the 50th percentile) from a set of values — even when that percentile doesn't fall exactly on one data point. Instead of selecting a single nearest value, it calculates a smoothed value between nearby points. In this script, it’s used to find the median of past LSMA and standard deviation values, reducing the impact of outliers and smoothing the trend and volatility signals for more robust results.
Signal Logic: A long signal is identified when close price goes above the upper band, and a short signal when close price goes below the lower band.
⚙️ Inputs
Source: The price source used in calculations
LSMA Length: Period for calculating LSMA
Standard Deviation Length: Period for calculating volatility
Percentile Length: Period used for interpolating percentile values of LSMA and standard deviation
Multiplier: Controls the width of the bands by scaling the interpolated standard deviation
📈 Visual Output
Colored LSMA Line: Changes color based on signal (green for bullish, purple for bearish)
Upper & Lower Bands: Volatility bands calculated using interpolated values (green for bullish, purple for bearish)
Bar Coloring: Price bars are colored to reflect signal state (green for bullish, purple for bearish)
Optional Candlestick Overlay: Enhances visual context by coloring candles to match the signal state (green for bullish, purple for bearish)
How to Use
Add the indicator to your chart and look for signals when close price goes above or below the bands.
Long Signal: close Price goes above the upper band
Short Signal: close Price goes below the lower band
🔔 Alerts:
This script supports alert conditions for long and short signals. You can set alerts based on band crossovers to be notified of potential entries/exits.
⚠️ Disclaimer:
This indicator is intended for educational and informational purposes only. Trading/investing involves risk, and past performance does not guarantee future results. Always test and evaluate strategies before applying them in live markets. Use at your own risk.
Median

Median True Range {Darkoexe}Simple and sweet, this is the median true range. It reviews the size of the previous period amount of candles, and displays the candle size value that is the median of those previous values.
//Darkoexe

Savitzky Golay Median Filtered RSI [BackQuant]Savitzky Golay Median Filtered RSI
Introducing BackQuant's Savitzky Golay Median Filtered RSI, a cutting-edge indicator that enhances the classic Relative Strength Index (RSI) by applying both a Savitzky-Golay filter and a median filter to provide smoother and more reliable signals. This advanced approach helps reduce noise and captures true momentum trends with greater precision. Let’s break down how the indicator works, the features it offers, and how it can improve your trading strategy.
Core Concept: Relative Strength Index (RSI)
The Relative Strength Index (RSI) is a widely used momentum oscillator that measures the speed and change of price movements. It oscillates between 0 and 100, with levels above 70 typically indicating overbought conditions and levels below 30 indicating oversold conditions. However, the standard RSI can sometimes generate noisy signals, especially in volatile markets, making it challenging to identify reliable entry and exit points.
To improve upon the traditional RSI, this indicator introduces two powerful filters: the Savitzky-Golay filter and a median filter.
Savitzky-Golay Filter: Smoothing with Precision
The Savitzky-Golay filter is a digital filtering technique used to smooth data while preserving important features, such as peaks and trends. Unlike simple moving averages that can distort important price data, the Savitzky-Golay filter uses polynomial regression to fit the data, providing a more accurate and less lagging result.
In this script, the Savitzky-Golay filter is applied to the RSI values to smooth out short-term fluctuations and provide a more reliable signal. By using a window size of 5 and a polynomial degree of 2, the filter effectively reduces noise without compromising the integrity of the underlying price movements.
Median Filter: Reducing Outliers
After applying the Savitzky-Golay filter, the median filter is applied to the smoothed RSI values. The median filter is particularly effective at removing short-lived outliers, further enhancing the accuracy of the RSI by reducing the impact of sudden and temporary price spikes or drops. This combination of filters creates an ultra-smooth RSI that is better suited for detecting true market trends.
Long and Short Signals
The Savitzky Golay Median Filtered RSI generates long and short signals based on user-defined threshold levels:
Long Signals: A long signal is triggered when the filtered RSI exceeds the Long Threshold (default set at 176). This indicates that momentum is shifting upward, and it may present a good buying opportunity.
Short Signals: A short signal is generated when the filtered RSI falls below the Short Threshold (default set at 162). This suggests that momentum is weakening, potentially signaling a selling opportunity or exit from a long position.
These threshold levels can be adjusted to suit different market conditions and timeframes, allowing traders to fine-tune the sensitivity of the indicator.
Customization and Visualization Options
The Savitzky Golay Median Filtered RSI comes with several customization options, enabling traders to tailor the indicator to their specific needs:
Calculation Source: Select the price source for the RSI calculation (default is OHLC4, but it can be changed to close, open, high, or low prices).
RSI Period: Adjust the lookback period for the RSI calculation (default is 14).
Median Filter Length: Control the length of the median filter applied to the smoothed RSI, affecting how much noise is removed from the signal.
Threshold Levels: Customize the long and short thresholds to define the sensitivity for generating buy and sell signals.
UI Settings: Choose whether to display the RSI and thresholds on the chart, color the bars according to trend direction, and adjust the line width and colors used for long and short signals.
Visual Feedback: Color-Coded Signals and Thresholds
To make the signals easier to interpret, the indicator offers visual feedback by coloring the price bars and the RSI plot according to the current market trend:
Green Bars indicate long signals when momentum is bullish.
Red Bars indicate short signals when momentum is bearish.
Gray Bars indicate neutral or undecided conditions when no clear signal is present.
In addition, the Long and Short Thresholds can be plotted directly on the chart to provide a clear reference for when signals are triggered, allowing traders to visually gauge the strength of the RSI relative to its thresholds.
Alerts for Automation
For traders who prefer automated notifications, the Savitzky Golay Median Filtered RSI includes built-in alert conditions for long and short signals. You can configure these alerts to notify you when a buy or sell condition is met, ensuring you never miss a trading opportunity.
Trading Applications
This indicator is versatile and can be used in a variety of trading strategies:
Trend Following: The combination of Savitzky-Golay and median filtering makes this RSI particularly useful for identifying strong trends without being misled by short-term noise. Traders can use the long and short signals to enter trades in the direction of the prevailing trend.
Reversal Trading: By adjusting the threshold levels, traders can use this indicator to spot potential reversals. When the RSI moves from overbought to oversold levels (or vice versa), it may signal a shift in market direction.
Swing Trading: The smoothed RSI provides a clear signal for short to medium-term price movements, making it an excellent tool for swing traders looking to capitalize on momentum shifts.
Risk Management: The filtered RSI can be used as part of a broader risk management strategy, helping traders avoid false signals and stay in trades only when the momentum is strong.
Final Thoughts
The Savitzky Golay Median Filtered RSI takes the classic RSI to the next level by applying advanced smoothing techniques that reduce noise and improve signal reliability. Whether you’re a trend follower, swing trader, or reversal trader, this indicator provides a more refined approach to momentum analysis, helping you make better-informed trading decisions.
As with all indicators, it is important to backtest thoroughly and incorporate sound risk management strategies when using the Savitzky Golay Median Filtered RSI in your trading system.
Thus following all of the key points here are some sample backtests on the 1D Chart
Disclaimer: Backtests are based off past results, and are not indicative of the future.
INDEX:BTCUSD
INDEX:ETHUSD
BINANCE:SOLUSD

series_collectionLibrary "series_collection"
A personal collection of commonly used series types like moving averages that are supported directly by
the pinescript library ('ALMA', 'DEMA', 'EMA', 'HMA', 'RMA', 'SMA', 'SWMA', 'VWMA', 'WMA'), highest and lowest source,
median and pivots. One single function (with overloads) that can be configured easily by the user input and can be
used as a core piece of functionality for many user cases. This library was created to abstract away and re-use this
commonly used functionality in my "Two MA Signal Indicator" script and the "Template Trailing Strategy" script. Both
of them use the "two_ma_logic" for defining entry and exit signals. While this piece of work does not contain any
novel mathematical expressions and just adds a convinient (and configurable) way to do things, I hope that might add
value to other scripts as well and future projects.
cust_series(length, seriesType, source)
cust_series - Calculate the custom series of the given source for the given length and type
Parameters:
length (simple int) : - The length of the custom series
seriesType (simple string) : - The type of the custom series
source (float) : - The source of the values
Returns: - The resulting value of the calculations of the custom series
cust_series(length, seriesType, source)
cust_series - Calculate the custom series of the given source for the given length and type
Parameters:
length (simple float) : - The length of the custom series (ceiled)
seriesType (simple string) : - The type of the custom series
source (float) : - The source of the values
Returns: - The resulting value of the calculations of the custom series

Standardized Median Proximity [AlgoAlpha]Introducing the Standardized Median Proximity by AlgoAlpha 🚀📊 – a dynamic tool designed to enhance your trading strategy by analyzing price fluctuations relative to the median value. This indicator is built to provide clear visual cues on the price deviation from its median, allowing for a nuanced understanding of market trends and potential reversals.
🔍 Key Features:
1. 📈 Median Tracking: At the core of this indicator is the calculation of the median price over a specified lookback period. By evaluating the current price against this median, the indicator provides a sense of whether the price is trending above or below its recent median value.
medianValue = ta.median(priceSource, lookbackLength)
2. 🌡️ Normalization of Price Deviation: The deviation of the price from the median is normalized using standard deviation, ensuring that the indicator's readings are consistent and comparable across different time frames and instruments.
standardDeviation = ta.stdev(priceDeviation, 45)
normalizedValue = priceDeviation / (standardDeviation + standardDeviation)
3. 📌 Boundary Calculations: The indicator sets upper and lower boundaries based on the normalized values, helping to identify overbought and oversold conditions.
upperBoundary = ta.ema(positiveValues, lookbackLength) + ta.stdev(positiveValues, lookbackLength) * stdDevMultiplier
lowerBoundary = ta.ema(negativeValues, lookbackLength) - ta.stdev(negativeValues, lookbackLength) * stdDevMultiplier
4. 🎨 Visual Appeal and Clarity: With carefully chosen colors, the plots provide an intuitive and clear representation of market states. Rising trends are indicated in a shade of green, while falling trends are shown in red.
5. 🚨 Alert Conditions: Stay ahead of market movements with customizable alerts for trend shifts and impulse signals, enabling timely decisions.
alertcondition(ta.crossover(normalizedValue, 0), "Bullish Trend Shift", "Median Proximity Crossover Zero Line")
🔧 How to Use:
- 🎯 Set your preferred lookback lengths and standard deviation multipliers to tailor the indicator to your trading style.
- 💹 Utilize the boundary plots to understand potential overbought or oversold conditions.
- 📈 Analyze the color-coded column plots for quick insights into the market's direction relative to the median.
- ⏰ Set alerts to notify you of significant trend changes or conditions that match your trading criteria.
Basic Logic Explained:
- The indicator first calculates the median of the selected price source over your chosen lookback period. This median serves as a baseline for measuring price deviation.
- It then standardizes this deviation by dividing it by the standard deviation of the price deviation over a 45-period lookback, creating a normalized value.
- Upper and lower boundaries are computed using the exponential moving average (EMA) and standard deviation of these normalized values, adjusted by your selected multiplier.
- Finally, color-coded plots provide a visual representation of these calculations, offering at-a-glance insights into market conditions.
Remember, while this tool offers valuable insights, it's crucial to use it as part of a comprehensive trading strategy, complemented by other analysis and indicators. Happy trading!
🚀

Median Proximity Percentile [AlgoAlpha]📊🚀 Introducing the "Median Proximity Percentile" by AlgoAlpha, a dynamic and sophisticated trading indicator designed to enhance your market analysis! This tool efficiently tracks median price proximity over a specified lookback period and finds it's percentile between 2 dynamic standard deviation bands, offering valuable insights for traders looking to make informed decisions.
🌟 Key Features:
Color-Coded Visuals: Easily interpret market trends with color-coded plots indicating bullish or bearish signals.
Flexibility: Customize the indicator with your preferred price source and lookback lengths to suit your trading strategy.
Advanced Alert System: Stay ahead with customizable alerts for key trend shifts and market conditions.
🔍 Deep Dive into the Code:
Choose your preferred price data source and define lookback lengths for median and EMA calculations. priceSource = input.source(close, "Source") and lookbackLength = input.int(21, minval = 1, title = "Lookback Length")
Calculate median value, price deviation, and normalized value to analyze market position relative to the median. medianValue = ta.median(priceSource, lookbackLength)
Determine upper and lower boundaries based on standard deviation and EMA. upperBoundary = ta.ema(positiveValues, lookbackLength) + ta.stdev(positiveValues, lookbackLength) * stdDevMultiplier
lowerBoundary = ta.ema(negativeValues, lookbackLength) - ta.stdev(negativeValues, lookbackLength) * stdDevMultiplier
Compute the percentile value to track market position within these boundaries. percentileValue = 100 * (normalizedValue - lowerBoundary)/(upperBoundary - lowerBoundary) - 50
Enhance your analysis with Hull Moving Average (HMA) for smoother trend identification. emaValue = ta.hma(percentileValue, emaLookbackLength)
Visualize trends with color-coded plots and characters for easy interpretation. plotColor = percentileValue > 0 ? colorUp : percentileValue < 0 ? colorDown : na
Set up advanced alerts to stay informed about significant market movements. // Alerts
alertcondition(ta.crossover(emaValue, 0), "Bullish Trend Shift", "Median Proximity Percentile Crossover Zero Line")
alertcondition(ta.crossunder(emaValue, 0), "Bearish Trend Shift", "Median Proximity Percentile Crossunder Zero Line")
alertcondition(ta.crossunder(emaValue,emaValue ) and emaValue > 90, "Bearish Reversal", "Median Proximity Percentile Bearish Reversal")
alertcondition(ta.crossunder(emaValue ,emaValue) and emaValue < -90, "Bullish Reversal", "Median Proximity Percentile Bullish Reversal")
🚨 Remember, the "Median Proximity Percentile " is a tool to aid your analysis. It’s essential to combine it with other analysis techniques and market understanding for best results. Happy trading! 📈📉

FlexiMA Variance Tracker [presentTrading]🔶 Introduction and How it is Different
The FlexiMA Variance Tracker (FlexiMA-VT) represents a novel approach in technical analysis, distinctively standing out in the realm of financial market indicators. It leverages the concept of a variable Length Moving Average (MA) to create a versatile and dynamic oscillator. Unlike traditional oscillators that rely on a fixed-length MA, the FlexiMA-VT adapts to market conditions by varying the length of the MA, offering a more responsive and nuanced view of market trends. (*The achieved method took reference from SuperTrend Polyfactor Oscillator)
This innovative design allows the FlexiMA-VT to capture a broader spectrum of market movements, making it highly effective in diverse trading environments. Whether in stable or volatile markets, its adaptability ensures consistent relevance, providing traders with deeper insights into potential market swings.
The proposed oscillator accentuates several key aspects through a distinctive mesh of bars, which are derived from the differences between the price and a set of 20 Moving Averages, each altered by varying factors. The intensity of the mesh's colors serves as an indicator, with brighter hues signifying a greater convergence of Moving Average signals.
Starting Length = 5
Starting Length = 40
🔶 Strategy, How it Works: Detailed Explanation
1. Core Concept:
The FlexiMA-VT operates by comparing the price or an average value (indicator source) against a set of moving averages with varying lengths.
These lengths are dynamically adjusted through a starting factor and multiple increment factors, ensuring a comprehensive analysis over different time scales.
2. Normalization and Standard Deviation Calculation:
Once deviations are calculated, they undergo a normalization process, which can be set to 'None', 'Max-Min', or 'Absolute Sum'.
This step is crucial as it standardizes the deviations, allowing for a consistent scale of comparison.
The standard deviation of these normalized deviations is then calculated, offering insights into the market’s volatility and potential trend strength.
🔹Normalization
3. Median Value and Oscillator Creation:
The median of the normalized deviations forms the core of the FlexiMA-VT oscillator.
This median value provides a balanced central point, reflecting the consensus of various MA lengths.
The standard deviation bands plotted around the median enhance the interpretative power of the oscillator, indicating potential overbought or oversold conditions.
4. Multi-Factor Analysis:
The FlexiMA-VT uses multiple increment factors to generate a range of MAs, each factor representing a different scale of trend analysis.
By averaging the results from these different scales, the FlexiMA-VT forms a more comprehensive and reliable oscillator.
🔹Consensus
5. Practical Application:
Traders can use the FlexiMA-VT for various purposes, including identifying trend reversals, gauging market momentum, and determining overbought or oversold conditions.
Its dynamic nature makes it adaptable to different trading strategies, from short-term scalping to long-term position trading.
🔶 Settings
1. Indicator Source (indicatorSource): Determines the base data for calculations, typically a price average (HLC3).
2. Indicator Length (indicatorLength): Sets the base length for Moving Averages, influencing initial calculations.
3. Starting Factor (startingFactor): Initial multiplier for MA length, impacting the starting point of analysis.
4. Increment Factors (incrementFactor_1, incrementFactor_2, incrementFactor_3): Modulate the rate of change in MA lengths, adding variability.
5. Normalization Method (normalizeMethod): Standardizes deviations, with methods like 'Max-Min' and 'Absolute Sum' for comparability.

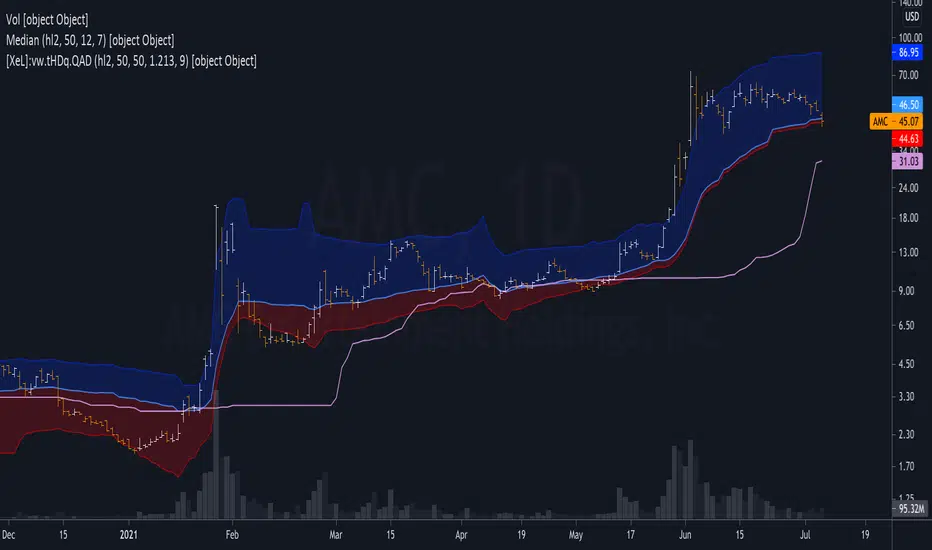
Trend Shift ProThe indicator is designed to identify shifts or changes in trends as blocks, the indicator's focus on analyzing the Median of Means, Interquartile Range, and Practical Significance for potential trend changes in the market using non parametric Cohen's D. The script is designed to operate on blocks of 21 bars. The key parts of the script related to this are the conditions inside the "if" statements: The bar_index % 21 == 0 condition checks if the current bar index is divisible by 21, meaning it's the beginning of a new block of 21 bars. This condition is used to reset and calculate new values at the start of each block.
Therefore, signals or calculations related to the median of means (MoM), interquartile range (IQR), and Cohen's D are updated and calculated once every 21 bars. What this means is the frequency of signals is shown once every 21 bars.
Price Movements of Blocks:
Block-Based Analysis: This approach divides the price data into blocks or segments, often a fixed number of bars or candles. Each block represents a specific interval of time or price action. It involves No Smoothing: Unlike moving averages, block-based analysis does not apply any smoothing to the price data within each block. It directly examines the raw prices within each block.
Let's break down the key concepts and how they are used for trading:
Median of Means (MoM):
The script calculates the median of the means of seven subgroups, each consisting of three bars in shuffled order.
Each subgroup's mean is calculated based on the typical price (hlc3) of the bars within that subgroup.
The median is then computed from these seven means, representing a central tendency measure.
Note: The Median of Means provides a robust measure of central tendency, especially in situations where the dataset may have outliers or exhibit non-normal distribution characteristics. By calculating means within smaller subgroups, the method is less sensitive to extreme values that might unduly influence the overall average. This can make the Median of Means more robust than a simple mean or median when dealing with datasets that have heterogeneity or skewed distributions.
Interquartile Range (IQR):
The script calculates the IQR for each block of 21 bars.
The IQR is a measure of statistical dispersion, representing the range between the first quartile (Q1) and the third quartile (Q3) of the data.
Q1 and Q3 are calculated from the sorted array of closing prices of the 21 bars.
Non-Parametric Cohen's D Calculation:
Cohen's D is a measure of effect size, indicating the standardized difference between two means.
In this script, a non-parametric version of Cohen's D is calculated, comparing the MoM values of the current block with the MoM values of the previous block.
The calculation involves the MoM difference divided by the square root of the average squared IQR values.
Practical Significance Threshold:
The user can set a threshold for practical significance using the Threshold input.
The script determines practical significance by comparing the calculated Cohen's D with this threshold.
Plotting:
The script plots the MoM values using both straight lines and circles, with the color of the circles indicating the direction of the MoM change (green for upward, red for downward, and blue for no change).
Triangular shapes are plotted when the absolute value of Cohen's D is less than the practical significance threshold.
Overall Purpose for Trading:
The indicator is designed to help traders identify potential turning points or shifts in market sentiment. and use it as levels which needs to be crossed to have a new trend.
Changes in MoM, especially when accompanied by practical significance as determined by Cohen's D, may signal the start of a new trend or a significant move in the market.
Traders using this indicator would typically look for instances where the MoM values and associated practical significance suggest a high probability of a trend change, providing them with potential entry or exit signals. It's important for users to backtest and validate the indicator's effectiveness in different market conditions before relying on it for trading decisions.

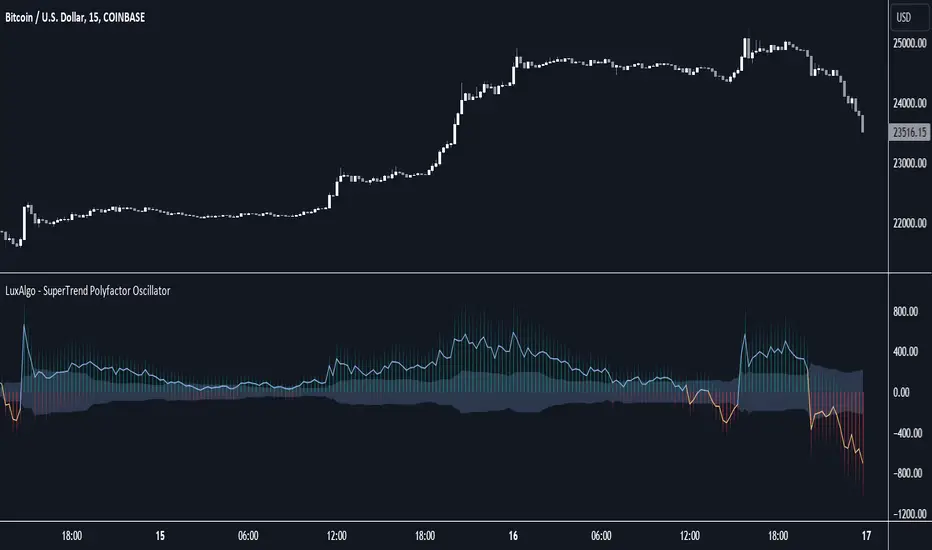
SuperTrend Polyfactor Oscillator [LuxAlgo]The SuperTrend Polyfactor Oscillator is an oscillator based on the popular SuperTrend indicator that aims to highlight information returned by a collection of SuperTrends with varying factors inputs.
A general consensus is calculated from all this information, returning an indication of the current market sentiment.
🔶 USAGE
Multiple elements are highlighted by the proposed oscillator. A mesh of bars is constructed from the difference between the price and a total of 20 SuperTrends with varying factors. Brighter colors of the mesh indicate a higher amount of aligned SuperTrends indications.
The factor input of the SuperTrends is determined by the user from the Starting Factor setting which determines the factor of the shorter-term SuperTrend, and the Increment settings which control the step between each factor inputs.
Using higher values for these settings will return information for longer-term term price variations.
🔹 Consensus
From the collection of SuperTrends, a consensus is obtained. It is calculated as the median of all the differences between the price and the collection of SuperTrends.
This consensus is highlighted in the script by a blue and orange line, with a blue color indicating an overall bullish market, and orange indicating a bearish market.
Both elements can be used together to highlight retracements within a trend. If we see various red bars while the general consensus is bullish, we can interpret it as the presence of a retracement.
🔹 StDev Area
The indicator includes an area constructed from the standard deviation of all the differences between the price and the collection of SuperTrends.
This area can be useful to see if the market is overall trending or ranging, with a consensus over the area indicative of a trending market.
🔹 Normalization
Users can decide to normalize the results and constrain them within a specific range, this can allow obtaining a lower degree of variations of the indicator outputs. Two methods are proposed "Absolute Sum", and "Max-Min".
The "Absolute Sum" method will divide any output returned by the indicator by the absolute sum of all the differences between the price and SuperTrends. This will constrain all the indicator elements in a (1, -1) scale.
The "Max-Min" method will apply min-max normalization to the indicator outputs (with the exception of the stdev area). This will constrain all the indicator elements in a (0, 1) scale.
🔶 SETTINGS
Length: ATR Length of all calculated SuperTrends.
Starting Factor: Factor input of the shorter-term SuperTrend.
Increment: Step value between all SuperTrends factors.
Normalize: Normalization method used to rescale the indicator output.
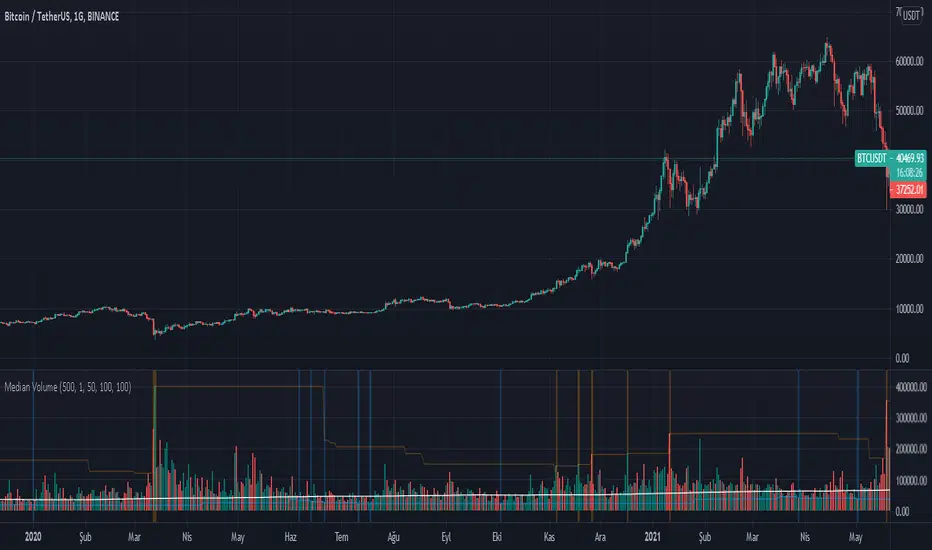
Median of Means Estimator Median of Means (MoM) is a measure of central tendency like mean (average) and median. However, it could be a better and robust estimator of central tendency when the data is not normal, asymmetric, have fat tails (like stock price data) and have outliers. The MoM can be used as a robust trend following tool and in other derived indicators.
Median of means (MoM) is calculated as follows, the MoM estimator shuffles the "n" data points and then splits them into k groups of m data points (n= k*m). It then computes the Arithmetic Mean of each group (k). Finally, it calculate the median over the resulting k Arithmetic Means. This technique diminishes the effect that outliers have on the final estimation by splitting the data and only considering the median of the resulting sub-estimations. This preserves the overall trend despite the data shuffle.
Below is an example to illustrate the advantages of MoM
Set A Set B Set C
3 4 4
3 4 4
3 5 5
3 5 5
4 5 5
4 5 5
5 5 5
5 5 5
6 6 8
6 6 8
7 7 10
7 7 15
8 8 40
9 9 50
10 100 100
Median 5 5 5
Mean 5.5 12.1 17.9
MoM 5.7 6.0 17.3
For all three sets the median is the same, though set A and B are the same except for one outlier in set B (100) it skews the mean but the median is resilient. However, in set C the group has several high values despite that the median is not responsive and still give 5 as the central tendency of the group, but the median of means is a value of 17.3 which is very close to the group mean 17.9. In all three cases (set A, B and C) the MoM provides a better snapshot of the central tendency of the group. Note: The MoM is dependent on the way we split the data initially and the value might slightly vary when the randomization is done sevral time and the resulting value can give the confidence interval of the MoM estimator.
Oscillator Profile IndicatorDescription:
The Oscillator Profile Indicator (OPI) is designed to provide insights into market trends and potential reversal points by profiling the value distribution of an oscillator or the price chart over a specified lookback period.
The OPI works by calculating the Point of Control (PoC) for the oscillator values or prices in the given lookback period. This PoC, essentially a median, is considered the fair value where most trading activities have happened. Along with this, OPI also calculates lower and upper boundaries by taking the specified percentile of the sorted distribution of values. These boundaries outline the value area within which a significant portion of trading activity has occurred.
The main feature of the OPI is the interpretation of PoC movement and how it relates to general market trends. If the PoC moves above 0 on the oscillator, it's a potential indication that we are in a general uptrend. Conversely, if the PoC moves below 0, this can be a signal for a general downtrend.
Usage:
While OPI can be used on both price charts and oscillators, its effectiveness is more pronounced when used on oscillators. Applying this indicator to oscillators such as the Relative Strength Index (RSI) or the Moving Average Convergence Divergence (MACD) can provide useful insights.
How to Read:
PoC line: The line represents the median of the past 'n' periods. Its movement above or below 0 can be used to identify general uptrends or downtrends respectively.
Upper and Lower Boundary lines: These lines represent the specified percentile of the value distribution in the lookback period.
Colored Fills: The fills between the upper and lower boundary lines visually represent the value area. The color changes based on the relative position of the source value (price or oscillator value) to the PoC.
Signals:
An uptrend is indicated when the PoC moves above 0 on the oscillator, especially when coupled with an upward crossover of the source value through the PoC.
A downtrend is signaled when the PoC drops below 0 on the oscillator, particularly when paired with a downward crossover of the source value through the PoC.
(!) Note: Like all indicators, OPI should be used in conjunction with other technical analysis tools for the best results. It is also advisable to backtest this indicator with your strategy before using it in live trading.

50% candlestick closeThis indicator is useful at important level, when you want to see some bullish or bearish signs in candlestick.
At your important support level you can buy, if candlestick close is above 50% of its range, with low of this candlestick as SL.
At your important resistance level you can sell, if candlestick close is below 50% of its range, with high of this candlestick as SL.

Inter-Exchanges Crypto Price Spread Clouds (Tartigradia)Display variations in min-max and median values of high, low and close across exchanges. It's a kind of realized volatility indicator, as the idea is that in times of high volatility (high emotions, fear, uncertainty), it's more likely that market inefficiencies will appear for the same asset between different market makers, ie, the price can temporarily differ a lot. This indicator will catch these instants of high differences between exchanges, even if they lasted only an instant (because we use high and low values).
Compared with my other "Inter-Exchanges Crypto Price Spread Deviation" indicator, this one overlays directly on the chart, and offers a different take based on the same premisses. Instead of summarizing volatility via standard deviation, here we display clouds of the range of values that were observed.
A big advantage of this approach is that it can also be used to determine safe stop loss levels, especially the values of percentile rank (i.e., what are the high values that were observed in at least 50% of exchanges?).
Indeed, all price levels are displayed in the indicator's status bar:
green for high values,
red for low values,
aqua for median,
purple for average,
The first two values are max and min values of high across exchanges (in green).
The next two values are max and min of low across exchanges (in red).
The next two values are median (aqua) and average (purple).
The last two values are percentile rank values for high (green) and low (red) respectively.
Another advantage is that the high (green) vs low (red) clouds can be seen as representing the buying or selling pressure respectively across exchanges, and this may in itself provide a signal to know whether one side is winning.
Link to my other complementary indicator:
Compared to other inter-exchanges spread indicators, this one offers two major features:
The symbol automatically adapts to the symbol currently selected in user's chart. Hence, switching between tickers does not require the user to modify any option, everything is dynamically updated behind the scenes.
It's easy to add more exchanges (requires some code editing because PineScript v5 does not allow dynamical request.security() calls).
Limitations/things to know:
History is limited to what the ticker itself display. Ie, even if the exchanges specified in this indicator have more data than the ticker currently displayed in the user's chart, the indicator will show only a timeperiod as long as the chart.
The indicator can manage multiple exchanges of different historical length (ie, some exchanges having more data going way earlier in the past than others), in which case they will simply be ignored from calculations when far back in the past. Hence, you should be aware that the further you go in the past, the less exchanges will have such data, and hence the less accurate the measures will be (because the deviation will be calculated from less sources than more recent bars). This is thanks to how the array.* math functions behave in case of na values, they simply skip them from calculations, contrary to math.* functions.

Variety N-Tuple Moving Averages w/ Variety Stepping [Loxx]Variety N-Tuple Moving Averages w/ Variety Stepping is a moving average indicator that allows you to create 1- 30 tuple moving average types; i.e., Double-MA, Triple-MA, Quadruple-MA, Quintuple-MA, ... N-tuple-MA. This version contains 2 different moving average types. For example, using "50" as the depth will give you Quinquagintuple Moving Average. If you'd like to find the name of the moving average type you create with the depth input with this indicator, you can find a list of tuples here: Tuples extrapolated
Due to the coding required to adapt a moving average to fit into this indicator, additional moving average types will be added as they are created to fit into this unique use case. Since this is a work in process, there will be many future updates of this indicator. For now, you can choose from either EMA or RMA.
This indicator is also considered one of the top 10 forex indicators. See details here: forex-station.com
Additionally, this indicator is a computationally faster, more streamlined version of the following indicators with the addition of 6 stepping functions and 6 different bands/channels types.
STD-Stepped, Variety N-Tuple Moving Averages
STD-Stepped, Variety N-Tuple Moving Averages is the standard deviation stepped/filtered indicator of the following indicator
Last but not least, a big shoutout to @lejmer for his help in formulating a looping solution for this streamlined version. this indicator is speedy even at 50 orders deep. You can find his scripts here: www.tradingview.com
How this works
Step 1: Run factorial calculation on the depth value,
Step 2: Calculate weights of nested moving averages
factorial(depth) / (factorial(depth - k) * factorial(k); where depth is the depth and k is the weight position
Examples of coefficient outputs:
6 Depth: 6 15 20 15 6
7 Depth: 7 21 35 35 21 7
8 Depth: 8 28 56 70 56 28 8
9 Depth: 9 36 34 84 126 126 84 36 9
10 Depth: 10 45 120 210 252 210 120 45 10
11 Depth: 11 55 165 330 462 462 330 165 55 11
12 Depth: 12 66 220 495 792 924 792 495 220 66 12
13 Depth: 13 78 286 715 1287 1716 1716 1287 715 286 78 13
Step 3: Apply coefficient to each moving average
For QEMA, which is 5 depth EMA , the calculation is as follows
ema1 = ta. ema ( src , length)
ema2 = ta. ema (ema1, length)
ema3 = ta. ema (ema2, length)
ema4 = ta. ema (ema3, length)
ema5 = ta. ema (ema4, length)
In this new streamlined version, these MA calculations are packed into an array inside loop so Pine doesn't have to keep all possible series information in memory. This is handled with the following code:
temp = array.get(workarr, k + 1) + alpha * (array.get(workarr, k) - array.get(workarr, k + 1))
array.set(workarr, k + 1, temp)
After we pack the array, we apply the coefficients to derive the NTMA:
qema = 5 * ema1 - 10 * ema2 + 10 * ema3 - 5 * ema4 + ema5
Stepping calculations
First off, you can filter by both price and/or MA output. Both price and MA output can be filtered/stepped in their own way. You'll see two selectors in the input settings. Default is ATR ATR. Here's how stepping works in simple terms: if the price/MA output doesn't move by X deviations, then revert to the price/MA output one bar back.
ATR
The average true range (ATR) is a technical analysis indicator, introduced by market technician J. Welles Wilder Jr. in his book New Concepts in Technical Trading Systems, that measures market volatility by decomposing the entire range of an asset price for that period.
Standard Deviation
Standard deviation is a statistic that measures the dispersion of a dataset relative to its mean and is calculated as the square root of the variance. The standard deviation is calculated as the square root of variance by determining each data point's deviation relative to the mean. If the data points are further from the mean, there is a higher deviation within the data set; thus, the more spread out the data, the higher the standard deviation.
Adaptive Deviation
By definition, the Standard Deviation (STD, also represented by the Greek letter sigma σ or the Latin letter s) is a measure that is used to quantify the amount of variation or dispersion of a set of data values. In technical analysis we usually use it to measure the level of current volatility .
Standard Deviation is based on Simple Moving Average calculation for mean value. This version of standard deviation uses the properties of EMA to calculate what can be called a new type of deviation, and since it is based on EMA , we can call it EMA deviation. And added to that, Perry Kaufman's efficiency ratio is used to make it adaptive (since all EMA type calculations are nearly perfect for adapting).
The difference when compared to standard is significant--not just because of EMA usage, but the efficiency ratio makes it a "bit more logical" in very volatile market conditions.
See how this compares to Standard Devaition here:
Adaptive Deviation
Median Absolute Deviation
The median absolute deviation is a measure of statistical dispersion. Moreover, the MAD is a robust statistic, being more resilient to outliers in a data set than the standard deviation. In the standard deviation, the distances from the mean are squared, so large deviations are weighted more heavily, and thus outliers can heavily influence it. In the MAD, the deviations of a small number of outliers are irrelevant.
Because the MAD is a more robust estimator of scale than the sample variance or standard deviation, it works better with distributions without a mean or variance, such as the Cauchy distribution.
For this indicator, I used a manual recreation of the quantile function in Pine Script. This is so users have a full inside view into how this is calculated.
Efficiency-Ratio Adaptive ATR
Average True Range (ATR) is widely used indicator in many occasions for technical analysis . It is calculated as the RMA of true range. This version adds a "twist": it uses Perry Kaufman's Efficiency Ratio to calculate adaptive true range
See how this compares to ATR here:
ER-Adaptive ATR
Mean Absolute Deviation
The mean absolute deviation (MAD) is a measure of variability that indicates the average distance between observations and their mean. MAD uses the original units of the data, which simplifies interpretation. Larger values signify that the data points spread out further from the average. Conversely, lower values correspond to data points bunching closer to it. The mean absolute deviation is also known as the mean deviation and average absolute deviation.
This definition of the mean absolute deviation sounds similar to the standard deviation (SD). While both measure variability, they have different calculations. In recent years, some proponents of MAD have suggested that it replace the SD as the primary measure because it is a simpler concept that better fits real life.
For Pine Coders, this is equivalent of using ta.dev()
Bands/Channels
See the information above for how bands/channels are calculated. After the one of the above deviations is calculated, the channels are calculated as output +/- deviation * multiplier
Signals
Green is uptrend, red is downtrend, yellow "L" signal is Long, fuchsia "S" signal is short.
Included:
Alerts
Loxx's Expanded Source Types
Bar coloring
Signals
6 bands/channels types
6 stepping types
Related indicators
3-Pole Super Smoother w/ EMA-Deviation-Corrected Stepping
STD-Stepped Fast Cosine Transform Moving Average
ATR-Stepped PDF MA

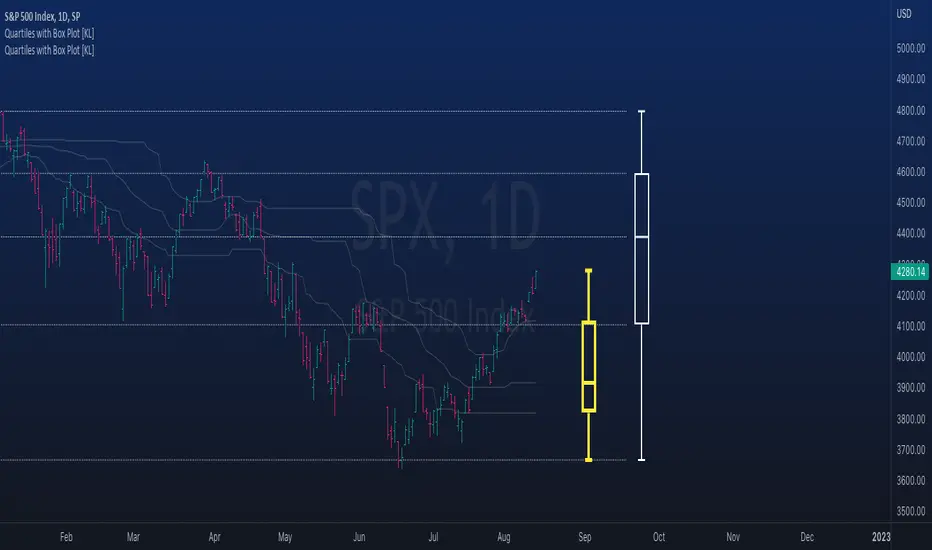
Rolling QuartilesThis script will continuously draw a boxplot to represent quartiles associated with data points in the current rolling window.
Description :
A quartile is a statistical term that refers to the division of a dataset based on percentiles.
Q1 : Quartile 1 - 25th percentile
Q2 : Quartile 2 - 50th percentile, as known as the median
Q3 : Quartile 3 - 75th percentile
Other points to note:
Q0: the minimum
Q4: the maximum
Other properties :
- Q1 to Q3: a range is known as the interquartile range ( IQR ). It describes where 50% of data approximately lie.
- Line segments connecting IQR to min and max (Q0→Q1, and Q3→Q4) are known as whiskers . Data lying outside the whiskers are considered as outliers. However, such extreme values will not be found in a rolling window because whenever new datapoints are introduced to the dataset, the oldest values will get dropped out, leaving Q0 and Q4 to always point to the observable min and max values.
Applications :
This script has a feature that allows moving percentiles (moving values of Q1, Q2, and Q3) to be shown. This can be applied for trading in ways such as:
- Q2: as alternative to a SMA that uses the same lookback period. We know that the Mean (SMA) is highly sensitive to extreme values. On the other hand, Median (Q2) is less affected by skewness. Putting it together, if the SMA is significantly lower than Q2, then price is regarded as negatively skewed; prices of a few candles are likely exceptionally lower. Vice versa when price is positively skewed.
- Q1 and Q3: as lower and upper bands. As mentioned above, the IQR covers approximately 50% of data within the rolling window. If price is normally distributed, then Q1 and Q3 bands will overlap a bollinger band configured with +/- 0.67x standard deviations (modifying default: 2) above and below the mean.
- The boxplot, combined with TradingView's builtin bar replay feature, makes a great tool for studies purposes. This helps visualization of price at a chosen instance of time. Speaking of which, it can also be used in conjunction with a fixed volume profile to compare and contrast the effects (in terms of price range) with and without consideration of weights by volume.
Parameters :
- Lookback: The size of the rolling window.
- Offset: Location of boxplot, right hand side relative to recent bar.
- Source data: Data points for observation, default is closing price
- Other options such as color, and whether to show/hide various lines.
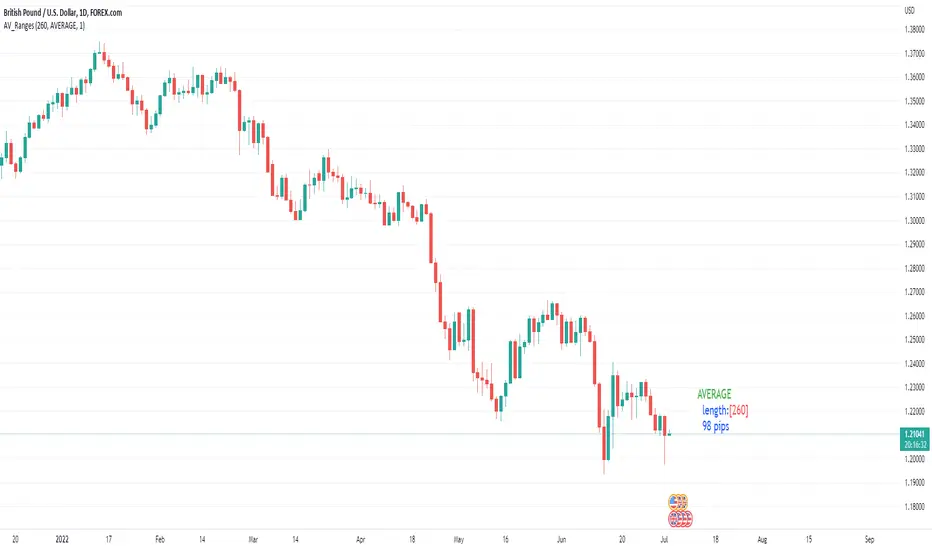
Average, Median, Mode, Biggest: Pip Range Measures & LabelsApply various simple statistical measures to series of full candle ranges over user input length (in bars).
Choose between AVERAGE, MEDIAN, MODE, BIGGEST.
All calculations derive from the high-low range of a candle.
Default length = 260, the number of daily candles in a year.
MODE is calculated from pip ranges rounded to reasonable increments (to nearest 10pips foreign currencies; to nearest 100 pips for DXY ; nearest $10 for other assets). Best only use MODE for the major FX pairs encoded, and on Daily timeframe .
User input 'unit multiplier' only applies when asset is NOT a major Forex pair (unit and multiplier is auto applied for for major FX pairs).
© twingall
Ehlers Median Average Adaptive Filter [CC]The Median Average Adaptive Filter was created by John Ehlers and this is another in my current series of undiscovered gems. I'm sure you are all saying but Franklin, Ehlers doesn't have any undiscovered gems but in this case you would be wrong. This was actually an indicator so buried on the internet that I had to use the wayback machine to find the original source code. Ehlers notoriously hates adaptive moving averages which is funny because he has made a decent amount of them. This is a very unique indicator that uses a while loop to adjust the length and I thought it deserved some extra recognition from the TV community. I have included strong buy and sell signals in addition to normal ones so strong signals are darker in color and normal signals are lighter in color. Buy when the line turns green and sell when it turns red.
Let me know if there are any other scripts or indicators you would like to see me publish!

MA VisualizerThe MA Visualizer is made up of 5 Moving Averages (MA)
All MA change color when the price closes above or below the MA line.
The background between the MA line and price will also change color, this creates the Visualizer.
When two or more MA are selected the two visualizer's will combine and create a gradient effect.
Each MA can be adjusted with 6 source selection's to choose from (SMA , EMA , WMA , HMA , RMA , WVMA).
The Visualizer can be turned off while leaving the MA lines turned on and vice versa.
Their is also a MA Cross indicator built-in.

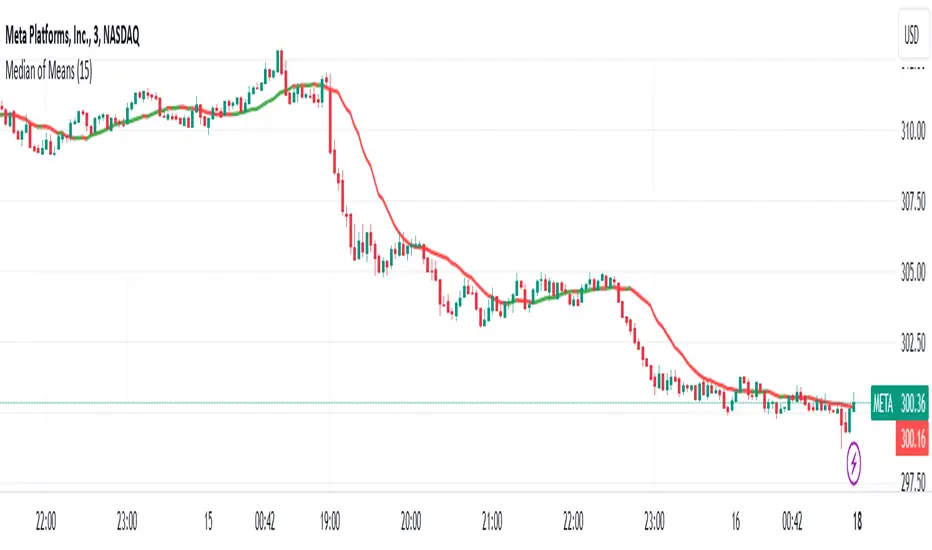
Median Convergence DivergenceIntroduction
The Median Convergence Divergence (MCD) is a derivative of the Moving Average Convergence Divergence (MACD). The difference is the change in the use of the measure of central tendency. In MACD, moving average (mean) is used, whereas, in MCD, the median is used instead. The purpose of using the median is to eliminate the outlying values, which would be calculated for a moving average. The outliers would affect the value of the moving average.
For example: 3, 5, 7, 8, 5, 4, 2, 1, 6, 21, 8. The data set average is 6.3, whereas the median value is 5. There is a difference of about 23% in the example. The reason is the outlying value '21' in the data set.
As the markets are volatile, outlying values can always emerge. A moving average will consider those values; on the other hand, the median will ignore. If the strategy calls for a tool to ignore the outliers, the Median Convergence Divergence would be a great centered oscillator.
The default values have changed to suit the current trading days in a week. When the MACD was introduced, there would be six trading days in a week. Therefore, it used 12 (2 weeks), 26(4 weeks), and 9 ( 1.5 weeks). But now that there are five trading days per week. The default values are adapted to them. Feel free to change them as per your wish.
Recommended Settings
The current settings are set to be used for the Daily Time Frame: 5 day period for the fast line, a 20 day period for the slow line, and a 10 day period for the signal line. (5 days represent a trading week, 10 days is two weeks, and 20 days is 4 weeks or a month)
For the weekly charts, use 4 week period for the fast line, 13 week period for the slow line, and 8 week period for the signal line. (4 weeks represent a month, 8 weeks is two months, and 13 weeks is 3 months or quarterly)
And for monthly charts, use 3 month period for the fast line, 12 month period for the slow line, and 6 month period for the signal line. (3 months is quarterly, 6 months is bi-yearly, and 12 month is yearly)
It'll be challenging to measure for intraday since there are many different timeframes within intraday. The settings mentioned above should also be customized as per the requirements of the trading strategy.
Strategy
The strategy application is the same as the MACD, i.e., Signal Line Crossovers, Zero Line Crossovers, and Divergence.
Signal Line Crossovers: When the MCD line crosses above the Signal line, it's a bullish crossover. When the MCD line crosses below the Signal line, it's a bearish crossover.
Zero Line Crossovers: It's a bullish crossover when the MCD line crosses above the Zero line. When the MCD line crosses below the Zero Line, it's a bearish crossover.
Divergence: When price shows a lower low, but MCD shows a higher low, it's a bullish divergence. When the price shows a higher high but MCD shows a lower high, it's a bearish divergence.
Using other indicators in conjunction with the Median Convergence Divergence is recommended to take entry and exit signals.

Média 8, 21, 56, 200 SEMANAL - Augusto BackesFique tranquilo, aqui tem todas as médias que o Backes utiliza dentro de um indicador só, aproveite :)

vol_rangesThis script shows three measures of volatility:
historical (hv): realized volatility of the recent past
median (mv): a long run average of realized volatility
implied (iv): a user-defined volatility
Historical and median volatility are based on the EWMA, rather than standard deviation, method of calculating volatility. Since Tradingview's built in ema function uses a window, the "window" parameter determines how much historical data is used to calculate these volatility measures. E.g. 30 on a daily chart means the previous 30 days.
The plots above and below historical candles show past projections based on these measures. The "periods to expiration" dictates how far the projection extends. At 30 periods to expiration (default), the plot will indicate the one standard deviation range from 30 periods ago. This is calculated by multiplying the volatility measure by the square root of time. For example, if the historical volatility (hv) was 20% and the window is 30, then the plot is drawn over: close * 1.2 * sqrt(30/252).
At the most recent candle, this same calculation is simply drawn as a line projecting into the future.
This script is intended to be used with a particular options contract in mind. For example, if the option expires in 15 days and has an implied volatility of 25%, choose 15 for the window and 25 for the implied volatility options. The ranges drawn will reflect the two standard deviation range both in the future (lines) and at any point in the past (plots) for HV (blue), MV (red), and IV (grey).

Weighted Harrell-Davis Quantile Estimator with AbsoluteDeviation
QUANTILE ESTIMATORS
Weighted Harrell-Davis Quantile Estimator with Absolute Deviation Fences.
DISCLAIMER:
The Following indicator/code IS NOT intended to be a formal investment advice or recommendation by the author, nor should be construed as such. Users will be fully responsible by their use regarding their own trading vehicles/assets.
The following indicator was made for NON LUCRATIVE ACTIVITIES and must remain as is, following TradingView's regulations. Use of indicator and their code are published for work and knowledge sharing. All access granted over it, their use, copy or re-use should mention authorship(s) and origin(s).
WARNING NOTICE!
THE INCLUDED FUNCTION MUST BE CONSIDERED FOR TESTING. The models included in the indicator have been taken from open sources on the web and some of them has been modified by the author, problems could occur at diverse data sceneries, compiler version, or any other externality.
Purpose:
Weighted Quantiles or <> are quite difficult to find on must systems, also it's non-weighted approach are rarely used to estimate the location parameter of price distribution WICH IS NOT NORMAL, all this in favour of it's non-robust counterpart, the Arithmetic rolling Mean or <> and it's weighted variants like the WMA, VWAP, etc.
Also, a big drawback from this is that must statistics derived from Normal-Distribution parameter location (the Mean) definitely will not fit for an efficient, nor robust estimation for price distributions, so their moments like the standard deviation, kurtosis, skewness, etc. will not be the better tools to build derived algorithms or technical indicators among price/volume.
In an effort searching better statistical tools for price distributions, I found the excellent work of Andrey Akinshin that took me to port some of their Math research contributions for the compute benchmarking field , and bring it here at the TradingView ecosystem to take a shot at the price distribution crazy fields. For a better detail of what the weighted Harrell-Davis Quantile Estimator can do, who better than drink directly from the source at References:
References:
Weighted Quantile Estimators.
DoubleMAD outlier detector based on the Harrell-Davis quantile estimator.
Unbiased median absolute deviation based on the Harrell-Davis quantile estimator.
Quantile confidence intervals for weighted samples.
Licensing:
This work is licensed under a Attribution-NonCommercial-ShareAlike 4.0 International Copyright (c) 2021 (CC BY-NC-SA 4.0)
Copyright's & Mentions:
The Gamma Functions & Beta Probability Density Functions C# implementations by the Math.NET Numerics, part of the Math.NET Project.
The Regularized Incomplete (Left) Beta Function C# implementation by the SAMTools, htslib project.
The Weighted Harrell-Davis Quantile estimator ; C# & R implementations by Andrey Akinshin.
External PineScript code, methods, support & consultancy by @PineCoders staff with special mention for:
+ "ma sorter ('sort by array' example)- JD" by @Duyck.
+ Porting, mods, compilation and debugging for this script by @XeL_Arjona for the TradingView's @PineCoders community.