Tilson T3 and MavilimW Triple Combined StrategyInspired by truly greatful Kivanç Ozbilgic (www.tradingview.com).
The strategy tries to combined three different moving average strategies into one.
Strategies covered are:
1. Tillson T3 Moving Average Strategy
Developed by Tim Tillson, the T3 Moving Average is considered superior to traditional moving averages as it is smoother, more responsive and thus performs better in ranging market conditions as well. However, it bears the disadvantage of overshooting the price as it attempts to realign itself to current market conditions.
It incorporates a smoothing technique which allows it to plot curves more gradual than ordinary moving averages and with a smaller lag. Its smoothness is derived from the fact that it is a weighted sum of a single EMA, double EMA, triple EMA and so on. When a trend is formed, the price action will stay above or below the trend during most of its progression and will hardly be touched by any swings. Thus, a confirmed penetration of the T3 MA and the lack of a following reversal often indicates the end of a trend. Here is what the calculation looks like:
T3 = c1*e6 + c2*e5 + c3*e4 + c4*e3, where:
– e1 = EMA (Close, Period)
– e2 = EMA (e1, Period)
– e3 = EMA (e2, Period)
– e4 = EMA (e3, Period)
– e5 = EMA (e4, Period)
– e6 = EMA (e5, Period)
– a is the volume factor, default value is 0.7 but 0.618 can also be used
– c1 = – a^3
– c2 = 3*a^2 + 3*a^3
– c3 = – 6*a^2 – 3*a – 3*a^3
– c4 = 1 + 3*a + a^3 + 3*a^2
T3 MovingThe T3 Moving Average generally produces entry signals similar to other moving averages and thus is traded largely in the same manner.
Strategy for Tillson T3 is if the close crossovers T3 line and for at least five bars the close was under the T3
2. Tillson T3 Fibonacci Cross
Kivanc Ozbilgic added a second T3 line with a volume factor of 0.618 (Fibonacci Ratio) and length of 3 (fibonacci number) which can be added by selecting the T3 Fibonacci Strategy input box.
Strategy for Tillson T3 Fibo is when the Fibo Line crossover the T3 it gives long signal vice versa.
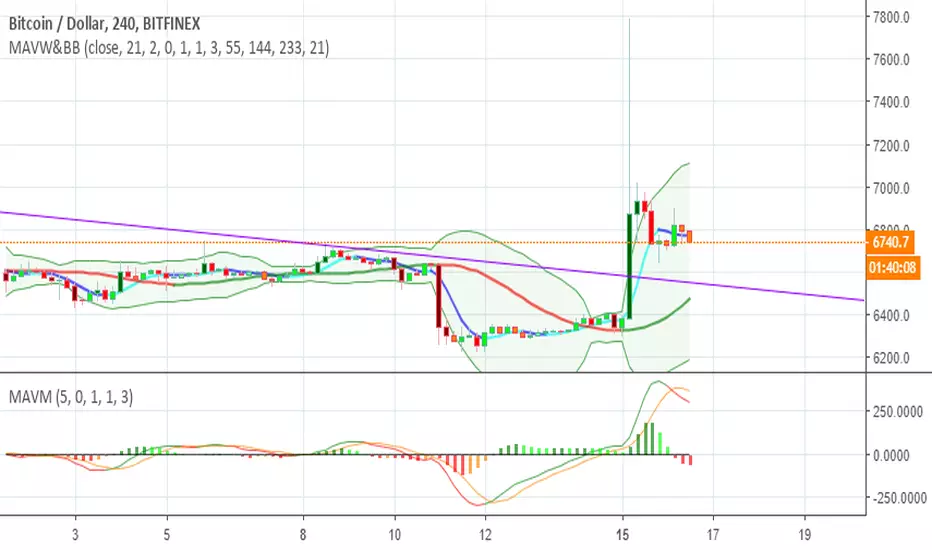
3. MavilimW
MavilimW is originally a support and resistance indicator based on fibonacci injected weighted moving averages.
Strategy for MavilimW is is if the close crossovers T3 line and for at least five bars the close was under the T3
Hope you enjoy
Mavilim

MavilimW Ortalamaları by KIVANÇ fr3762Modified version of MavilimW Indicator by @mavilim0732
MavilimW is originally a support and resistance indicator based on fibonacci injected weighted moving averages
Developed by @mavilim0732 on twitter
İndikatörü geliştiren: @mavilim0732

Kıvanç HL MTFMULTIPLE TIME FRAME version of KIVANÇ HL Indicator:
Kıvanç HL indicator is a useful tool to define RESISTANCE and SUPPORT levels by analyzing previous HIGH and LOW levels od fibonacci lengths.
There are 3 lines HIGH, LOW and their exact average MID line.
Each line could be a significant support and resistance level due to the price action.
Breakouts are very important when supported by volume and new highs are expected when upward breakouts take place.
Version 2 has 4 more levels of lines calculated with Fibonacci constants between the HIGH and LOW lines.
Version 2 can be activated by cheching the box in the settings of the indicator.
Special thanks from me to MaviliM for developing such a great indicator and giving my name
creator: @mavilim0732 on twitter
Here's the link to the complete list of all my indicators:
tr.tradingview.com
İndikatörü geliştiren: @mavilim0732 on twitter

Multiple Trend İndicator+ By BD4 different color trend show for weekly, daily and 4 hours.
red : mavilim downtrend, and mavilim below the wma21
orange : mavilim uptrend, and mavilim below the wma21
lime : mavilim downtrend, and mavilim above the wma21
green : mavilim uptrend, and mavilim above the wma21
also on the current chart; u can show current mavilim, weekly wma21, daily wma21 and 4hours wma21.
also you can add code into your frequently used indicator.
I hope this helps you.
sorry i don't know enough english for detailed description. you can try and learn more

Mavilim Multiple Trend By BDweekly mavilim line,daily mavilim line and more,within your current chart. and shows multiple mavilim trend. if u need something like this

Kıvanç HL by MaviliM0732Kıvanç HL indicator is a useful tool to define RESISTANCE and SUPPORT levels by analyzing previous HIGH and LOW levels od fibonacci lengths.
There are 3 lines HIGH, LOW and their exact average MID line.
Each line could be a significant support and resistance level due to the price action.
Breakouts are very important when supported by volume and new highs are expected when upward breakouts take place.
Version 2 has 4 more levels of lines calculated with Fibonacci constants between the HIGH and LOW lines.
Version 2 can be activated by cheching the box in the settings of the indicator.
Special thanks from me to MaviliM for developing such a great indicator and giving my name
creator: @mavilim0732 on twitter


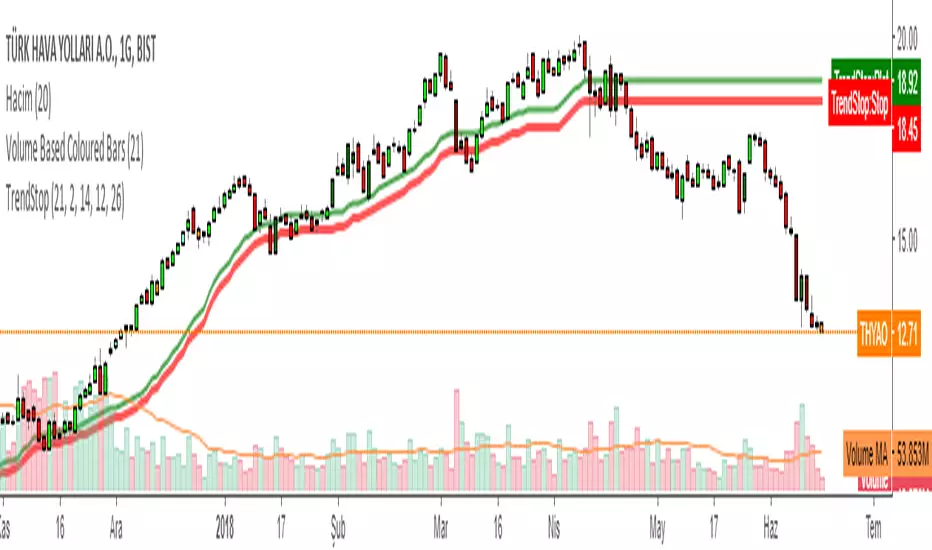
TrendStop by mavilim0732 and KIVANC fr3762TREND STOP is a trend following and Stop Loss indicator.
Prices are on trend after Green line suddenly crossing below prices, conversely bearish after crossing above...
The absolute Stop Level is the red line.
Macd and also Directional indicator signals considered as buy signals in calculating the Trend Stop indicator.
ALSO users can change the 21 Period calculation of the indicator between EMA and the default option of VWAP .
creator: @mavilim0732 on twitter
A2MK Mavilim by KıvanÇ fr3762A2MK is a two lined indicator which gives Short and Long signals...
Go long when GREEN line crosses ABOVE YELLOW
Go short when YELLOW line crosses ABOVE GREEN
(the default version of the indicator has the Yellow line although I personally changed the color to Orange to recognise better)
You can change the length of the two lines but creator (@mavilim0732 on twitter ) explained: there's no need to change the YELLOW line's length. (default value=10)
Green line has the length of a default value of 6, you can set it to lower lengths to provide earlier signals but keep in mind that if you do that you'll have more signals
The main feature of A2MK is the few number of false signals.
signals are very reliable when comparing lots of other indicators
creator: @mavilim0732 on twitter
İndikatörü geliştiren: @mavilim0732 on twitter

MavilimWThis Indicator plots smoothed weighted moving average combinations of various Fibonacci numbers
a great support and resistance for long term trading and confirmation
