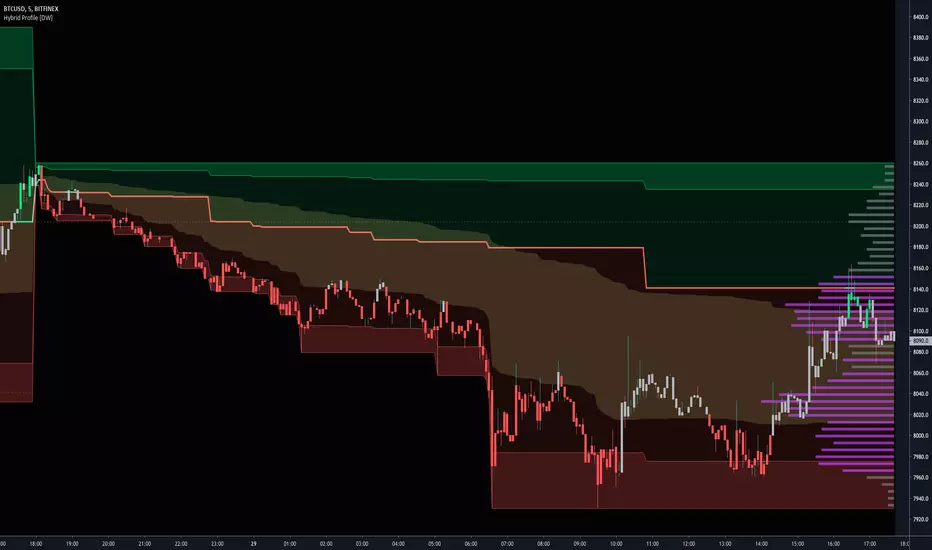
Hybrid Profile [DW]This is an experimental study inspired by J. Peter Steidlmayer's Market Profile tool with an alternative set of calculations for analyzing price action and distribution over a defined interval.
This tool is geared toward finding price reactive points for better entry and exit positions.
In this script, price range over a user defined interval (up to 4000 bars) is divided into 50 sections, then TPOs are counted for each section to generate the distribution histogram. Histogram lines are calculated in real time, and recalculate on each new bar.
Areas of significance are displayed as purple lines in the histogram, making it incredibly simple to identify levels that price will likely react to. The significance sensitivity can be manually adjusted for desired output.
Rather than using POC, I created a series of proprietary calculations to generate what I call the Point Of Focus (POF). This line is similar to POC, but does not always follow the highest count in the distribution.
The POF is designed to experience less whipsaws than POC, which makes trading using the POF much simpler since its value is more consistent. On historical data, price has shown to either revert to or launch from the POF rather frequently.
Unlike a conventional Market Profile, this profile doesn't have a "value area". Instead it has a Mean Value Zone, which is calculated using a series of custom VWAP calculations. The output is similar to VA, but much smoother.
This script has a built in tick volume substitution for charts with no real volume data, making all elements of the script compatible with any cryptocurrency, stock, currency pair, or index you want to analyze.
A bar color scheme is included within this script which can be used to help determine dominant trend and local extremes of the interval.
This tool is not necessarily better or worse than the classic Market Profile, nor is it a replacement for Volume Profile.
However, this is a powerful alternative that can both simplify and improve your technical analysis.
Marketprofile
Dependent Variable Odd Generator For Machine Learning TechniquesCAUTION : Not suitable for strategy, open to development.
If can we separate the stagnant market from other markets, can we be so much more accurate?
This project was written to research it. It is just the tiny part of the begining.
And this is a very necessary but very small side function in the main function. Lets start :
Hi users, I had this idea in my mind for a long time but I had a hard time finding the parameters that would make the market stagnant. This idea is my first original command system. Although it is very difficult to make sense of the stagnant market, I think that this command system can achieve realistic proportions. With 's money flow index, I opened the track to determine the level. On the other hand, the prices were also using a money flow index, and it forced me to make the limitations between the levels in a logical way. But the good thing is that since the bollinger bandwidth uses a larger period, we are able to print normal values at extreme buy and sell values.
In terms of price, we can define excessive purchase and sale values as the period is smaller. I have repeatedly looked at the limit values that determine the bull, bear, and bollinger bandwidth (mfi), and I think this is the right one. Then I have included these values in the probability set.
The bull and bear market did not form the intersection of the cluster, and because there are connected events, the stagnant market, which is the intersection, will be added to the other markets with the same venn diagram logic and the sum of the probability set will be 1. is equal to. I hope that we can renew the number generators in the very important parameters of machine learning such as Markov Process with generators dependent on dependent variables, which bring us closer to reality. This function is open to development and can be made of various ideas on machine learning. Best wishes.
This code is open source under the MIT license. If you have any improvements or corrections to suggest, please send me a pull request via the github repository github.com


FIG - Volume Spread analysis Volume spread analysis is a very powerful tool developed by Tom Williams. Probably considered as the father of Volume spread analysis. He is a Syndicate trader who knows well about how smart moneys are playing their role.
I have developed an Indicator with Trading View called Volume spread analysis. We in FIG strongly believe that, we cannot beat or out perform institutional traders, instead we have to travel along with them . With that in mind we follow the footprints of Smart players who leave behind trails. People who are wise enough pick the trails along with us and earn descent amount of profit.
I have designed this indicator, so that it is capable of giving signals for all the phenomenon explained in the Tom Williams book.
Note The calculation of spread and volume are based on my research and analysis. To know more about me and my trading skills just follow me in trading view.
This Indicator is successful for the following phenomenon presently.
Trapped Buyers
Trapped Sellers
Stopping Volume (long)
Buying Climax
Selling Climax
I will be giving constant updates to indicator whenever a signal becomes successful. Other indicators are under test. so kindly disable those indicators in the settings window,. after an update you can start using other phenomenons.
Stay tuned. Follow us in ( FIG )

Crypto Market Change in BTC [Fingers]Crypto Market Change provides an indication of whether the value of a basket of 19 coins traded in BTC on Binance (as of July 12, 2018) are headed up or down. A simple moving average of the percentage change in BTC price for each coin is calculated. The moving averages are then summed and displayed. A measure of price volatility is indicated by standard deviation bands. Period, moving average length, and number of standard deviations are adjustable.

Crypto Market Change in BTC [Fingers]Crypto Market Change provides an indication of whether the value of a basket of 19 coins traded in BTC on Binance (as of July 12, 2018) are headed up or down. A simple moving average of the percentage change in BTC price for each coin is calculated. The moving averages are then summed and displayed. A measure of price volatility of indicated by standard deviation bands. Period, moving average length, and number of standard deviations are adjustable.

Crypto Market Change in USDT [Fingers]Crypto Market Change provides an indication of whether the value of a basket of 16 coins traded in USDT on Binance (as of July 12, 2018) are headed up or down. A simple moving average of the percentage change in USDT price for each coin is calculated. The moving averages are then summed and displayed. A measure of price volatility of indicated by standard deviation bands. Period, moving average length, and number of standard deviations are adjustable.

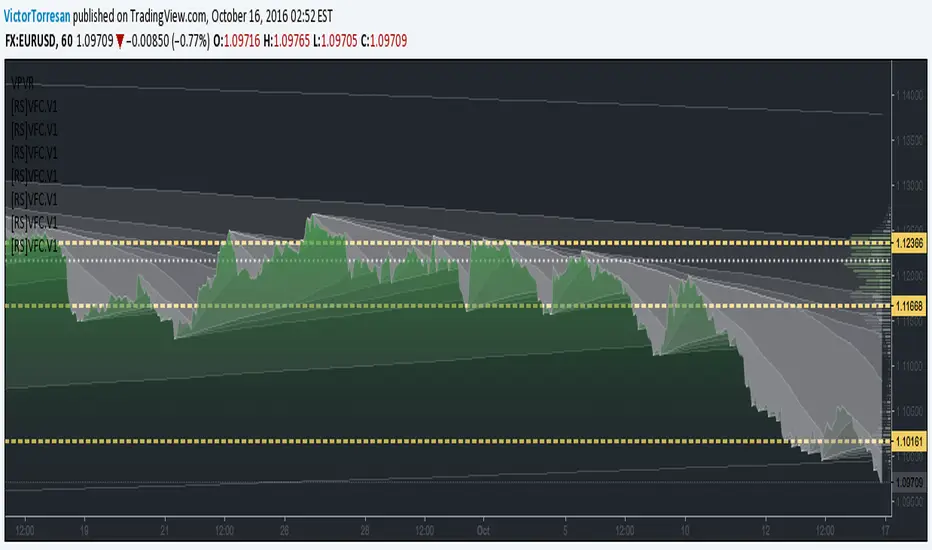
[RS]Market ProfileEXPERIMENTAL: this script is very crude and prone to errors..
Request for: FibTrader
instead of a POC line theres a POC area instead, since the script is checking a price area range for the frequency, its possible to average the values but this works as well.