cphelperLibrary "cphelper"
ACPU helper library - for private use. Not so meaningful for others.
calculate_rr(targetArray, rrArray, breakevenOnTarget1)
calculates risk reward for given targets
Parameters:
targetArray (float ) : array of targets
rrArray (float ) : array of risk reward
breakevenOnTarget1 (simple bool) : option to breakeven
Returns: array rrArray
trendPairs(l1StartX, l1StartY, l1EndX, l1EndY, l2StartX, l2StartY, l2EndX, l2EndY, zgColor)
creates trendline pairs
Parameters:
l1StartX (int) : startX of first line
l1StartY (float) : startY of first line
l1EndX (int) : endX of first line
l1EndY (float) : endY of first line
l2StartX (int) : startX of second line
l2StartY (float) : startY of second line
l2EndX (int) : endX of second line
l2EndY (float) : endY of second line
zgColor (color) : line color
Returns:
find_type(l1t, l2t, channelThreshold)
Finds type based on trendline pairs
Parameters:
l1t (line) : line1
l2t (line) : line2
channelThreshold (simple float) : theshold for channel identification
Returns: pattern type and flags
getFlags(flags)
Flatten flags
Parameters:
flags (bool ) : array of flags
Returns: - flattened flags isChannel, isTriangle, isWedge, isExpanding, isContracting, isFlat, isRising, isFalling
getType(typeNum)
Get type based on type number
Parameters:
typeNum (int) : number representing type
Returns: String value of type
getStatus(status, maxStatus)
Get status based on integer value representations
Parameters:
status (int) : integer representing current status
maxStatus (int) : integer representing max status
Returns: String status value
calculate_simple_targets(trendLines, settingsMatrix, patternTypeMapping, patternType)
Calculate targets based on trend lines
Parameters:
trendLines (line ) : trendline pair array
settingsMatrix (matrix) : matrix containing settings
patternTypeMapping (string ) : array containing pattern type mapping
patternType (int) : pattern type
Returns: arrays containing long and short calculated targets
recalculate_position(patternTypeAndStatusMatrix, targetMatrix, index, pIndex, status, maxStatus, targetValue, stopValue, dir, breakevenOnTarget1)
Recalculate position values
Parameters:
patternTypeAndStatusMatrix (matrix) : matrix containing pattern type and status
targetMatrix (matrix) : matrix containing targets
index (int) : current index
pIndex (int) : pattern index
status (int) : current status
maxStatus (int) : max status reached
targetValue (float) : current target value
stopValue (float) : current stop value
dir (int) : direction
breakevenOnTarget1 (simple bool) : flag to breakeven upon target1
Returns: new status and maxStatus values
draw_targets(longTargets, shortTargets, index, labelColor, patternName, positionIndex, longMaxStatus, longStatus, shortMaxStatus, shortStatus, tempBoxes, tempLines, tempLabels)
Draw targets on chart
Parameters:
longTargets (matrix) : matrix containing long targets
shortTargets (matrix) : matrix containing short targets
index (int) : current index
labelColor (color) : color of lines and labels
patternName (string) : Pattern name
positionIndex (int) : position on the chart
longMaxStatus (int) : max status for long
longStatus (int) : long status value
shortMaxStatus (int) : max status for short
shortStatus (int) : short status value
tempBoxes (box ) : temporary box array
tempLines (line ) : temporary lines array
tempLabels (label ) : temporary labels array
Returns: void
populate_open_stats(patternIdArray, barMatrix, patternTypeAndStatusMatrix, patternColorArray, longTargets, shortTargets, patternRRMatrix, OpenStatPosition, lblSizeOpenTrades)
Populate open stats table
Parameters:
patternIdArray (int ) : pattern Ids
barMatrix (matrix) : matrix containing bars
patternTypeAndStatusMatrix (matrix) : matrix containing pattern type and status
patternColorArray (color ) : array containing current patter colors
longTargets (matrix) : matrix of long targets
shortTargets (matrix) : matrix of short targets
patternRRMatrix (matrix) : pattern risk reward matrix
OpenStatPosition (simple string) : table position
lblSizeOpenTrades (simple string) : text size
Returns: void
draw_pattern_label(trendLines, patternFlagMatrix, patternTypeAndStatusMatrix, patternColorArray, patternFlags, patternLabelArray, zgColor, patternType, drawLabel, clearOldPatterns, safeRepaint, maxPatternsReference)
Parameters:
trendLines (line )
patternFlagMatrix (matrix)
patternTypeAndStatusMatrix (matrix)
patternColorArray (color )
patternFlags (bool )
patternLabelArray (label )
zgColor (color)
patternType (int)
drawLabel (simple bool)
clearOldPatterns (simple bool)
safeRepaint (simple bool)
maxPatternsReference (simple int)
populate_closed_stats(patternTypeAndStatusMatrix, bullishCounts, bearishCounts, bullishRetouchCounts, bearishRetouchCounts, bullishSizeMatrix, bearishSizeMatrix, bullishRR, bearishRR, ClosedStatsPosition, lblSizeClosedTrades, showSelectivePatternStats, showPatternStats, showStatsInPercentage)
Parameters:
patternTypeAndStatusMatrix (matrix)
bullishCounts (matrix)
bearishCounts (matrix)
bullishRetouchCounts (matrix)
bearishRetouchCounts (matrix)
bullishSizeMatrix (matrix)
bearishSizeMatrix (matrix)
bullishRR (matrix)
bearishRR (matrix)
ClosedStatsPosition (simple string)
lblSizeClosedTrades (simple string)
showSelectivePatternStats (simple bool)
showPatternStats (simple bool)
showStatsInPercentage (simple bool)
Piyasa Geometrisi
Vector3Library "Vector3"
Representation of 3D vectors and points.
This structure is used to pass 3D positions and directions around. It also contains functions for doing common vector operations.
Besides the functions listed below, other classes can be used to manipulate vectors and points as well.
For example the Quaternion and the Matrix4x4 classes are useful for rotating or transforming vectors and points.
___
**Reference:**
- github.com
- github.com
- github.com
- www.movable-type.co.uk
- docs.unity3d.com
- referencesource.microsoft.com
- github.com
\
new(x, y, z)
Create a new `Vector3`.
Parameters:
x (float) : `float` Property `x` value, (optional, default=na).
y (float) : `float` Property `y` value, (optional, default=na).
z (float) : `float` Property `z` value, (optional, default=na).
Returns: `Vector3` Generated new vector.
___
**Usage:**
```
.new(1.1, 1, 1)
```
from(value)
Create a new `Vector3` from a single value.
Parameters:
value (float) : `float` Properties positional value, (optional, default=na).
Returns: `Vector3` Generated new vector.
___
**Usage:**
```
.from(1.1)
```
from_Array(values, fill_na)
Create a new `Vector3` from a list of values, only reads up to the third item.
Parameters:
values (float ) : `array` Vector property values.
fill_na (float) : `float` Parameter value to replace missing indexes, (optional, defualt=na).
Returns: `Vector3` Generated new vector.
___
**Notes:**
- Supports any size of array, fills non available fields with `na`.
___
**Usage:**
```
.from_Array(array.from(1.1, fill_na=33))
.from_Array(array.from(1.1, 2, 3))
```
from_Vector2(values)
Create a new `Vector3` from a `Vector2`.
Parameters:
values (Vector2 type from RicardoSantos/CommonTypesMath/1) : `Vector2` Vector property values.
Returns: `Vector3` Generated new vector.
___
**Usage:**
```
.from:Vector2(.Vector2.new(1, 2.0))
```
___
**Notes:**
- Type `Vector2` from CommonTypesMath library.
from_Quaternion(values)
Create a new `Vector3` from a `Quaternion`'s `x, y, z` properties.
Parameters:
values (Quaternion type from RicardoSantos/CommonTypesMath/1) : `Quaternion` Vector property values.
Returns: `Vector3` Generated new vector.
___
**Usage:**
```
.from_Quaternion(.Quaternion.new(1, 2, 3, 4))
```
___
**Notes:**
- Type `Quaternion` from CommonTypesMath library.
from_String(expression, separator, fill_na)
Create a new `Vector3` from a list of values in a formated string.
Parameters:
expression (string) : `array` String with the list of vector properties.
separator (string) : `string` Separator between entries, (optional, default=`","`).
fill_na (float) : `float` Parameter value to replace missing indexes, (optional, defualt=na).
Returns: `Vector3` Generated new vector.
___
**Notes:**
- Supports any size of array, fills non available fields with `na`.
- `",,"` Empty fields will be ignored.
___
**Usage:**
```
.from_String("1.1", fill_na=33))
.from_String("(1.1,, 3)") // 1.1 , 3.0, NaN // empty field will be ignored!!
```
back()
Create a new `Vector3` object in the form `(0, 0, -1)`.
Returns: `Vector3` Generated new vector.
___
**Usage:**
```
.back()
```
front()
Create a new `Vector3` object in the form `(0, 0, 1)`.
Returns: `Vector3` Generated new vector.
___
**Usage:**
```
.front()
```
up()
Create a new `Vector3` object in the form `(0, 1, 0)`.
Returns: `Vector3` Generated new vector.
___
**Usage:**
```
.up()
```
down()
Create a new `Vector3` object in the form `(0, -1, 0)`.
Returns: `Vector3` Generated new vector.
___
**Usage:**
```
.down()
```
left()
Create a new `Vector3` object in the form `(-1, 0, 0)`.
Returns: `Vector3` Generated new vector.
___
**Usage:**
```
.left()
```
right()
Create a new `Vector3` object in the form `(1, 0, 0)`.
Returns: `Vector3` Generated new vector.
___
**Usage:**
```
.right()
```
zero()
Create a new `Vector3` object in the form `(0, 0, 0)`.
Returns: `Vector3` Generated new vector.
___
**Usage:**
```
.zero()
```
one()
Create a new `Vector3` object in the form `(1, 1, 1)`.
Returns: `Vector3` Generated new vector.
___
**Usage:**
```
.one()
```
minus_one()
Create a new `Vector3` object in the form `(-1, -1, -1)`.
Returns: `Vector3` Generated new vector.
___
**Usage:**
```
.minus_one()
```
unit_x()
Create a new `Vector3` object in the form `(1, 0, 0)`.
Returns: `Vector3` Generated new vector.
___
**Usage:**
```
.unit_x()
```
unit_y()
Create a new `Vector3` object in the form `(0, 1, 0)`.
Returns: `Vector3` Generated new vector.
___
**Usage:**
```
.unit_y()
```
unit_z()
Create a new `Vector3` object in the form `(0, 0, 1)`.
Returns: `Vector3` Generated new vector.
___
**Usage:**
```
.unit_z()
```
nan()
Create a new `Vector3` object in the form `(na, na, na)`.
Returns: `Vector3` Generated new vector.
___
**Usage:**
```
.nan()
```
random(max, min)
Generate a vector with random properties.
Parameters:
max (Vector3 type from RicardoSantos/CommonTypesMath/1) : `Vector3` Maximum defined range of the vector properties.
min (Vector3 type from RicardoSantos/CommonTypesMath/1) : `Vector3` Minimum defined range of the vector properties.
Returns: `Vector3` Generated new vector.
___
**Usage:**
```
.random(.from(math.pi), .from(-math.pi))
```
random(max)
Generate a vector with random properties (min set to 0.0).
Parameters:
max (Vector3 type from RicardoSantos/CommonTypesMath/1) : `Vector3` Maximum defined range of the vector properties.
Returns: `Vector3` Generated new vector.
___
**Usage:**
```
.random(.from(math.pi))
```
method copy(this)
Copy a existing `Vector3`
Namespace types: TMath.Vector3
Parameters:
this (Vector3 type from RicardoSantos/CommonTypesMath/1) : `Vector3` Source vector.
Returns: `Vector3` Generated new vector.
___
**Usage:**
```
a = .one().copy()
```
method i_add(this, other)
Modify a instance of a vector by adding a vector to it.
Namespace types: TMath.Vector3
Parameters:
this (Vector3 type from RicardoSantos/CommonTypesMath/1) : `Vector3` Source vector.
other (Vector3 type from RicardoSantos/CommonTypesMath/1) : `Vector3` Other Vector.
Returns: `Vector3` Updated source vector.
___
**Usage:**
```
a = .from(1) , a.i_add(.up())
```
method i_add(this, value)
Modify a instance of a vector by adding a vector to it.
Namespace types: TMath.Vector3
Parameters:
this (Vector3 type from RicardoSantos/CommonTypesMath/1) : `Vector3` Source vector.
value (float) : `float` Value.
Returns: `Vector3` Updated source vector.
___
**Usage:**
```
a = .from(1) , a.i_add(3.2)
```
method i_subtract(this, other)
Modify a instance of a vector by subtracting a vector to it.
Namespace types: TMath.Vector3
Parameters:
this (Vector3 type from RicardoSantos/CommonTypesMath/1) : `Vector3` Source vector.
other (Vector3 type from RicardoSantos/CommonTypesMath/1) : `Vector3` Other Vector.
Returns: `Vector3` Updated source vector.
___
**Usage:**
```
a = .from(1) , a.i_subtract(.down())
```
method i_subtract(this, value)
Modify a instance of a vector by subtracting a vector to it.
Namespace types: TMath.Vector3
Parameters:
this (Vector3 type from RicardoSantos/CommonTypesMath/1) : `Vector3` Source vector.
value (float) : `float` Value.
Returns: `Vector3` Updated source vector.
___
**Usage:**
```
a = .from(1) , a.i_subtract(3)
```
method i_multiply(this, other)
Modify a instance of a vector by multiplying a vector with it.
Namespace types: TMath.Vector3
Parameters:
this (Vector3 type from RicardoSantos/CommonTypesMath/1) : `Vector3` Source vector.
other (Vector3 type from RicardoSantos/CommonTypesMath/1) : `Vector3` Other Vector.
Returns: `Vector3` Updated source vector.
___
**Usage:**
```
a = .from(1) , a.i_multiply(.left())
```
method i_multiply(this, value)
Modify a instance of a vector by multiplying a vector with it.
Namespace types: TMath.Vector3
Parameters:
this (Vector3 type from RicardoSantos/CommonTypesMath/1) : `Vector3` Source vector.
value (float) : `float` value.
Returns: `Vector3` Updated source vector.
___
**Usage:**
```
a = .from(1) , a.i_multiply(3)
```
method i_divide(this, other)
Modify a instance of a vector by dividing it by another vector.
Namespace types: TMath.Vector3
Parameters:
this (Vector3 type from RicardoSantos/CommonTypesMath/1) : `Vector3` Source vector.
other (Vector3 type from RicardoSantos/CommonTypesMath/1) : `Vector3` Other Vector.
Returns: `Vector3` Updated source vector.
___
**Usage:**
```
a = .from(1) , a.i_divide(.forward())
```
method i_divide(this, value)
Modify a instance of a vector by dividing it by another vector.
Namespace types: TMath.Vector3
Parameters:
this (Vector3 type from RicardoSantos/CommonTypesMath/1) : `Vector3` Source vector.
value (float) : `float` Value.
Returns: `Vector3` Updated source vector.
___
**Usage:**
```
a = .from(1) , a.i_divide(3)
```
method i_mod(this, other)
Modify a instance of a vector by modulo assignment with another vector.
Namespace types: TMath.Vector3
Parameters:
this (Vector3 type from RicardoSantos/CommonTypesMath/1) : `Vector3` Source vector.
other (Vector3 type from RicardoSantos/CommonTypesMath/1) : `Vector3` Other Vector.
Returns: `Vector3` Updated source vector.
___
**Usage:**
```
a = .from(1) , a.i_mod(.back())
```
method i_mod(this, value)
Modify a instance of a vector by modulo assignment with another vector.
Namespace types: TMath.Vector3
Parameters:
this (Vector3 type from RicardoSantos/CommonTypesMath/1) : `Vector3` Source vector.
value (float) : `float` Value.
Returns: `Vector3` Updated source vector.
___
**Usage:**
```
a = .from(1) , a.i_mod(3)
```
method i_pow(this, exponent)
Modify a instance of a vector by modulo assignment with another vector.
Namespace types: TMath.Vector3
Parameters:
this (Vector3 type from RicardoSantos/CommonTypesMath/1) : `Vector3` Source vector.
exponent (Vector3 type from RicardoSantos/CommonTypesMath/1) : `Vector3` Exponent Vector.
Returns: `Vector3` Updated source vector.
___
**Usage:**
```
a = .from(1) , a.i_pow(.up())
```
method i_pow(this, exponent)
Modify a instance of a vector by modulo assignment with another vector.
Namespace types: TMath.Vector3
Parameters:
this (Vector3 type from RicardoSantos/CommonTypesMath/1) : `Vector3` Source vector.
exponent (float) : `float` Exponent Value.
Returns: `Vector3` Updated source vector.
___
**Usage:**
```
a = .from(1) , a.i_pow(2)
```
method length_squared(this)
Squared length of the vector.
Namespace types: TMath.Vector3
Parameters:
this (Vector3 type from RicardoSantos/CommonTypesMath/1)
Returns: `float` The squared length of this vector.
___
**Usage:**
```
a = .one().length_squared()
```
method magnitude_squared(this)
Squared magnitude of the vector.
Namespace types: TMath.Vector3
Parameters:
this (Vector3 type from RicardoSantos/CommonTypesMath/1) : `Vector3` Source vector.
Returns: `float` The length squared of this vector.
___
**Usage:**
```
a = .one().magnitude_squared()
```
method length(this)
Length of the vector.
Namespace types: TMath.Vector3
Parameters:
this (Vector3 type from RicardoSantos/CommonTypesMath/1) : `Vector3` Source vector.
Returns: `float` The length of this vector.
___
**Usage:**
```
a = .one().length()
```
method magnitude(this)
Magnitude of the vector.
Namespace types: TMath.Vector3
Parameters:
this (Vector3 type from RicardoSantos/CommonTypesMath/1) : `Vector3` Source vector.
Returns: `float` The Length of this vector.
___
**Usage:**
```
a = .one().magnitude()
```
method normalize(this, magnitude, eps)
Normalize a vector with a magnitude of 1(optional).
Namespace types: TMath.Vector3
Parameters:
this (Vector3 type from RicardoSantos/CommonTypesMath/1) : `Vector3` Source vector.
magnitude (float) : `float` Value to manipulate the magnitude of normalization, (optional, default=1.0).
eps (float)
Returns: `Vector3` Generated new vector.
___
**Usage:**
```
a = .new(33, 50, 100).normalize() // (x=0.283, y=0.429, z=0.858)
a = .new(33, 50, 100).normalize(2) // (x=0.142, y=0.214, z=0.429)
```
method to_String(this, precision)
Converts source vector to a string format, in the form `"(x, y, z)"`.
Namespace types: TMath.Vector3
Parameters:
this (Vector3 type from RicardoSantos/CommonTypesMath/1) : `Vector3` Source vector.
precision (string) : `string` Precision format to apply to values (optional, default='').
Returns: `string` Formated string in a `"(x, y, z)"` format.
___
**Usage:**
```
a = .one().to_String("#.###")
```
method to_Array(this)
Converts source vector to a array format.
Namespace types: TMath.Vector3
Parameters:
this (Vector3 type from RicardoSantos/CommonTypesMath/1) : `Vector3` Source vector.
Returns: `array` List of the vector properties.
___
**Usage:**
```
a = .new(1, 2, 3).to_Array()
```
method to_Vector2(this)
Converts source vector to a Vector2 in the form `x, y`.
Namespace types: TMath.Vector3
Parameters:
this (Vector3 type from RicardoSantos/CommonTypesMath/1) : `Vector3` Source vector.
Returns: `Vector2` Generated new vector.
___
**Usage:**
```
a = .from(1).to_Vector2()
```
method to_Quaternion(this, w)
Converts source vector to a Quaternion in the form `x, y, z, w`.
Namespace types: TMath.Vector3
Parameters:
this (Vector3 type from RicardoSantos/CommonTypesMath/1) : `Vector3` Sorce vector.
w (float) : `float` Property of `w` new value.
Returns: `Quaternion` Generated new vector.
___
**Usage:**
```
a = .from(1).to_Quaternion(w=1)
```
method add(this, other)
Add a vector to source vector.
Namespace types: TMath.Vector3
Parameters:
this (Vector3 type from RicardoSantos/CommonTypesMath/1) : `Vector3` Source vector.
other (Vector3 type from RicardoSantos/CommonTypesMath/1) : `Vector3` Other vector.
Returns: `Vector3` Generated new vector.
___
**Usage:**
```
a = .from(1).add(.unit_z())
```
method add(this, value)
Add a value to each property of the vector.
Namespace types: TMath.Vector3
Parameters:
this (Vector3 type from RicardoSantos/CommonTypesMath/1) : `Vector3` Source vector.
value (float) : `float` Value.
Returns: `Vector3` Generated new vector.
___
**Usage:**
```
a = .from(1).add(2.0)
```
add(value, other)
Add each property of a vector to a base value as a new vector.
Parameters:
value (float) : `float` Value.
other (Vector3 type from RicardoSantos/CommonTypesMath/1) : `Vector3` Vector.
Returns: `Vector3` Generated new vector.
___
**Usage:**
```
a = .from(2) , b = .add(1.0, a)
```
method subtract(this, other)
Subtract vector from source vector.
Namespace types: TMath.Vector3
Parameters:
this (Vector3 type from RicardoSantos/CommonTypesMath/1) : `Vector3` Source vector.
other (Vector3 type from RicardoSantos/CommonTypesMath/1) : `Vector3` Other vector.
Returns: `Vector3` Generated new vector.
___
**Usage:**
```
a = .from(1).subtract(.left())
```
method subtract(this, value)
Subtract a value from each property in source vector.
Namespace types: TMath.Vector3
Parameters:
this (Vector3 type from RicardoSantos/CommonTypesMath/1) : `Vector3` Source vector.
value (float) : `float` Value.
Returns: `Vector3` Generated new vector.
___
**Usage:**
```
a = .from(1).subtract(2.0)
```
subtract(value, other)
Subtract each property in a vector from a base value and create a new vector.
Parameters:
value (float) : `float` Value.
other (Vector3 type from RicardoSantos/CommonTypesMath/1) : `Vector3` Vector.
Returns: `Vector3` Generated new vector.
___
**Usage:**
```
a = .subtract(1.0, .right())
```
method multiply(this, other)
Multiply a vector by another.
Namespace types: TMath.Vector3
Parameters:
this (Vector3 type from RicardoSantos/CommonTypesMath/1) : `Vector3` Source vector.
other (Vector3 type from RicardoSantos/CommonTypesMath/1) : `Vector3` Other vector.
Returns: `Vector3` Generated new vector.
___
**Usage:**
```
a = .from(1).multiply(.up())
```
method multiply(this, value)
Multiply each element in source vector with a value.
Namespace types: TMath.Vector3
Parameters:
this (Vector3 type from RicardoSantos/CommonTypesMath/1) : `Vector3` Source vector.
value (float) : `float` Value.
Returns: `Vector3` Generated new vector.
___
**Usage:**
```
a = .from(1).multiply(2.0)
```
multiply(value, other)
Multiply a value with each property in a vector and create a new vector.
Parameters:
value (float) : `float` Value.
other (Vector3 type from RicardoSantos/CommonTypesMath/1) : `Vector3` Vector.
Returns: `Vector3` Generated new vector.
___
**Usage:**
```
a = .multiply(1.0, .new(1, 2, 1))
```
method divide(this, other)
Divide a vector by another.
Namespace types: TMath.Vector3
Parameters:
this (Vector3 type from RicardoSantos/CommonTypesMath/1) : `Vector3` Source vector.
other (Vector3 type from RicardoSantos/CommonTypesMath/1) : `Vector3` Other vector.
Returns: `Vector3` Generated new vector.
___
**Usage:**
```
a = .from(1).divide(.from(2))
```
method divide(this, value)
Divide each property in a vector by a value.
Namespace types: TMath.Vector3
Parameters:
this (Vector3 type from RicardoSantos/CommonTypesMath/1) : `Vector3` Source vector.
value (float) : `float` Value.
Returns: `Vector3` Generated new vector.
___
**Usage:**
```
a = .from(1).divide(2.0)
```
divide(value, other)
Divide a base value by each property in a vector and create a new vector.
Parameters:
value (float) : `float` Value.
other (Vector3 type from RicardoSantos/CommonTypesMath/1) : `Vector3` Vector.
Returns: `Vector3` Generated new vector.
___
**Usage:**
```
a = .divide(1.0, .from(2))
```
method mod(this, other)
Modulo a vector by another.
Namespace types: TMath.Vector3
Parameters:
this (Vector3 type from RicardoSantos/CommonTypesMath/1) : `Vector3` Source vector.
other (Vector3 type from RicardoSantos/CommonTypesMath/1) : `Vector3` Other vector.
Returns: `Vector3` Generated new vector.
___
**Usage:**
```
a = .from(1).mod(.from(2))
```
method mod(this, value)
Modulo each property in a vector by a value.
Namespace types: TMath.Vector3
Parameters:
this (Vector3 type from RicardoSantos/CommonTypesMath/1) : `Vector3` Source vector.
value (float) : `float` Value.
Returns: `Vector3` Generated new vector.
___
**Usage:**
```
a = .from(1).mod(2.0)
```
mod(value, other)
Modulo a base value by each property in a vector and create a new vector.
Parameters:
value (float) : `float` Value.
other (Vector3 type from RicardoSantos/CommonTypesMath/1) : `Vector3` Vector.
Returns: `Vector3` Generated new vector.
___
**Usage:**
```
a = .mod(1.0, .from(2))
```
method negate(this)
Negate a vector in the form `(zero - this)`.
Namespace types: TMath.Vector3
Parameters:
this (Vector3 type from RicardoSantos/CommonTypesMath/1) : `Vector3` Source vector.
Returns: `Vector3` Generated new vector.
___
**Usage:**
```
a = .one().negate()
```
method pow(this, other)
Modulo a vector by another.
Namespace types: TMath.Vector3
Parameters:
this (Vector3 type from RicardoSantos/CommonTypesMath/1) : `Vector3` Source vector.
other (Vector3 type from RicardoSantos/CommonTypesMath/1) : `Vector3` Other vector.
Returns: `Vector3` Generated new vector.
___
**Usage:**
```
a = .from(2).pow(.from(3))
```
method pow(this, exponent)
Raise the vector elements by a exponent.
Namespace types: TMath.Vector3
Parameters:
this (Vector3 type from RicardoSantos/CommonTypesMath/1) : `Vector3` Source vector.
exponent (float) : `float` The exponent to raise the vector by.
Returns: `Vector3` Generated new vector.
___
**Usage:**
```
a = .from(1).pow(2.0)
```
pow(value, exponent)
Raise value into a vector raised by the elements in exponent vector.
Parameters:
value (float) : `float` Base value.
exponent (Vector3 type from RicardoSantos/CommonTypesMath/1) : `Vector3` The exponent to raise the vector of base value by.
Returns: `Vector3` Generated new vector.
___
**Usage:**
```
a = .pow(1.0, .from(2))
```
method sqrt(this)
Square root of the elements in a vector.
Namespace types: TMath.Vector3
Parameters:
this (Vector3 type from RicardoSantos/CommonTypesMath/1) : `Vector3` Source vector.
Returns: `Vector3` Generated new vector.
___
**Usage:**
```
a = .from(1).sqrt()
```
method abs(this)
Absolute properties of the vector.
Namespace types: TMath.Vector3
Parameters:
this (Vector3 type from RicardoSantos/CommonTypesMath/1) : `Vector3` Source vector.
Returns: `Vector3` Generated new vector.
___
**Usage:**
```
a = .from(1).abs()
```
method max(this)
Highest property of the vector.
Namespace types: TMath.Vector3
Parameters:
this (Vector3 type from RicardoSantos/CommonTypesMath/1) : `Vector3` Source vector.
Returns: `float` Highest value amongst the vector properties.
___
**Usage:**
```
a = .new(1, 2, 3).max()
```
method min(this)
Lowest element of the vector.
Namespace types: TMath.Vector3
Parameters:
this (Vector3 type from RicardoSantos/CommonTypesMath/1) : `Vector3` Source vector.
Returns: `float` Lowest values amongst the vector properties.
___
**Usage:**
```
a = .new(1, 2, 3).min()
```
method floor(this)
Floor of vector a.
Namespace types: TMath.Vector3
Parameters:
this (Vector3 type from RicardoSantos/CommonTypesMath/1) : `Vector3` Source vector.
Returns: `Vector3` Generated new vector.
___
**Usage:**
```
a = .new(1.33, 1.66, 1.99).floor()
```
method ceil(this)
Ceil of vector a.
Namespace types: TMath.Vector3
Parameters:
this (Vector3 type from RicardoSantos/CommonTypesMath/1) : `Vector3` Source vector.
Returns: `Vector3` Generated new vector.
___
**Usage:**
```
a = .new(1.33, 1.66, 1.99).ceil()
```
method round(this)
Round of vector elements.
Namespace types: TMath.Vector3
Parameters:
this (Vector3 type from RicardoSantos/CommonTypesMath/1) : `Vector3` Source vector.
Returns: `Vector3` Generated new vector.
___
**Usage:**
```
a = .new(1.33, 1.66, 1.99).round()
```
method round(this, precision)
Round of vector elements to n digits.
Namespace types: TMath.Vector3
Parameters:
this (Vector3 type from RicardoSantos/CommonTypesMath/1) : `Vector3` Source vector.
precision (int) : `int` Number of digits to round the vector elements.
Returns: `Vector3` Generated new vector.
___
**Usage:**
```
a = .new(1.33, 1.66, 1.99).round(1) // 1.3, 1.7, 2
```
method fractional(this)
Fractional parts of vector.
Namespace types: TMath.Vector3
Parameters:
this (Vector3 type from RicardoSantos/CommonTypesMath/1) : `Vector3` Source vector.
Returns: `Vector3` Generated new vector.
___
**Usage:**
```
a = .from(1.337).fractional() // 0.337
```
method dot_product(this, other)
Dot product of two vectors.
Namespace types: TMath.Vector3
Parameters:
this (Vector3 type from RicardoSantos/CommonTypesMath/1) : `Vector3` Source vector.
other (Vector3 type from RicardoSantos/CommonTypesMath/1) : `Vector3` Other vector.
Returns: `float` Dot product.
___
**Usage:**
```
a = .from(2).dot_product(.left())
```
method cross_product(this, other)
Cross product of two vectors.
Namespace types: TMath.Vector3
Parameters:
this (Vector3 type from RicardoSantos/CommonTypesMath/1) : `Vector3` Source vector.
other (Vector3 type from RicardoSantos/CommonTypesMath/1) : `Vector3` Other vector.
Returns: `Vector3` Generated new vector.
___
**Usage:**
```
a = .from(1).cross_produc(.right())
```
method scale(this, scalar)
Scale vector by a scalar value.
Namespace types: TMath.Vector3
Parameters:
this (Vector3 type from RicardoSantos/CommonTypesMath/1) : `Vector3` Source vector.
scalar (float) : `float` Value to scale the the vector by.
Returns: `Vector3` Generated new vector.
___
**Usage:**
```
a = .from(1).scale(2)
```
method rescale(this, magnitude)
Rescale a vector to a new magnitude.
Namespace types: TMath.Vector3
Parameters:
this (Vector3 type from RicardoSantos/CommonTypesMath/1) : `Vector3` Source vector.
magnitude (float) : `float` Value to manipulate the magnitude of normalization.
Returns: `Vector3` Generated new vector.
___
**Usage:**
```
a = .from(20).rescale(1)
```
method equals(this, other)
Compares two vectors.
Namespace types: TMath.Vector3
Parameters:
this (Vector3 type from RicardoSantos/CommonTypesMath/1) : `Vector3` Source vector.
other (Vector3 type from RicardoSantos/CommonTypesMath/1) : `Vector3` Other vector.
Returns: `Vector3` Generated new vector.
___
**Usage:**
```
a = .from(1).equals(.one())
```
method sin(this)
Sine of vector.
Namespace types: TMath.Vector3
Parameters:
this (Vector3 type from RicardoSantos/CommonTypesMath/1) : `Vector3` Source vector.
Returns: `Vector3` Generated new vector.
___
**Usage:**
```
a = .from(1).sin()
```
method cos(this)
Cosine of vector.
Namespace types: TMath.Vector3
Parameters:
this (Vector3 type from RicardoSantos/CommonTypesMath/1) : `Vector3` Source vector.
Returns: `Vector3` Generated new vector.
___
**Usage:**
```
a = .from(1).cos()
```
method tan(this)
Tangent of vector.
Namespace types: TMath.Vector3
Parameters:
this (Vector3 type from RicardoSantos/CommonTypesMath/1) : `Vector3` Source vector.
Returns: `Vector3` Generated new vector.
___
**Usage:**
```
a = .from(1).tan()
```
vmax(a, b)
Highest elements of the properties from two vectors.
Parameters:
a (Vector3 type from RicardoSantos/CommonTypesMath/1) : `Vector3` Vector.
b (Vector3 type from RicardoSantos/CommonTypesMath/1) : `Vector3` Vector.
Returns: `Vector3` Generated new vector.
___
**Usage:**
```
a = .vmax(.one(), .from(2))
```
vmax(a, b, c)
Highest elements of the properties from three vectors.
Parameters:
a (Vector3 type from RicardoSantos/CommonTypesMath/1) : `Vector3` Vector.
b (Vector3 type from RicardoSantos/CommonTypesMath/1) : `Vector3` Vector.
c (Vector3 type from RicardoSantos/CommonTypesMath/1) : `Vector3` Vector.
Returns: `Vector3` Generated new vector.
___
**Usage:**
```
a = .vmax(.new(0.1, 2.5, 3.4), .from(2), .from(3))
```
vmin(a, b)
Lowest elements of the properties from two vectors.
Parameters:
a (Vector3 type from RicardoSantos/CommonTypesMath/1) : `Vector3` Vector.
b (Vector3 type from RicardoSantos/CommonTypesMath/1) : `Vector3` Vector.
Returns: `Vector3` Generated new vector.
___
**Usage:**
```
a = .vmin(.one(), .from(2))
```
vmin(a, b, c)
Lowest elements of the properties from three vectors.
Parameters:
a (Vector3 type from RicardoSantos/CommonTypesMath/1) : `Vector3` Vector.
b (Vector3 type from RicardoSantos/CommonTypesMath/1) : `Vector3` Vector.
c (Vector3 type from RicardoSantos/CommonTypesMath/1) : `Vector3` Vector.
Returns: `Vector3` Generated new vector.
___
**Usage:**
```
a = .vmin(.one(), .from(2), .new(3.3, 2.2, 0.5))
```
distance(a, b)
Distance between vector `a` and `b`.
Parameters:
a (Vector3 type from RicardoSantos/CommonTypesMath/1) : `Vector3` Source vector.
b (Vector3 type from RicardoSantos/CommonTypesMath/1) : `Vector3` Target vector.
Returns: `Vector3` Generated new vector.
___
**Usage:**
```
a = distance(.from(3), .unit_z())
```
clamp(a, min, max)
Restrict a vector between a min and max vector.
Parameters:
a (Vector3 type from RicardoSantos/CommonTypesMath/1) : `Vector3` Source vector.
min (Vector3 type from RicardoSantos/CommonTypesMath/1) : `Vector3` Minimum boundary vector.
max (Vector3 type from RicardoSantos/CommonTypesMath/1) : `Vector3` Maximum boundary vector.
Returns: `Vector3` Generated new vector.
___
**Usage:**
```
a = .clamp(a=.new(2.9, 1.5, 3.9), min=.from(2), max=.new(2.5, 3.0, 3.5))
```
clamp_magnitude(a, radius)
Vector with its magnitude clamped to a radius.
Parameters:
a (Vector3 type from RicardoSantos/CommonTypesMath/1) : `Vector3` Source vector.object, vector with properties that should be restricted to a radius.
radius (float) : `float` Maximum radius to restrict magnitude of vector.
Returns: `Vector3` Generated new vector.
___
**Usage:**
```
a = .clamp_magnitude(.from(21), 7)
```
lerp_unclamped(a, b, rate)
`Unclamped` linearly interpolates between provided vectors by a rate.
Parameters:
a (Vector3 type from RicardoSantos/CommonTypesMath/1) : `Vector3` Source vector.
b (Vector3 type from RicardoSantos/CommonTypesMath/1) : `Vector3` Target vector.
rate (float) : `float` Rate of interpolation, range(0 > 1) where 0 == source vector and 1 == target vector.
Returns: `Vector3` Generated new vector.
___
**Usage:**
```
a = .lerp_unclamped(.from(1), .from(2), 1.2)
```
lerp(a, b, rate)
Linearly interpolates between provided vectors by a rate.
Parameters:
a (Vector3 type from RicardoSantos/CommonTypesMath/1) : `Vector3` Source vector.
b (Vector3 type from RicardoSantos/CommonTypesMath/1) : `Vector3` Target vector.
rate (float) : `float` Rate of interpolation, range(0 > 1) where 0 == source vector and 1 == target vector.
Returns: `Vector3` Generated new vector.
___
**Usage:**
```
a = lerp(.one(), .from(2), 0.2)
```
herp(start, start_tangent, end, end_tangent, rate)
Hermite curve interpolation between provided vectors.
Parameters:
start (Vector3 type from RicardoSantos/CommonTypesMath/1) : `Vector3` Start vector.
start_tangent (Vector3 type from RicardoSantos/CommonTypesMath/1) : `Vector3` Start vector tangent.
end (Vector3 type from RicardoSantos/CommonTypesMath/1) : `Vector3` End vector.
end_tangent (Vector3 type from RicardoSantos/CommonTypesMath/1) : `Vector3` End vector tangent.
rate (int) : `float` Rate of the movement from `start` to `end` to get position, should be range(0 > 1).
Returns: `Vector3` Generated new vector.
___
**Usage:**
```
s = .new(0, 0, 0) , st = .new(0, 1, 1)
e = .new(1, 2, 2) , et = .new(-1, -1, 3)
h = .herp(s, st, e, et, 0.3)
```
___
**Reference:** en.m.wikibooks.org
herp_2(a, b, rate)
Hermite curve interpolation between provided vectors.
Parameters:
a (Vector3 type from RicardoSantos/CommonTypesMath/1) : `Vector3` Source vector.
b (Vector3 type from RicardoSantos/CommonTypesMath/1) : `Vector3` Target vector.
rate (Vector3 type from RicardoSantos/CommonTypesMath/1) : `Vector3` Rate of the movement per component from `start` to `end` to get position, should be range(0 > 1).
Returns: `Vector3` Generated new vector.
___
**Usage:**
```
h = .herp_2(.one(), .new(0.1, 3, 2), 0.6)
```
noise(a)
3D Noise based on Morgan McGuire @morgan3d
Parameters:
a (Vector3 type from RicardoSantos/CommonTypesMath/1) : `Vector3` Source vector.
Returns: `Vector3` Generated new vector.
___
**Usage:**
```
a = noise(.one())
```
___
**Reference:**
- thebookofshaders.com
- www.shadertoy.com
rotate(a, axis, angle)
Rotate a vector around a axis.
Parameters:
a (Vector3 type from RicardoSantos/CommonTypesMath/1) : `Vector3` Source vector.
axis (string) : `string` The plane to rotate around, `option="x", "y", "z"`.
angle (float) : `float` Angle in radians.
Returns: `Vector3` Generated new vector.
___
**Usage:**
```
a = .rotate(.from(3), 'y', math.toradians(45.0))
```
rotate_x(a, angle)
Rotate a vector on a fixed `x`.
Parameters:
a (Vector3 type from RicardoSantos/CommonTypesMath/1) : `Vector3` Source vector.
angle (float) : `float` Angle in radians.
Returns: `Vector3` Generated new vector.
___
**Usage:**
```
a = .rotate_x(.from(3), math.toradians(90.0))
```
rotate_y(a, angle)
Rotate a vector on a fixed `y`.
Parameters:
a (Vector3 type from RicardoSantos/CommonTypesMath/1) : `Vector3` Source vector.
angle (float) : `float` Angle in radians.
Returns: `Vector3` Generated new vector.
___
**Usage:**
```
a = .rotate_y(.from(3), math.toradians(90.0))
```
rotate_yaw_pitch(a, yaw, pitch)
Rotate a vector by yaw and pitch values.
Parameters:
a (Vector3 type from RicardoSantos/CommonTypesMath/1) : `Vector3` Source vector.
yaw (float) : `float` Angle in radians.
pitch (float) : `float` Angle in radians.
Returns: `Vector3` Generated new vector.
___
**Usage:**
```
a = .rotate_yaw_pitch(.from(3), math.toradians(90.0), math.toradians(45.0))
```
project(a, normal, eps)
Project a vector off a plane defined by a normal.
Parameters:
a (Vector3 type from RicardoSantos/CommonTypesMath/1) : `Vector3` Source vector.
normal (Vector3 type from RicardoSantos/CommonTypesMath/1) : `Vector3` The normal of the surface being reflected off.
eps (float) : `float` Minimum resolution to void division by zero (default=0.000001).
Returns: `Vector3` Generated new vector.
___
**Usage:**
```
a = .project(.one(), .down())
```
project_on_plane(a, normal, eps)
Projects a vector onto a plane defined by a normal orthogonal to the plane.
Parameters:
a (Vector3 type from RicardoSantos/CommonTypesMath/1) : `Vector3` Source vector.
normal (Vector3 type from RicardoSantos/CommonTypesMath/1) : `Vector3` The normal of the surface being reflected off.
eps (float) : `float` Minimum resolution to void division by zero (default=0.000001).
Returns: `Vector3` Generated new vector.
___
**Usage:**
```
a = .project_on_plane(.one(), .left())
```
project_to_2d(a, camera_position, camera_target)
Project a vector onto a two dimensions plane.
Parameters:
a (Vector3 type from RicardoSantos/CommonTypesMath/1) : `Vector3` Source vector.
camera_position (Vector3 type from RicardoSantos/CommonTypesMath/1) : `Vector3` Camera position.
camera_target (Vector3 type from RicardoSantos/CommonTypesMath/1) : `Vector3` Camera target plane position.
Returns: `Vector2` Generated new vector.
___
**Usage:**
```
a = .project_to_2d(.one(), .new(2, 2, 3), .zero())
```
reflect(a, normal)
Reflects a vector off a plane defined by a normal.
Parameters:
a (Vector3 type from RicardoSantos/CommonTypesMath/1) : `Vector3` Source vector.
normal (Vector3 type from RicardoSantos/CommonTypesMath/1) : `Vector3` The normal of the surface being reflected off.
Returns: `Vector3` Generated new vector.
___
**Usage:**
```
a = .reflect(.one(), .right())
```
angle(a, b, eps)
Angle in degrees between two vectors.
Parameters:
a (Vector3 type from RicardoSantos/CommonTypesMath/1) : `Vector3` Source vector.
b (Vector3 type from RicardoSantos/CommonTypesMath/1) : `Vector3` Target vector.
eps (float) : `float` Minimum resolution to void division by zero (default=1.0e-15).
Returns: `float` Angle value in degrees.
___
**Usage:**
```
a = .angle(.one(), .up())
```
angle_signed(a, b, axis)
Signed angle in degrees between two vectors.
Parameters:
a (Vector3 type from RicardoSantos/CommonTypesMath/1) : `Vector3` Source vector.
b (Vector3 type from RicardoSantos/CommonTypesMath/1) : `Vector3` Target vector.
axis (Vector3 type from RicardoSantos/CommonTypesMath/1) : `Vector3` Axis vector.
Returns: `float` Angle value in degrees.
___
**Usage:**
```
a = .angle_signed(.one(), .left(), .down())
```
___
**Notes:**
- The smaller of the two possible angles between the two vectors is returned, therefore the result will never
be greater than 180 degrees or smaller than -180 degrees.
- If you imagine the from and to vectors as lines on a piece of paper, both originating from the same point,
then the /axis/ vector would point up out of the paper.
- The measured angle between the two vectors would be positive in a clockwise direction and negative in an
anti-clockwise direction.
___
**Reference:**
- github.com
angle2d(a, b)
2D angle between two vectors.
Parameters:
a (Vector3 type from RicardoSantos/CommonTypesMath/1) : `Vector3` Source vector.
b (Vector3 type from RicardoSantos/CommonTypesMath/1) : `Vector3` Target vector.
Returns: `float` Angle value in degrees.
___
**Usage:**
```
a = .angle2d(.one(), .left())
```
transform_Matrix(a, M)
Transforms a vector by the given matrix.
Parameters:
a (Vector3 type from RicardoSantos/CommonTypesMath/1) : `Vector3` Source vector.
M (matrix) : `matrix` A 4x4 matrix. The transformation matrix.
Returns: `Vector3` Generated new vector.
___
**Usage:**
```
mat = matrix.new(4, 0)
mat.add_row(0, array.from(0.0, 0.0, 0.0, 1.0))
mat.add_row(1, array.from(0.0, 0.0, 1.0, 0.0))
mat.add_row(2, array.from(0.0, 1.0, 0.0, 0.0))
mat.add_row(3, array.from(1.0, 0.0, 0.0, 0.0))
b = .transform_Matrix(.one(), mat)
```
transform_M44(a, M)
Transforms a vector by the given matrix.
Parameters:
a (Vector3 type from RicardoSantos/CommonTypesMath/1) : `Vector3` Source vector.
M (M44 type from RicardoSantos/CommonTypesMath/1) : `M44` A 4x4 matrix. The transformation matrix.
Returns: `Vector3` Generated new vector.
___
**Usage:**
```
a = .transform_M44(.one(), .M44.new(0,0,0,1,0,0,1,0,0,1,0,0,1,0,0,0))
```
___
**Notes:**
- Type `M44` from `CommonTypesMath` library.
transform_normal_Matrix(a, M)
Transforms a vector by the given matrix.
Parameters:
a (Vector3 type from RicardoSantos/CommonTypesMath/1) : `Vector3` Source vector.
M (matrix) : `matrix` A 4x4 matrix. The transformation matrix.
Returns: `Vector3` Generated new vector.
___
**Usage:**
```
mat = matrix.new(4, 0)
mat.add_row(0, array.from(0.0, 0.0, 0.0, 1.0))
mat.add_row(1, array.from(0.0, 0.0, 1.0, 0.0))
mat.add_row(2, array.from(0.0, 1.0, 0.0, 0.0))
mat.add_row(3, array.from(1.0, 0.0, 0.0, 0.0))
b = .transform_normal_Matrix(.one(), mat)
```
transform_normal_M44(a, M)
Transforms a vector by the given matrix.
Parameters:
a (Vector3 type from RicardoSantos/CommonTypesMath/1) : `Vector3` Source vector.
M (M44 type from RicardoSantos/CommonTypesMath/1) : `M44` A 4x4 matrix. The transformation matrix.
Returns: `Vector3` Generated new vector.
___
**Usage:**
```
a = .transform_normal_M44(.one(), .M44.new(0,0,0,1,0,0,1,0,0,1,0,0,1,0,0,0))
```
___
**Notes:**
- Type `M44` from `CommonTypesMath` library.
transform_Array(a, rotation)
Transforms a vector by the given Quaternion rotation value.
Parameters:
a (Vector3 type from RicardoSantos/CommonTypesMath/1) : `Vector3` Source vector. The source vector to be rotated.
rotation (float ) : `array` A 4 element array. Quaternion. The rotation to apply.
Returns: `Vector3` Generated new vector.
___
**Usage:**
```
a = .transform_Array(.one(), array.from(0.2, 0.2, 0.2, 1.0))
```
___
**Reference:**
- referencesource.microsoft.com
transform_Quaternion(a, rotation)
Transforms a vector by the given Quaternion rotation value.
Parameters:
a (Vector3 type from RicardoSantos/CommonTypesMath/1) : `Vector3` Source vector. The source vector to be rotated.
rotation (Quaternion type from RicardoSantos/CommonTypesMath/1) : `array` A 4 element array. Quaternion. The rotation to apply.
Returns: `Vector3` Generated new vector.
___
**Usage:**
```
a = .transform_Quaternion(.one(), .Quaternion.new(0.2, 0.2, 0.2, 1.0))
```
___
**Notes:**
- Type `Quaternion` from `CommonTypesMath` library.
___
**Reference:**
- referencesource.microsoft.com

Mad_StandardpartsLibrary "Mad_Standardparts"
This are my Standardparts used in upcoming scipts
roundTo(_value, _decimals)
Round a floating point value to a specified number of decimal places.
@description This function takes a floating point value and rounds it to a specified number of decimal places.
Parameters:
_value (float) : The floating point value to be rounded.
_decimals (int) : The number of decimal places to round to. Must be a non-negative integer.
Returns: The rounded value, as a floating point number.
clear_all()
Delete all drawings on the chart.
@description This function deletes all drawings on the chart, including lines, boxes, and labels.
Returns: None.
shifting(_value)
Create a string of spaces to shift text over by a specified amount.
@description This function takes an integer value and returns a string consisting of that many spaces, which can be used to shift text over in a PineScript chart.
Parameters:
_value (int) : The number of spaces to create in the output string.
Returns: A string consisting of the specified number of spaces.
fromLog(_value)
Convert a linear value to a logarithmic value.
@description This function takes a linear value and converts it to a logarithmic value, using the formula specified in the code.
Parameters:
_value (float)
Returns: The corresponding logarithmic value, as a floating point number.
toLog(_value)
Convert a logarithmic value to a linear value.
@description This function takes a logarithmic value and converts it to a linear value, using the formula specified in the code.
Parameters:
_value (float)
Returns: The corresponding linear value, as a floating point number.
f_getbartime()
Calculate the time per bar on the chart.
@description This function calculates the time per bar on the chart based on the first 100 bars.
Returns: The time per bar, as an integer value.

Spider_PlotIntroduction:
Spider charts, also known as radar charts or web charts, are a powerful data visualization tool that can display multiple variables in a circular format. They are particularly useful when you want to compare different data sets or evaluate the performance of a single data set across multiple dimensions. In this blog post, we will dive into the world of spider charts, explore their benefits, and demonstrate how you can create your own spider chart using the Spider_Plot library.
Why Spider Charts are Cool:
Spider charts have a unique visual appeal that sets them apart from other chart types. They allow you to display complex data in a compact, easy-to-understand format, making them perfect for situations where you need to convey a lot of information in a limited space. Some of the key benefits of spider charts include:
Multi-dimensional analysis: Spider charts can display multiple variables at once, making them ideal for analyzing relationships between different data sets or examining a single data set across multiple dimensions.
Easy comparison: By displaying data in a circular format, spider charts make it simple to compare different data points, identify trends, and spot potential issues.
Versatility: Spider charts can be used for a wide range of applications, from business and finance to sports and health. They are particularly useful for situations where you need to analyze performance or make comparisons between different entities.
Creating Your Own Spider Chart with the Spider_Plot Library:
The Spider_Plot library is a user-friendly, easy-to-use tool that allows you to create stunning spider charts with minimal effort. To get started, you'll need to import the Spider_Plot library:
import peacefulLizard50262/Spider_Plot/1
With the library imported, you can now create your own spider chart. The first step is to normalize your data. Normalizing ensures that all data points fall within the 0 to 1 range, which is important for creating a visually balanced spider chart.
The Spider_Plot library provides the data_normalize function to help you normalize your data. This function accepts several parameters, including the normalization style ("All Time", "Range", or "Custom"), length of the range, outlier level, lookback period for standard deviation, and minimum and maximum values for the "Custom" normalization style.
Once you have normalized your data, you can create an array of your data points using the array.from function. This array will be used as input for the draw_spider_plot function, which is responsible for drawing the spider plot on your chart.
The draw_spider_plot function accepts an array of float values (the normalized data points), an array of background colors for each sector, a color for the axes, and a scaling factor.
Example Usage:
Here's an example script that demonstrates how to create a spider chart using the Spider_Plot library:
oc = data_normalize(ta.ema(math.abs(open - close), 20), "Range", 20)
// Create an array of your data points
data = array.from(tr, rsi, stoch, dev, tr, oc, tr)
// Define colors for each sector
colors = array.from(color.new(color.red, 90), color.new(color.blue, 90), color.new(color.green, 90), color.new(color.orange, 90), color.new(color.purple, 90), color.new(color.purple, 90), color.new(color.purple, 90))
// Draw the spider plot on your chart
draw_spider_plot(data, colors, color.gray, 100)
In this example, we have first normalized six different data points (rsi, source, stoch, dev, tr, and oc) using the data_normalize function. Next, we create an array of these normalized data points and define an array of colors for each sector of the spider chart. Finally, we call the draw_spider_plot function to draw the spider chart on our chart.
Conclusion:
Spider charts are a versatile and visually appealing tool for analyzing and comparing multi-dimensional data. With the Spider_Plot library, you can easily create your own spider charts and unlock valuable insights from your data. Just remember to normalize your data and create an array of data points before calling the draw_spider_plot function. Happy charting!
Library "Spider_Plot"
data_normalize(data, style, length, outlier_level, dev_lookback, min, max)
data_normalize(data, string style, int length, float outlier_level, simple int dev_lookback, float min, float max)
Parameters:
data (float) : float , A float value to normalize.
style (string) : string , The normalization style: "All Time", "Range", or "Custom".
length (int) : int , The length of the range for "Range" normalization style.
outlier_level (float) : float , The outlier level to exclude from calculations.
dev_lookback (simple int) : int , The lookback period for calculating the standard deviation.
min (float) : float , The minimum value for the "Custom" normalization style.
max (float) : float , The maximum value for the "Custom" normalization style.
Returns: array , The normalized float value.
draw_spider_plot(values, bg_colors, axes_color, scale)
draw_spider_plot(array values, array bg_colors, color axes_color, float scale)
Parameters:
values (float ) : array , An array of float values to plot in the spider plot.
bg_colors (color ) : array , An array of background colors for each sector in the spider plot.
axes_color (color) : color , The color of the axes in the spider plot. Default: color.gray
scale (float) : float , A scaling factor for the spider plot. Default: 10
Returns: void , Draws the spider plot on the chart.

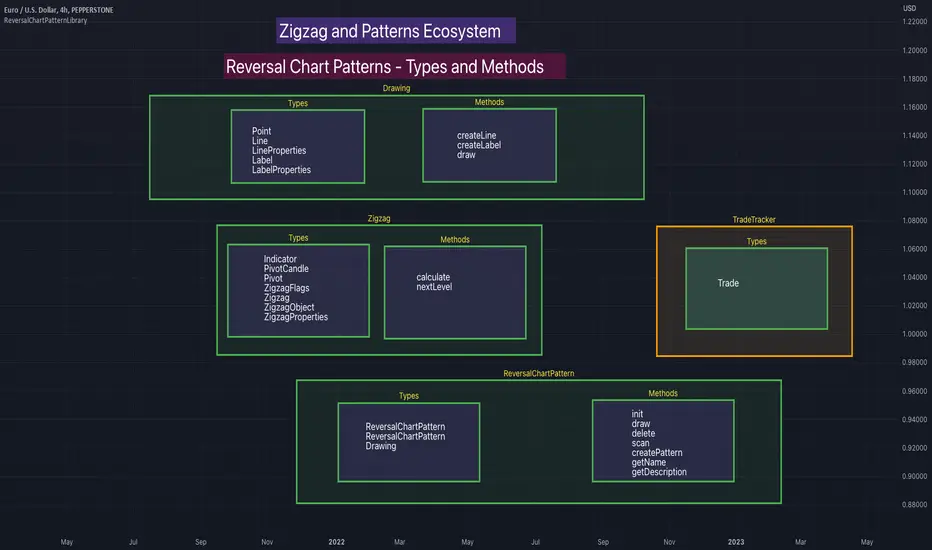
ReversalChartPatternLibraryLibrary "ReversalChartPatternLibrary"
User Defined Types and Methods for reversal chart patterns - Double Top, Double Bottom, Triple Top, Triple Bottom, Cup and Handle, Inverted Cup and Handle, Head and Shoulders, Inverse Head and Shoulders
method delete(this)
Deletes the drawing components of ReversalChartPatternDrawing object
Namespace types: ReversalChartPatternDrawing
Parameters:
this (ReversalChartPatternDrawing) : ReversalChartPatternDrawing object
Returns: current ReversalChartPatternDrawing object
method delete(this)
Deletes the drawing components of ReversalChartPattern object. In turn calls the delete of ReversalChartPatternDrawing
Namespace types: ReversalChartPattern
Parameters:
this (ReversalChartPattern) : ReversalChartPattern object
Returns: current ReversalChartPattern object
method lpush(this, obj, limit, deleteOld)
Array push with limited number of items in the array. Old items are deleted when new one comes and exceeds the limit
Namespace types: ReversalChartPattern
Parameters:
this (ReversalChartPattern ) : array object
obj (ReversalChartPattern) : ReversalChartPattern object which need to be pushed to the array
limit (int) : max items on the array. Default is 10
deleteOld (bool) : If set to true, also deletes the drawing objects. If not, the drawing objects are kept but the pattern object is removed from array. Default is false.
Returns: current ReversalChartPattern object
method draw(this)
Draws the components of ReversalChartPatternDrawing
Namespace types: ReversalChartPatternDrawing
Parameters:
this (ReversalChartPatternDrawing) : ReversalChartPatternDrawing object
Returns: current ReversalChartPatternDrawing object
method draw(this)
Draws the components of ReversalChartPatternDrawing within the ReversalChartPattern object.
Namespace types: ReversalChartPattern
Parameters:
this (ReversalChartPattern) : ReversalChartPattern object
Returns: current ReversalChartPattern object
method scan(zigzag, patterns, errorPercent, shoulderStart, shoulderEnd)
Scans zigzag for ReversalChartPattern occurences
Namespace types: zg.Zigzag
Parameters:
zigzag (Zigzag type from HeWhoMustNotBeNamed/ZigzagTypes/2) : ZigzagTypes.Zigzag object having array of zigzag pivots and other information on each pivots
patterns (ReversalChartPattern ) : Existing patterns array. Used for validating duplicates
errorPercent (float) : Error threshold for considering ratios. Default is 13
shoulderStart (float) : Starting range of shoulder ratio. Used for identifying shoulders, handles and necklines
shoulderEnd (float) : Ending range of shoulder ratio. Used for identifying shoulders, handles and necklines
Returns: int pattern type
method createPattern(zigzag, patternType, patternColor, riskAdjustment)
Create Pattern from ZigzagTypes.Zigzag object
Namespace types: zg.Zigzag
Parameters:
zigzag (Zigzag type from HeWhoMustNotBeNamed/ZigzagTypes/2) : ZigzagTypes.Zigzag object having array of zigzag pivots and other information on each pivots
patternType (int) : Type of pattern being created. 1 - Double Tap, 2 - Triple Tap, 3 - Cup and Handle, 4 - Head and Shoulders
patternColor (color) : Color in which the patterns are drawn
riskAdjustment (float) : Used for calculating stops
Returns: ReversalChartPattern object created
method getName(this)
get pattern name of ReversalChartPattern object
Namespace types: ReversalChartPattern
Parameters:
this (ReversalChartPattern) : ReversalChartPattern object
Returns: string name of the pattern
method getDescription(this)
get consolidated description of ReversalChartPattern object
Namespace types: ReversalChartPattern
Parameters:
this (ReversalChartPattern) : ReversalChartPattern object
Returns: string consolidated description
method init(this)
initializes the ReversalChartPattern object and creates sub object types
Namespace types: ReversalChartPattern
Parameters:
this (ReversalChartPattern) : ReversalChartPattern object
Returns: ReversalChartPattern current object
ReversalChartPatternDrawing
Type which holds the drawing objects for Reversal Chart Pattern Types
Fields:
patternLines (Line type from HeWhoMustNotBeNamed/DrawingTypes/1) : array of Line objects representing pattern
entry (Line type from HeWhoMustNotBeNamed/DrawingTypes/1) : Entry price Line
target (Line type from HeWhoMustNotBeNamed/DrawingTypes/1) : Target price Line
patternLabel (Label type from HeWhoMustNotBeNamed/DrawingTypes/1)
ReversalChartPattern
Reversal Chart Pattern master type which holds the pattern components, drawings and trade details
Fields:
pivots (Pivot type from HeWhoMustNotBeNamed/ZigzagTypes/2) : Array of Zigzag Pivots forming the pattern
patternType (series int) : Defines the main type of pattern 1 - Double Tap, 1 - Triple Tap, 3 - Cup and Handle, 4 - Head and Shoulders
patternColor (series color) : Color in which the pattern will be drawn on chart
riskAdjustment (series float) : Percentage adjustment of risk. Used for setting stops
drawing (ReversalChartPatternDrawing) : ReversalChartPatternDrawing object which holds the drawing components
trade (Trade type from HeWhoMustNotBeNamed/TradeTracker/1) : TradeTracker.Trade object holding trade components
ObjectHelpersLibrary "ObjectHelpers"
Line | Box | Label | Linefill -- Maker, Setter, Getter Library
TODO: add table functionality
set(object)
set all params for `line`, `box`, `label`, `linefill` objects with 1 function
***
## Overloaded
***
```
method set(line Line, int x1=na, float y1=na, int x2=na, float y2=na,string xloc=na,string extend=na,color color=na,string style=na,int width=na,bool update=na) => line
```
### Params
- **Line** `line` - line object | `required`
- **x1** `int` - value to set x1
- **y1** `float` - value to set y1
- **x2** `int` - value to set x2
- **y2** `float` - value to set y2
- **xloc** `int` - value to set xloc
- **yloc** `int` - value to set yloc
- **extend** `string` - value to set extend
- **color** `color` - value to set color
- **style** `string` - value to set style
- **width** `int` - value to set width
- **update** `bool` - value to set update
***
```
method set(box Box,int left=na,float top=na,int right=na, float bottom=na,color bgcolor=na,color border_color=na,string border_style=na,int border_width=na,string extend=na,string txt=na,color text_color=na,string text_font_family=na,string text_halign=na,string text_valign=na,string text_wrap=na,bool update=false) => box
```
### Params
- **Box** `box` - box object
- **left** `int` - value to set left
- **top** `float` - value to set top
- **right** `int` - value to set right
- **bottom** `float` - value to set bottom
- **bgcolor** `color` - value to set bgcolor
- **border_color** `color` - value to set border_color
- **border_style** `string` - value to set border_style
- **border_width** `int` - value to set border_width
- **extend** `string` - value to set extend
- **txt** `string` - value to set _text
- **text_color** `color` - value to set text_color
- **text_font_family** `string` - value to set text_font_family
- **text_halign** `string` - value to set text_halign
- **text_valign** `string` - value to set text_valign
- **text_wrap** `string` - value to set text_wrap
- **update** `bool` - value to set update
***
```
method set(label Label,int x=na,float y=na, string txt=na,string xloc=na,color color=na,color textcolor=na,string size=na,string style=na,string textalign=na,string tooltip=na,string text_font_family=na,bool update=false) => label
```
### Paramas
- **Label** `label` - label object
- **x** `int` - value to set x
- **y** `float` - value to set y
- **txt** `string` - value to set text add`"+++"` to the _text striing to have the current label text concatenated to the location of the "+++")
- **textcolor** `color` - value to set textcolor
- **size** `string` - value to set size
- **style** `string` - value to set style (use "flip" ,as the style to have label flip to top or bottom of bar depending on if open > close and vice versa)
- **text_font_family** `string` - value to set text_font_family
- **textalign** `string` - value to set textalign
- **tooltip** `string` - value to set tooltip
- **update** `bool` - update label to next bar
***
```
method set(linefill Linefill=na,line line1=na,line line2=na,color color=na) => linefill
```
### Params
- **linefill** `linefill` - linefill object
- **line1** `line` - line object
- **line2** `line` - line object
- **color** `color` - color
Parameters:
object (obj)
Returns: `line`, `box`, `label`, `linefill`
method set(Line, x1, y1, x2, y2, xloc, extend, color, style, width, update)
set the location params of a line with 1 function auto detects time or bar_index for xloc param
Namespace types: series line
Parameters:
Line (line) : `line` - line object | `required`
x1 (int) : `int` - value to set x1
y1 (float) : `float` - value to set y1
x2 (int) : `int` - value to set x2
y2 (float) : `float` - value to set y2
xloc (string) : `int` - value to set xloc
extend (string) : `string` - value to set extend
color (color) : `color` - value to set color
style (string) : `string` - value to set style
width (int) : `int` - value to set width
update (bool) : `bool` - value to set update
Returns: `line`
method set(Box, left, top, right, bottom, bgcolor, border_color, border_style, border_width, extend, txt, text_color, text_font_family, text_halign, text_valign, text_wrap, update)
set the location params of a box with 1 function
Namespace types: series box
Parameters:
Box (box) : `box` - box object | `required`
left (int) : `int` - value to set left
top (float) : `float` - value to set top
right (int) : `int` - value to set right
bottom (float) : `float` - value to set bottom
bgcolor (color) : `color` - value to set bgcolor
border_color (color) : `color` - value to set border_color
border_style (string) : `string` - value to set border_style
border_width (int) : `int` - value to set border_width
extend (string) : `string` - value to set extend
txt (string) : `string` - value to set _text
text_color (color) : `color` - value to set text_color
text_font_family (string) : `string` - value to set text_font_family
text_halign (string) : `string` - value to set text_halign
text_valign (string) : `string` - value to set text_valign
text_wrap (string) : `string` - value to set text_wrap
update (bool) : `bool` - value to set update
Returns: `box`
method set(Label, x, y, txt, xloc, color, textcolor, size, style, textalign, tooltip, text_font_family, update)
set the location params of a label with 1 function auto detects time or bar_index for xloc param
Namespace types: series label
Parameters:
Label (label) : `label` | `required`
x (int) : `int` - value to set x
y (float) : `float` - value to set y
txt (string) : `string` - value to set text add`"+++"` to the _text striing to have the current label text concatenated to the location of the "+++")
xloc (string)
color (color)
textcolor (color) : `color` - value to set textcolor
size (string) : `string` - value to set size
style (string) : `string` - value to set style (use "flip" ,as the style to have label flip to top or bottom of bar depending on if open > close and vice versa)
textalign (string) : `string` - value to set textalign
tooltip (string) : `string` - value to set tooltip
text_font_family (string) : `string` - value to set text_font_family
update (bool) : `bool` - update label to next bar
Returns: `label`
method set(Linefill, line1, line2, color)
change the 1 or 2 of the lines in a linefill object
Namespace types: series linefill
Parameters:
Linefill (linefill)
line1 (line) : `line` - line object
line2 (line) : `line` - line object
color (color) : `color` - color
Returns: `linefill`
get(object)
get all of the location variables for `line`, `box`, `label` objects or the line objects from a `linefill`
***
## Overloaded
***
```
method get(line Line) =>
```
### Params
- **Line** `line` - line object | `required`
***
```
method get(box Box) =>
```
### Params
- **Box** `box` - box object | `required`
***
```
method get(label Label) =>
```
### Paramas
- **Label** `label` - label object | `required`
***
```
method get(linefill Linefill) =>
```
### Params
- **Linefill** `linefill` - linefill object | `required`
Parameters:
object (obj)
Returns: ` `
method get(Line)
Gets the location paramaters of a Line
Namespace types: series line
Parameters:
Line (line) : `line` - line object
Returns:
method get(Box)
Gets the location paramaters of a Box
Namespace types: series box
Parameters:
Box (box) : `box` - box object
Returns:
method get(Label)
Gets the `x`, `y`, `text` of a Label
Namespace types: series label
Parameters:
Label (label) : `label` - label object
Returns:
method get(Linefill)
Gets `line 1`, `line 2` from a Linefill
Namespace types: series linefill
Parameters:
Linefill (linefill) : `linefill` - linefill object
Returns:
method set_x(Line, x1, x2)
set the `x1`, `x2` of a line
***
### Params
- **Line** `line` - line object | `required`
- **x1** `int` - value to set x1 | `required`
- **x2** `int` - value to set x2 | `required`
Namespace types: series line
Parameters:
Line (line) : `line` - line object
x1 (int) : `int` - value to set x1
x2 (int) : `int` - value to set x2
Returns: `line`
method set_y(Line, y1, y2)
set `y1`, `y2` of a line
***
### Params
- **Line** `line` - line object | `required`
- **y1** `float` - value to set y1 | `required`
- **y2** `float` - value to set y2 | `required`
Namespace types: series line
Parameters:
Line (line) : `line` - line object
y1 (float) : `float` - value to set y1
y2 (float) : `float` - value to set y2
Returns: `line`
method Line(x1, y1, x2, y2, extend, color, style, width)
Similar to `line.new()` but can detect time or bar_index for xloc param and has defaults for all params but `x1`, `y1`, `x2`, `y2`
***
### Params
- **x1** `int` - value to set
- **y1** `float` - value to set
- **x2** `int` - value to set
- **y2** `float` - value to set
- **extend** `string` - extend value to set line
- **color** `color` - color to set line
- **style** `string` - style to set line
- **width** `int` - width to set line
Namespace types: series int, simple int, input int, const int
Parameters:
x1 (int) : `int` - value to set
y1 (float) : `float` - value to set
x2 (int) : `int` - value to set
y2 (float) : `float` - value to set
extend (string) : `string` - extend value to set line
color (color) : `color` - color to set line
style (string) : `string` - style to set line
width (int) : `int` - width to set line
Returns: `line`
method Box(left, top, right, bottom, extend, border_color, bgcolor, text_color, border_width, border_style, txt, text_halign, text_valign, text_size, text_wrap)
similar to box.new() with the but can detect xloc param and has defaults for everything but location params
***
### Params
- **left** `int` - value to set
- **top** `float` - value to set
- **right** `int` - value to set
- **bottom** `float` - value to set
- **extend** `string` - extend value to set box
- **border_color** `color` - color to set border
- **bgcolor** `color` - color to set background
- **text_color** `color` - color to set text
- **border_width** `int` - width to set border
- **border_style** `string` - style to set border
- **txt** `string` - text to set
- **text_halign** `string` - horizontal alignment to set text
- **text_valign** `string` - vertical alignment to set text
- **text_size** `string` - size to set text
- **text_wrap** `string` - wrap to set text
Namespace types: series int, simple int, input int, const int
Parameters:
left (int) : `int` - value to set
top (float) : `float` - value to set
right (int) : `int` - value to set
bottom (float) : `float` - value to set
extend (string) : `string` - extend value to set box
border_color (color) : `color` - color to set border
bgcolor (color) : `color` - color to set background
text_color (color) : `color` - color to set text
border_width (int) : `int` - width to set border
border_style (string) : `string` - style to set border
txt (string) : `string` - text to set
text_halign (string) : `string` - horizontal alignment to set text
text_valign (string) : `string` - vertical alignment to set text
text_size (string) : `string` - size to set text
text_wrap (string) : `string` - wrap to set text
Returns: `box`
method Label(txt, x, y, yloc, color, textcolor, style, size, textalign, text_font_family, tooltip)
Similar to label.new() but can detect time or bar_index for xloc param and has defaults for all params but x, y, txt, tooltip
***
### Params
- **txt** `string` - string to set
- **x** `int` - value to set
- **y** `float` - value to set
- **yloc** `string` - y location to set
- **color** `color` - label color to set
- **textcolor** `color` - text color to set
- **style** `string` - style to set
- **size** `string` - size to set
- **textalign** `string` - text alignment to set
- **text_font_family** `string` - font family to set
- **tooltip** `string` - tooltip to set
Namespace types: series string, simple string, input string, const string
Parameters:
txt (string) : `string` - string to set
x (int) : `int` - value to set
y (float) : `float` - value to set
yloc (string) : `string` - y location to set
color (color) : `color` - label color to set
textcolor (color) : `color` - text color to set
style (string) : `string` - style to set
size (string) : `string` - size to set
textalign (string) : `string` - text alignment to set
text_font_family (string) : `string` - font family to set
tooltip (string) : `string` - tooltip to set
Returns: `label`
obj
Fields:
obj (series__string)
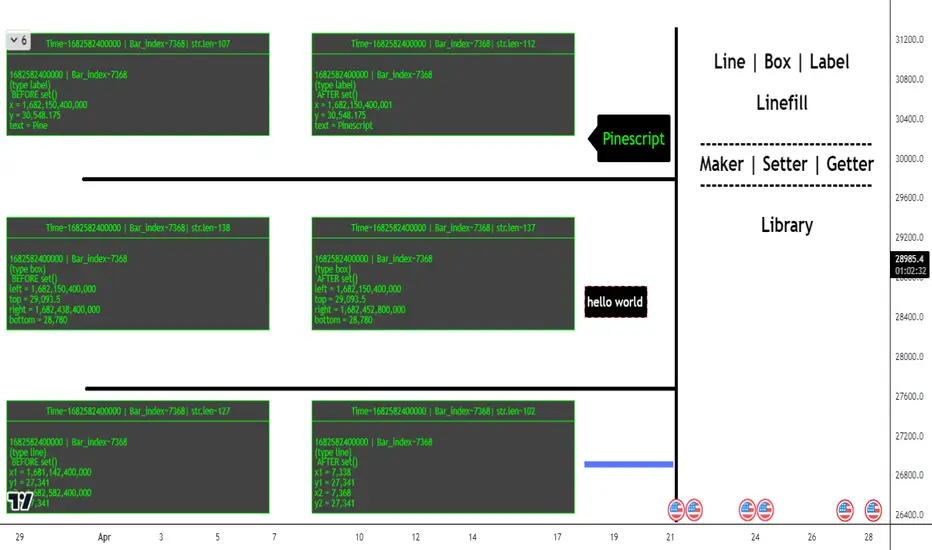
HarmonicPatternTrackingLibrary "HarmonicPatternTracking"
Library contains few data structures and methods for tracking harmonic pattern trades via pinescript.
method draw(this)
Creates and draws HarmonicDrawing object for given HarmonicPattern
Namespace types: HarmonicPattern
Parameters:
this (HarmonicPattern) : HarmonicPattern object
Returns: current HarmonicPattern object
method addTrade(this)
calculates HarmonicTrade and sets trade object for HarmonicPattern
Namespace types: HarmonicPattern
Parameters:
this (HarmonicPattern) : HarmonicPattern object
Returns: bool true if pattern trades are valid, false otherwise
method delete(this)
Deletes drawing objects of HarmonicDrawing
Namespace types: HarmonicDrawing
Parameters:
this (HarmonicDrawing) : HarmonicDrawing object
Returns: current HarmonicDrawing object
method delete(this)
Deletes drawings of harmonic pattern
Namespace types: HarmonicPattern
Parameters:
this (HarmonicPattern) : HarmonicPattern object
Returns: current HarmonicPattern object
HarmonicDrawing
Drawing objects of Harmonic Pattern
Fields:
xa (series line) : xa line
ab (series line) : ab line
bc (series line) : bc line
cd (series line) : cd line
xb (series line) : xb line
bd (series line) : bd line
ac (series line) : ac line
xd (series line) : xd line
x (series label) : label for pivot x
a (series label) : label for pivot a
b (series label) : label for pivot b
c (series label) : label for pivot c
d (series label) : label for pivot d
xabRatio (series label) : label for XAB Ratio
abcRatio (series label) : label for ABC Ratio
bcdRatio (series label) : label for BCD Ratio
xadRatio (series label) : label for XAD Ratio
HarmonicTrade
Trade tracking parameters of Harmonic Patterns
Fields:
initialEntry (series float) : initial entry when pattern first formed.
entry (series float) : trailed entry price.
initialStop (series float) : initial stop when trade first entered.
stop (series float) : current stop updated as per trailing rules.
target1 (series float) : First target value
target2 (series float) : Second target value
target3 (series float) : Third target value
target4 (series float) : Fourth target value
status (series int) : Trade status referenced as integer
retouch (series bool) : Flag to show if the price retouched after entry
HarmonicProperties
Display and trade calculation properties for Harmonic Patterns
Fields:
fillMajorTriangles (series bool) : Display property used for using linefill for harmonic major triangles
fillMinorTriangles (series bool) : Display property used for using linefill for harmonic minor triangles
majorFillTransparency (series int) : transparency setting for major triangles
minorFillTransparency (series int) : transparency setting for minor triangles
showXABCD (series bool) : Display XABCD pivot labels
lblSizePivots (series string) : Pivot label size
showRatios (series bool) : Display Ratio labels
useLogScaleForScan (series bool) : Use log scale to determine fib ratios for pattern scanning
useLogScaleForTargets (series bool) : Use log scale to determine fib ratios for target calculation
base (series string) : base on which calculation of stop/targets are made.
entryRatio (series float) : fib ratio to calculate entry
stopRatio (series float) : fib ratio to calculate initial stop
target1Ratio (series float) : fib ratio to calculate first target
target2Ratio (series float) : fib ratio to calculate second target
target3Ratio (series float) : fib ratio to calculate third target
target4Ratio (series float) : fib ratio to calculate fourth target
HarmonicPattern
Harmonic pattern object to track entire pattern trade life cycle
Fields:
id (series int) : Pattern Id
dir (series int) : pattern direction
x (series float) : X Pivot
a (series float) : A Pivot
b (series float) : B Pivot
c (series float) : C Pivot
d (series float) : D Pivot
xBar (series int) : Bar index of X Pivot
aBar (series int) : Bar index of A Pivot
bBar (series int) : Bar index of B Pivot
cBar (series int) : Bar index of C Pivot
dBar (series int) : Bar index of D Pivot
przStart (series float) : Start of PRZ range
przEnd (series float) : End of PRZ range
patterns (bool ) : array representing the patterns
patternLabel (series string) : string representation of list of patterns
patternColor (series color) : color assigned to pattern
properties (HarmonicProperties) : HarmonicProperties object containing display and calculation properties
trade (HarmonicTrade) : HarmonicTrade object to track trades
drawing (HarmonicDrawing) : HarmonicDrawing object to manage drawings
Parallel Projections [theEccentricTrader]█ OVERVIEW
This indicator automatically projects parallel trendlines or channels, from a single point of origin. In the example above I have applied the indicator twice to the 1D SPXUSD. The five upper lines (green) are projected at an angle of -5 from the 1-month swing high anchor point with a projection ratio of -72. And the seven lower lines (blue) are projected at an angle of 10 with a projection ratio of 36 from the 1-week swing low anchor point.
█ CONCEPTS
Green and Red Candles
• A green candle is one that closes with a high price equal to or above the price it opened.
• A red candle is one that closes with a low price that is lower than the price it opened.
Swing Highs and Swing Lows
• A swing high is a green candle or series of consecutive green candles followed by a single red candle to complete the swing and form the peak.
• A swing low is a red candle or series of consecutive red candles followed by a single green candle to complete the swing and form the trough.
Peak and Trough Prices (Basic)
• The peak price of a complete swing high is the high price of either the red candle that completes the swing high or the high price of the preceding green candle, depending on which is higher.
• The trough price of a complete swing low is the low price of either the green candle that completes the swing low or the low price of the preceding red candle, depending on which is lower.
Historic Peaks and Troughs
The current, or most recent, peak and trough occurrences are referred to as occurrence zero. Previous peak and trough occurrences are referred to as historic and ordered numerically from right to left, with the most recent historic peak and trough occurrences being occurrence one.
Support and Resistance
• Support refers to a price level where the demand for an asset is strong enough to prevent the price from falling further.
• Resistance refers to a price level where the supply of an asset is strong enough to prevent the price from rising further.
Support and resistance levels are important because they can help traders identify where the price of an asset might pause or reverse its direction, offering potential entry and exit points. For example, a trader might look to buy an asset when it approaches a support level , with the expectation that the price will bounce back up. Alternatively, a trader might look to sell an asset when it approaches a resistance level , with the expectation that the price will drop back down.
It's important to note that support and resistance levels are not always relevant, and the price of an asset can also break through these levels and continue moving in the same direction.
Trendlines
Trendlines are straight lines that are drawn between two or more points on a price chart. These lines are used as dynamic support and resistance levels for making strategic decisions and predictions about future price movements. For example traders will look for price movements along, and reactions to, trendlines in the form of rejections or breakouts/downs.
█ FEATURES
Inputs
• Anchor Point Type
• Swing High/Low Occurrence
• HTF Resolution
• Highest High/Lowest Low Lookback
• Angle Degree
• Projection Ratio
• Number Lines
• Line Color
Anchor Point Types
• Swing High
• Swing Low
• Swing High (HTF)
• Swing Low (HTF)
• Highest High
• Lowest Low
• Intraday Highest High (intraday charts only)
• Intraday Lowest Low (intraday charts only)
Swing High/Swing Low Occurrence
This input is used to determine which historic peak or trough to reference for swing high or swing low anchor point types.
HTF Resolution
This input is used to determine which higher timeframe to reference for swing high (HTF) or swing low (HTF) anchor point types.
Highest High/Lowest Low Lookback
This input is used to determine the lookback length for highest high or lowest low anchor point types.
Intraday Highest High/Lowest Low Lookback
When using intraday highest high or lowest low anchor point types, the lookback length is calculated automatically based on number of bars since the daily candle opened.
Angle Degree
This input is used to determine the angle of the trendlines. The output is expressed in terms of point or pips, depending on the symbol type, which is then passed through the built in math.todegrees() function. Positive numbers will project the lines upwards while negative numbers will project the lines downwards. Depending on the market and timeframe, the impact input values will have on the visible gaps between the lines will vary greatly. For example, an input of 10 will have a far greater impact on the gaps between the lines when viewed from the 1-minute timeframe than it would on the 1-day timeframe. The input is a float and as such the value passed through can go into as many decimal places as the user requires.
It is also worth mentioning that as more lines are added the gaps between the lines, that are closest to the anchor point, will get tighter as they make their way up the y-axis. Although the gaps between the lines will stay constant at the x2 plot, i.e. a distance of 10 points between them, they will gradually get tighter and tighter at the point of origin as the slope of the lines get steeper.
Projection Ratio
This input is used to determine the distance between the parallels, expressed in terms of point or pips. Positive numbers will project the lines upwards while negative numbers will project the lines downwards. Depending on the market and timeframe, the impact input values will have on the visible gaps between the lines will vary greatly. For example, an input of 10 will have a far greater impact on the gaps between the lines when viewed from the 1-minute timeframe than it would on the 1-day timeframe. The input is a float and as such the value passed through can go into as many decimal places as the user requires.
Number Lines
This input is used to determine the number of lines to be drawn on the chart, maximum is 500.
█ LIMITATIONS
All green and red candle calculations are based on differences between open and close prices, as such I have made no attempt to account for green candles that gap lower and close below the close price of the preceding candle, or red candles that gap higher and close above the close price of the preceding candle. This may cause some unexpected behaviour on some markets and timeframes. I can only recommend using 24-hour markets, if and where possible, as there are far fewer gaps and, generally, more data to work with.
If the lines do not draw or you see a study error saying that the script references too many candles in history, this is most likely because the higher timeframe anchor point is not present on the current timeframe. This problem usually occurs when referencing a higher timeframe, such as the 1-month, from a much lower timeframe, such as the 1-minute. How far you can lookback for higher timeframe anchor points on the current timeframe will also be limited by your Trading View subscription plan. Premium users get 20,000 candles worth of data, pro+ and pro users get 10,000, and basic users get 5,000.
█ RAMBLINGS
It is my current thesis that the indicator will work best when used in conjunction with my Wavemeter indicator, which can be used to set the angle and projection ratio. For example, the average wave height or amplitude could be used as the value for the angle and projection ratio inputs. Or some factor or multiple of such an average. I think this makes sense as it allows for objectivity when applying the indicator across different markets and timeframes with different energies and vibrations.
“If you want to find the secrets of the universe, think in terms of energy, frequency and vibration.”
― Nikola Tesla

Fan Projections [theEccentricTrader]█ OVERVIEW
This indicator automatically projects trendlines in the shape of a fan, from a single point of origin. In the example above I have applied the indicator twice to the 1D SPXUSD. The seven upper lines (green) are projected at an angle of -5 from the 1-month swing high anchor point. And the five lower lines (blue) are projected at an angle of 10 from the 1-week swing low anchor point.
█ CONCEPTS
Green and Red Candles
• A green candle is one that closes with a high price equal to or above the price it opened.
• A red candle is one that closes with a low price that is lower than the price it opened.
Swing Highs and Swing Lows
• A swing high is a green candle or series of consecutive green candles followed by a single red candle to complete the swing and form the peak.
• A swing low is a red candle or series of consecutive red candles followed by a single green candle to complete the swing and form the trough.
Peak and Trough Prices (Basic)
• The peak price of a complete swing high is the high price of either the red candle that completes the swing high or the high price of the preceding green candle, depending on which is higher.
• The trough price of a complete swing low is the low price of either the green candle that completes the swing low or the low price of the preceding red candle, depending on which is lower.
Historic Peaks and Troughs
The current, or most recent, peak and trough occurrences are referred to as occurrence zero. Previous peak and trough occurrences are referred to as historic and ordered numerically from right to left, with the most recent historic peak and trough occurrences being occurrence one.
Support and Resistance
• Support refers to a price level where the demand for an asset is strong enough to prevent the price from falling further.
• Resistance refers to a price level where the supply of an asset is strong enough to prevent the price from rising further.
Support and resistance levels are important because they can help traders identify where the price of an asset might pause or reverse its direction, offering potential entry and exit points. For example, a trader might look to buy an asset when it approaches a support level , with the expectation that the price will bounce back up. Alternatively, a trader might look to sell an asset when it approaches a resistance level , with the expectation that the price will drop back down.
It's important to note that support and resistance levels are not always relevant, and the price of an asset can also break through these levels and continue moving in the same direction.
Trendlines
Trendlines are straight lines that are drawn between two or more points on a price chart. These lines are used as dynamic support and resistance levels for making strategic decisions and predictions about future price movements. For example traders will look for price movements along, and reactions to, trendlines in the form of rejections or breakouts/downs.
█ FEATURES
Inputs
• Anchor Point Type
• Swing High/Low Occurrence
• HTF Resolution
• Highest High/Lowest Low Lookback
• Angle Degree
• Number Lines
• Line Color
Anchor Point Types
• Swing High
• Swing Low
• Swing High (HTF)
• Swing Low (HTF)
• Highest High
• Lowest Low
• Intraday Highest High (intraday charts only)
• Intraday Lowest Low (intraday charts only)
Swing High/Swing Low Occurrence
This input is used to determine which historic peak or trough to reference for swing high or swing low anchor point types.
HTF Resolution
This input is used to determine which higher timeframe to reference for swing high (HTF) or swing low (HTF) anchor point types.
Highest High/Lowest Low Lookback
This input is used to determine the lookback length for highest high or lowest low anchor point types.
Intraday Highest High/Lowest Low Lookback
When using intraday highest high or lowest low anchor point types, the lookback length is calculated automatically based on number of bars since the daily candle opened.
Angle Degree
This input is used to determine the angle of the trendlines. The output is expressed in terms of point or pips, depending on the symbol type, which is then passed through the built in math.todegrees() function. Positive numbers will project the lines upwards while negative numbers will project the lines downwards. Depending on the market and timeframe, the impact input values will have on the visible gaps between the lines will vary greatly. For example, an input of 10 will have a far greater impact on the gaps between the lines when viewed from the 1-minute timeframe than it would on the 1-day timeframe. The input is a float and as such the value passed through can go into as many decimal places as the user requires.
It is also worth mentioning that as more lines are added the gaps between the lines, that are closest to the anchor point, will get tighter as they make their way up the y-axis. Although the gaps between the lines will stay constant at the x2 plot, i.e. a distance of 10 points between them, they will gradually get tighter and tighter at the point of origin as the slope of the lines get steeper.
Number Lines
This input is used to determine the number of lines to be drawn on the chart, maximum is 500.
█ LIMITATIONS
All green and red candle calculations are based on differences between open and close prices, as such I have made no attempt to account for green candles that gap lower and close below the close price of the preceding candle, or red candles that gap higher and close above the close price of the preceding candle. This may cause some unexpected behaviour on some markets and timeframes. I can only recommend using 24-hour markets, if and where possible, as there are far fewer gaps and, generally, more data to work with.
If the lines do not draw or you see a study error saying that the script references too many candles in history, this is most likely because the higher timeframe anchor point is not present on the current timeframe. This problem usually occurs when referencing a higher timeframe, such as the 1-month, from a much lower timeframe, such as the 1-minute. How far you can lookback for higher timeframe anchor points on the current timeframe will also be limited by your Trading View subscription plan. Premium users get 20,000 candles worth of data, pro+ and pro users get 10,000, and basic users get 5,000.
█ RAMBLINGS
It is my current thesis that the indicator will work best when used in conjunction with my Wavemeter indicator, which can be used to set the angle. For example, the average wave height or amplitude could be used as the value for the angle input. Or some factor or multiple of such an average. I think this makes sense as it allows for objectivity when applying the indicator across different markets and timeframes with different energies and vibrations.
“If you want to find the secrets of the universe, think in terms of energy, frequency and vibration.”
― Nikola Tesla

LineWrapperLibrary "LineWrapper"
Wrapper Type for Line. Useful when you want to store the line details without drawing them. Can also be used in scnearios where you collect lines to be drawn and draw together towards the end.
draw(this)
draws line as per the wrapper object contents
Parameters:
this : (series Line) Line object.
Returns: current Line object
draw(this)
draws lines as per the wrapper object array
Parameters:
this : (series array) Array of Line object.
Returns: current Array of Line objects
update(this)
updates or redraws line as per the wrapper object contents
Parameters:
this : (series Line) Line object.
Returns: current Line object
update(this)
updates or redraws lines as per the wrapper object array
Parameters:
this : (series array) Array of Line object.
Returns: current Array of Line objects
get_price(this, bar)
get line price based on bar
Parameters:
this : (series Line) Line object.
bar : (series/int) bar at which line price need to be calculated
Returns: line price at given bar.
get_x1(this)
Returns UNIX time or bar index (depending on the last xloc value set) of the first point of the line.
Parameters:
this : (series Line) Line object.
Returns: UNIX timestamp (in milliseconds) or bar index.
get_x2(this)
Returns UNIX time or bar index (depending on the last xloc value set) of the second point of the line.
Parameters:
this : (series Line) Line object.
Returns: UNIX timestamp (in milliseconds) or bar index.
get_y1(this)
Returns price of the first point of the line.
Parameters:
this : (series Line) Line object.
Returns: Price value.
get_y2(this)
Returns price of the second point of the line.
Parameters:
this : (series Line) Line object.
Returns: Price value.
set_x1(this, x, draw, update)
Sets bar index or bar time (depending on the xloc) of the first point.
Parameters:
this : (series Line) Line object.
x : (series int) Bar index or bar time. Note that objects positioned using xloc.bar_index cannot be drawn further than 500 bars into the future.
draw : (series bool) draw line after setting attribute
update : (series bool) update line instead of redraw. Only valid if draw is set.
Returns: Current Line object
set_x2(this, x, draw, update)
Sets bar index or bar time (depending on the xloc) of the second point.
Parameters:
this : (series Line) Line object.
x : (series int) Bar index or bar time. Note that objects positioned using xloc.bar_index cannot be drawn further than 500 bars into the future.
draw : (series bool) draw line after setting attribute
update : (series bool) update line instead of redraw. Only valid if draw is set.
Returns: Current Line object
set_y1(this, y, draw, update)
Sets price of the first point
Parameters:
this : (series Line) Line object.
y : (series int/float) Price.
draw : (series bool) draw line after setting attribute
update : (series bool) update line instead of redraw. Only valid if draw is set.
Returns: Current Line object
set_y2(this, y, draw, update)
Sets price of the second point
Parameters:
this : (series Line) Line object.
y : (series int/float) Price.
draw : (series bool) draw line after setting attribute
update : (series bool) update line instead of redraw. Only valid if draw is set.
Returns: Current Line object
set_color(this, color, draw, update)
Sets the line color
Parameters:
this : (series Line) Line object.
color : (series color) New line color
draw : (series bool) draw line after setting attribute
update : (series bool) update line instead of redraw. Only valid if draw is set.
Returns: Current Line object
set_extend(this, extend, draw, update)
Sets extending type of this line object. If extend=extend.none, draws segment starting at point (x1, y1) and ending at point (x2, y2). If extend is equal to extend.right or extend.left, draws a ray starting at point (x1, y1) or (x2, y2), respectively. If extend=extend.both, draws a straight line that goes through these points.
Parameters:
this : (series Line) Line object.
extend : (series string) New extending type.
draw : (series bool) draw line after setting attribute
update : (series bool) update line instead of redraw. Only valid if draw is set.
Returns: Current Line object
set_style(this, style, draw, update)
Sets the line style
Parameters:
this : (series Line) Line object.
style : (series string) New line style.
draw : (series bool) draw line after setting attribute
update : (series bool) update line instead of redraw. Only valid if draw is set.
Returns: Current Line object
set_width(this, width, draw, update)
Sets the line width.
Parameters:
this : (series Line) Line object.
width : (series int) New line width in pixels.
draw : (series bool) draw line after setting attribute
update : (series bool) update line instead of redraw. Only valid if draw is set.
Returns: Current Line object
set_xloc(this, x1, x2, xloc, draw, update)
Sets x-location and new bar index/time values.
Parameters:
this : (series Line) Line object.
x1 : (series int) Bar index or bar time of the first point.
x2 : (series int) Bar index or bar time of the second point.
xloc : (series string) New x-location value.
draw : (series bool) draw line after setting attribute
update : (series bool) update line instead of redraw. Only valid if draw is set.
Returns: Current Line object
set_xy1(this, x, y, draw, update)
Sets bar index/time and price of the first point.
Parameters:
this : (series Line) Line object.
x : (series int) Bar index or bar time. Note that objects positioned using xloc.bar_index cannot be drawn further than 500 bars into the future.
y : (series int/float) Price.
draw : (series bool) draw line after setting attribute
update : (series bool) update line instead of redraw. Only valid if draw is set.
Returns: Current Line object
set_xy2(this, x, y, draw, update)
Sets bar index/time and price of the second point
Parameters:
this : (series Line) Line object.
x : (series int) Bar index or bar time. Note that objects positioned using xloc.bar_index cannot be drawn further than 500 bars into the future.
y : (series int/float) Price.
draw : (series bool) draw line after setting attribute
update : (series bool) update line instead of redraw. Only valid if draw is set.
Returns: Current Line object
delete(this)
Deletes the underlying line drawing object
Parameters:
this : (series Line) Line object.
Returns: Current Line object
Line
Line Wrapper object
Fields:
x1 : (series int) Bar index (if xloc = xloc.bar_index) or bar UNIX time (if xloc = xloc.bar_time) of the first point of the line. Note that objects positioned using xloc.bar_index cannot be drawn further than 500 bars into the future.
y1 : (series int/float) Price of the first point of the line.
x2 : (series int) Bar index (if xloc = xloc.bar_index) or bar UNIX time (if xloc = xloc.bar_time) of the second point of the line. Note that objects positioned using xloc.bar_index cannot be drawn further than 500 bars into the future.
y2 : (series int/float) Price of the second point of the line.
xloc : (series string) See description of x1 argument. Possible values: xloc.bar_index and xloc.bar_time. Default is xloc.bar_index.
extend : (series string) If extend=extend.none, draws segment starting at point (x1, y1) and ending at point (x2, y2). If extend is equal to extend.right or extend.left, draws a ray starting at point (x1, y1) or (x2, y2), respectively. If extend=extend.both, draws a straight line that goes through these points. Default value is extend.none.
color : (series color) Line color.
style : (series string) Line style. Possible values: line.style_solid, line.style_dotted, line.style_dashed, line.style_arrow_left, line.style_arrow_right, line.style_arrow_both.
width : (series int) Line width in pixels.
obj : line object

Vector2FunctionClipLibrary "Vector2FunctionClip"
Sutherland-Hodgman polygon clipping algorithm.
reference:
.
rosettacode.org
.
clip(source, reference)
Perform Clip operation on a vector with another.
Parameters:
source : array . Source polygon to be clipped.
reference : array . Reference polygon to clip source.
Returns: array.

Segment2Library "Segment2"
Structure representation of a directed straight line in two dimensions from origin to target vectors.
.
reference:
graphics.stanford.edu
.
new(origin, target)
Generate a new segment.
Parameters:
origin : Vector2 . Origin of the segment.
target : Vector2 . Target of the segment.
Returns: Segment2.
new(origin_x, origin_y, target_x, target_y)
Generate a new segment.
Parameters:
origin_x : float . Origin of the segment x coordinate.
origin_y : float . Origin of the segment y coordinate.
target_x : float . Target of the segment x coordinate.
target_y : float . Target of the segment y coordinate.
Returns: Segment2.
copy(this)
Copy a segment.
Parameters:
this : Vector2 . Segment to copy.
Returns: Segment2.
length_squared(this)
Squared length of the normalized segment vector. For comparing vectors this is computationaly lighter.
Parameters:
this : Segment2 . Sorce segment.
Returns: float.
length(this)
Length of the normalized segment vector.
Parameters:
this : Segment2 . Sorce segment.
Returns: float.
opposite(this)
Reverse the direction of the segment.
Parameters:
this : Segment2 . Source segment.
Returns: Segment2.
is_degenerate(this)
Segment is degenerate when origin and target are equal.
Parameters:
this : Segment2 . Source segment.
Returns: bool.
is_horizontal(this)
Segment is horizontal?.
Parameters:
this : Segment2 . Source segment.
Returns: bool.
is_horizontal(this, precision)
Segment is horizontal?.
Parameters:
this : Segment2 . Source segment.
precision : float . Limit of precision.
Returns: bool.
is_vertical(this)
Segment is vertical?.
Parameters:
this : Segment2 . Source segment.
Returns: bool.
is_vertical(this, precision)
Segment is vertical?.
Parameters:
this : Segment2 . Source segment.
precision : float . Limit of precision.
Returns: bool.
equals(this, other)
Tests two segments for equality (share same origin and target).
Parameters:
this : Segment2 . Source segment.
other : Segment2 . Target segment.
Returns: bool.
nearest_to_point(this, point)
Find the nearest point in a segment to another point.
Parameters:
this : Segment2 . Source segment.
point : Vector2 . Point to aproximate.
Returns: Vector2.
intersection(this, other)
Find the intersection vector of 2 lines.
Parameters:
this : Segment2 . Segment A.
other : Segment2 . Segment B.
Returns: Vector2.Vector2 Object.
extend(this, at_origin, at_target)
Extend a segment by the percent ratio provided.
Parameters:
this : Segment2 . Source segment.
at_origin : float . Percent ratio to extend at origin vector.
at_target : float . Percent ratio to extend at target vector.
Returns: Segment2.
to_string(this)
Translate segment to string format `( (x,y), (x,y) )`.
Parameters:
this : Segment2 . Source segment.
Returns: string.
to_string(this, format)
Translate segment to string format `((x,y), (x,y))`.
Parameters:
this : Segment2 . Source segment.
format : string . Format string to apply.
Returns: string.
to_array(this)
Translate segment to array format.
Parameters:
this : Segment2 . Source segment.
Returns: array.

Vector2DrawQuadLibrary "Vector2DrawQuad"
functions to handle vector2 Quad drawing operations.
new(a, b, c, d, xloc, bg_color, line_color, line_style, line_width)
Draws a quadrilateral with background fill.
Parameters:
a : v2 . Vector2 object, in the form `(x, y)`.
b : v2 . Vector2 object, in the form `(x, y)`.
c : v2 . Vector2 object, in the form `(x, y)`.
d : v2 . Vector2 object, in the form `(x, y)`.
xloc : string . Type of axis unit, bar_index or time.
bg_color : color . Color of the background.
line_color : color . Color of the line.
line_style : string . Style of the line.
line_width : int . Width of the line.
Returns: Quad object.
copy(this)
Copy a existing quad object.
Parameters:
this : Quad . Source quad.
Returns: Quad.
set_position_a(this, x, y)
Set the position of corner `a` (modifies source quad).
Parameters:
this : Quad . Source quad.
x : int . Value at the x axis.
y : float . Value at the y axis.
Returns: Source Quad.
set_position_a(this, position)
Set the position of corner `a` (modifies source quad).
Parameters:
this : Quad . Source quad.
position : Vector2 . New position.
Returns: Source Quad.
set_position_b(this, x, y)
Set the position of corner `b` (modifies source quad).
Parameters:
this : Quad . Source quad.
x : int . Value at the x axis.
y : float . Value at the y axis.
Returns: Source Quad.
set_position_b(this, position)
Set the position of corner `b` (modifies source quad).
Parameters:
this : Quad . Source quad.
position : Vector2 . New position.
Returns: Source Quad.
set_position_c(this, x, y)
Set the position of corner `c` (modifies source quad).
Parameters:
this : Quad . Source quad.
x : int . Value at the x axis.
y : float . Value at the y axis.
Returns: Source Quad.
set_position_c(this, position)
Set the position of corner `c` (modifies source quad).
Parameters:
this : Quad . Source quad.
position : Vector2 . New position.
Returns: Source Quad.
set_position_d(this, x, y)
Set the position of corner `d` (modifies source quad).
Parameters:
this : Quad . Source quad.
x : int . Value at the x axis.
y : float . Value at the y axis.
Returns: Source Quad.
set_position_d(this, position)
Set the position of corner `d` (modifies source quad).
Parameters:
this : Quad . Source quad.
position : Vector2 . New position.
Returns: Source Quad.
set_style(this, bg_color, line_color, line_style, line_width)
Update quad style options (modifies Source quad).
Parameters:
this : Quad . Source quad.
bg_color : color . Color of the background.
line_color : color . Color of the line.
line_style : string . Style of the line.
line_width : int . Width of the line.
Returns: Source Quad.
set_bg_color(this, bg_color)
Update quad style options (modifies Source quad).
Parameters:
this : Quad . Source quad.
bg_color : color . Color of the background.
Returns: Source Quad.
set_line_color(this, line_color)
Update quad style options (modifies Source quad).
Parameters:
this : Quad . Source quad.
line_color : color . Color of the line.
Returns: Source Quad.
set_line_style(this, line_style)
Update quad style options (modifies Source quad).
Parameters:
this : Quad . Source quad.
line_style : string . Style of the line.
Returns: Source Quad.
set_line_width(this, line_width)
Update quad style options (modifies Source quad).
Parameters:
this : Quad . Source quad.
line_width : int . Width of the line.
Returns: Source Quad.
move(this, x, y)
Move quad by provided amount (modifies source quad).
Parameters:
this : Quad . Source quad.
x : float . Amount to move the vertices of the quad in the x axis.
y : float . Amount to move the vertices of the quad in the y axis.
Returns: Source Quad.
move(this, amount)
Move quad by provided amount (modifies source quad).
Parameters:
this : Quad . Source quad.
amount : Vector2 . Amount to move the vertices of the quad in the x and y axis.
Returns: Source Quad.
rotate_around(this, center, angle)
Rotate source quad around a center (modifies source quad).
Parameters:
this : Quad . Source quad.
center : Vector2 . Center coordinates of the rotation.
angle : float . Value of angle in degrees.
Returns: Source Quad.
rotate_around(this, center_x, center_y, angle)
Rotate source quad around a center (modifies source quad).
Parameters:
this : Quad . Source quad.
center_x : int . Center coordinates of the rotation.
center_y : float . Center coordinates of the rotation.
angle : float . Value of angle in degrees.
Returns: Source Quad.
Vector2DrawTriangleLibrary "Vector2DrawTriangle"
Functions to draw a triangle and manipulate its properties.
new(a, b, c, xloc, bg_color, line_color, line_style, line_width)
Draws a triangle with background fill using line prototype.
Parameters:
a : v2 . Vector2 object, in the form `(x, y)`.
b : v2 . Vector2 object, in the form `(x, y)`.
c : v2 . Vector2 object, in the form `(x, y)`.
xloc : string . Type of axis unit, bar_index or time.
bg_color : color . Color of the background.
line_color : color . Color of the line.
line_style : string . Style of the line.
line_width : int . Width of the line.
Returns: Triangle object.
copy(this)
Copy a existing triangle object.
Parameters:
this : Triangle . Source triangle.
Returns: Triangle.
set_position_a(this, x, y)
Set the position of corner `a` (modifies source triangle).
Parameters:
this : Triangle . Source triangle.
x : int . Value at the x axis.
y : float . Value at the y axis.
Returns: Source Triangle.
set_position_a(this, position)
Set the position of corner `a` (modifies source triangle).
Parameters:
this : Triangle . Source triangle.
position : Vector2 . New position.
Returns: Source Triangle.
set_position_b(this, x, y)
Set the position of corner `b` (modifies source triangle).
Parameters:
this : Triangle . Source triangle.
x : int . Value at the x axis.
y : float . Value at the y axis.
Returns: Source Triangle.
set_position_b(this, position)
Set the position of corner `b` (modifies source triangle).
Parameters:
this : Triangle . Source triangle.
position : Vector2 . New position.
Returns: Source Triangle.
set_position_c(this, x, y)
Set the position of corner `c` (modifies source triangle).
Parameters:
this : Triangle . Source triangle.
x : int . Value at the x axis.
y : float . Value at the y axis.
Returns: Source Triangle.
set_position_c(this, position)
Set the position of corner `c` (modifies source triangle).
Parameters:
this : Triangle . Source triangle.
position : Vector2 . New position.
Returns: Source Triangle.
set_style(this, bg_color, line_color, line_style, line_width)
Update triangle style options (modifies Source triangle).
Parameters:
this : Triangle . Source triangle.
bg_color : color . Color of the background.
line_color : color . Color of the line.
line_style : string . Style of the line.
line_width : int . Width of the line.
Returns: Source Triangle.
set_bg_color(this, bg_color)
Update triangle style options (modifies Source triangle).
Parameters:
this : Triangle . Source triangle.
bg_color : color . Color of the background.
Returns: Source Triangle.
set_line_color(this, line_color)
Update triangle style options (modifies Source triangle).
Parameters:
this : Triangle . Source triangle.
line_color : color . Color of the line.
Returns: Source Triangle.
set_line_style(this, line_style)
Update triangle style options (modifies Source triangle).
Parameters:
this : Triangle . Source triangle.
line_style : string . Style of the line.
Returns: Source Triangle.
set_line_width(this, line_width)
Update triangle style options (modifies Source triangle).
Parameters:
this : Triangle . Source triangle.
line_width : int . Width of the line.
Returns: Source Triangle.
move(this, x, y)
Move triangle by provided amount (modifies source triangle).
Parameters:
this : Triangle . Source triangle.
x : float . Amount to move the vertices of the triangle in the x axis.
y : float . Amount to move the vertices of the triangle in the y axis.
Returns: Source Triangle.
move(this, amount)
Move triangle by provided amount (modifies source triangle).
Parameters:
this : Triangle . Source triangle.
amount : Vector2 . Amount to move the vertices of the triangle in the x and y axis.
Returns: Source Triangle.
rotate_around(this, center, angle)
Rotate source triangle around a center (modifies source triangle).
Parameters:
this : Triangle . Source triangle.
center : Vector2 . Center coordinates of the rotation.
angle : float . Value of angle in degrees.
Returns: Source Triangle.
rotate_around(this, center_x, center_y, angle)
Rotate source triangle around a center (modifies source triangle).
Parameters:
this : Triangle . Source triangle.
center_x : int . Center coordinates of the rotation.
center_y : float . Center coordinates of the rotation.
angle : float . Value of angle in degrees.
Returns: Source Triangle.
CommonTypesDrawingLibrary "CommonTypesDrawing"
Provides a common library source for common types of used graphical drawing structures.
Includes: `Triangle, Quad, Polygon`
Triangle
Representation of a triangle using lines and linefill.
Fields:
ab : Edge of point a to b.
bc : Edge of point b to c.
ca : Edge of point c to a.
fill : Fill of the object.
solid : Check if polygon should have a fill.
Quad
Representation of a quadrilateral using lines and linefill.
Fields:
ab : Edge of point a to b.
bc : Edge of point b to c.
cd : Edge of point c to d.
da : Edge of point d to a.
fill : Fill of the object.
solid : Check if polygon should have a fill.
Polygon
Representation of a polygon using lines and linefill.
Fields:
edges : List of edges in the polygon.
fills : Fills of the object.
closed : Check if polygon line should connect last vertice to first.
solid : Check if polygon should have a fill.

Vector2DrawLineLibrary "Vector2DrawLine"
Extends line type with methods for Vector2 and Segment2.
new(origin, target, xloc, extend, color, style, width)
Draws a line using Segment type to hold its coordinate properties..
Parameters:
origin : Vector2 . Origin vector of the line.
target : Vector2 . Target vector of the line.
xloc : string
extend : string
color : color
style : string
width : int
Returns: line object
new(segment, xloc, extend, color, style, width)
Draws a line using Segment type to hold its coordinate properties..
Parameters:
segment : Segment2 . Segment with positional coordinates.
xloc : string
extend : string
color : color
style : string
width : int
Returns: line object
rotate_around(this, center, angle)
Instance method to rotate line around center vector (modifies input line).
Parameters:
this : line . Line object.
center : Vector2 . Center of rotation.
angle : float . Rotation angle in degrees.
Returns: line. Rotated line object.
PitchforkMethodsLibrary "PitchforkMethods"
Methods associated with Pitchfork and Pitchfork Drawing. Depends on the library PitchforkTypes for Pitchfork/PitchforkDrawing objects which in turn use DrawingTypes for basic objects Point/Line/LineProperties. Also depends on DrawingMethods for related methods
tostring(this)
Converts PitchforkTypes/Fork object to string representation
Parameters:
this : PitchforkTypes/Fork object
Returns: string representation of PitchforkTypes/Fork
tostring(this)
Converts Array of PitchforkTypes/Fork object to string representation
Parameters:
this : Array of PitchforkTypes/Fork object
Returns: string representation of PitchforkTypes/Fork array
tostring(this, sortKeys, sortOrder)
Converts PitchforkTypes/PitchforkProperties object to string representation
Parameters:
this : PitchforkTypes/PitchforkProperties object
sortKeys : If set to true, string output is sorted by keys.
sortOrder : Applicable only if sortKeys is set to true. Positive number will sort them in ascending order whreas negative numer will sort them in descending order. Passing 0 will not sort the keys
Returns: string representation of PitchforkTypes/PitchforkProperties
tostring(this, sortKeys, sortOrder)
Converts PitchforkTypes/PitchforkDrawingProperties object to string representation
Parameters:
this : PitchforkTypes/PitchforkDrawingProperties object
sortKeys : If set to true, string output is sorted by keys.
sortOrder : Applicable only if sortKeys is set to true. Positive number will sort them in ascending order whreas negative numer will sort them in descending order. Passing 0 will not sort the keys
Returns: string representation of PitchforkTypes/PitchforkDrawingProperties
tostring(this, sortKeys, sortOrder)
Converts PitchforkTypes/Pitchfork object to string representation
Parameters:
this : PitchforkTypes/Pitchfork object
sortKeys : If set to true, string output is sorted by keys.
sortOrder : Applicable only if sortKeys is set to true. Positive number will sort them in ascending order whreas negative numer will sort them in descending order. Passing 0 will not sort the keys
Returns: string representation of PitchforkTypes/Pitchfork
createDrawing(this)
Creates PitchforkTypes/PitchforkDrawing from PitchforkTypes/Pitchfork object
Parameters:
this : PitchforkTypes/Pitchfork object
Returns: PitchforkTypes/PitchforkDrawing object created
createDrawing(this)
Creates PitchforkTypes/PitchforkDrawing array from PitchforkTypes/Pitchfork array of objects
Parameters:
this : array of PitchforkTypes/Pitchfork object
Returns: array of PitchforkTypes/PitchforkDrawing object created
draw(this)
draws from PitchforkTypes/PitchforkDrawing object
Parameters:
this : PitchforkTypes/PitchforkDrawing object
Returns: PitchforkTypes/PitchforkDrawing object drawn
delete(this)
deletes PitchforkTypes/PitchforkDrawing object
Parameters:
this : PitchforkTypes/PitchforkDrawing object
Returns: PitchforkTypes/PitchforkDrawing object deleted
delete(this)
deletes underlying drawing of PitchforkTypes/Pitchfork object
Parameters:
this : PitchforkTypes/Pitchfork object
Returns: PitchforkTypes/Pitchfork object deleted
delete(this)
deletes array of PitchforkTypes/PitchforkDrawing objects
Parameters:
this : Array of PitchforkTypes/PitchforkDrawing object
Returns: Array of PitchforkTypes/PitchforkDrawing object deleted
delete(this)
deletes underlying drawing in array of PitchforkTypes/Pitchfork objects
Parameters:
this : Array of PitchforkTypes/Pitchfork object
Returns: Array of PitchforkTypes/Pitchfork object deleted
clear(this)
deletes array of PitchforkTypes/PitchforkDrawing objects and clears the array
Parameters:
this : Array of PitchforkTypes/PitchforkDrawing object
Returns: void
clear(this)
deletes array of PitchforkTypes/Pitchfork objects and clears the array
Parameters:
this : Array of Pitchfork/Pitchfork object
Returns: void
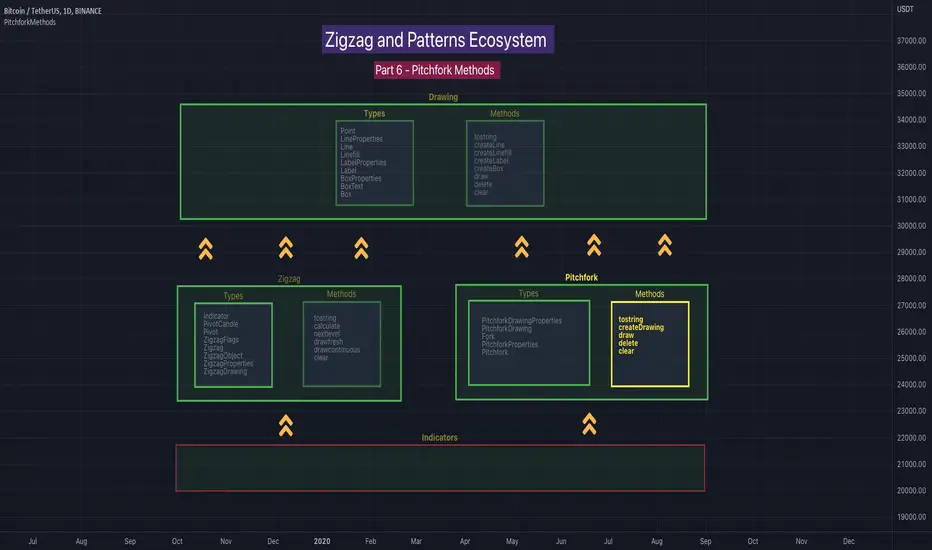
PitchforkTypesLibrary "PitchforkTypes"
User Defined Types to be used for Pitchfork and Drawing elements of Pitchfork. Depends on DrawingTypes for Point, Line, and LineProperties objects
PitchforkDrawingProperties
Pitchfork Drawing Properties object
Fields:
extend : If set to true, forks are extended towards right. Default is true
fill : Fill forklines with transparent color. Default is true
fillTransparency : Transparency at which fills are made. Only considered when fill is set. Default is 80
forceCommonColor : Force use of common color for forks and fills. Default is false
commonColor : common fill color. Used only if ratio specific fill colors are not available or if forceCommonColor is set to true.
PitchforkDrawing
Pitchfork drawing components
Fields:
medianLine : Median line of the pitchfork
baseLine : Base line of the pitchfork
forkLines : fork lines of the pitchfork
linefills : Linefills between forks
Fork
Fork object property
Fields:
ratio : Fork ratio
forkColor : color of fork. Default is blue
include : flag to include the fork in drawing. Default is true
PitchforkProperties
Pitchfork Properties
Fields:
forks : Array of Fork objects
type : Pitchfork type. Supported values are "regular", "schiff", "mschiff", Default is regular
inside : Flag to identify if to draw inside fork. If set to true, inside fork will be drawn
Pitchfork
Pitchfork object
Fields:
a : Pivot Point A of pitchfork
b : Pivot Point B of pitchfork
c : Pivot Point C of pitchfork
properties : PitchforkProperties object which determines type and composition of pitchfork
dProperties : Drawing properties for pitchfork
lProperties : Common line properties for Pitchfork lines
drawing : PitchforkDrawing object

ZigzagMethodsLibrary "ZigzagMethods"
Object oriented implementation of Zigzag methods. Please refer to ZigzagTypes library for User defined types used in this library
tostring(this, sortKeys, sortOrder, includeKeys)
Converts ZigzagTypes/Pivot object to string representation
Parameters:
this : ZigzagTypes/Pivot
sortKeys : If set to true, string output is sorted by keys.
sortOrder : Applicable only if sortKeys is set to true. Positive number will sort them in ascending order whreas negative numer will sort them in descending order. Passing 0 will not sort the keys
includeKeys : Array of string containing selective keys. Optional parmaeter. If not provided, all the keys are considered
Returns: string representation of ZigzagTypes/Pivot
tostring(this, sortKeys, sortOrder, includeKeys)
Converts Array of Pivot objects to string representation
Parameters:
this : Pivot object array
sortKeys : If set to true, string output is sorted by keys.
sortOrder : Applicable only if sortKeys is set to true. Positive number will sort them in ascending order whreas negative numer will sort them in descending order. Passing 0 will not sort the keys
includeKeys : Array of string containing selective keys. Optional parmaeter. If not provided, all the keys are considered
Returns: string representation of Pivot object array
tostring(this)
Converts ZigzagFlags object to string representation
Parameters:
this : ZigzagFlags object
Returns: string representation of ZigzagFlags
tostring(this, sortKeys, sortOrder, includeKeys)
Converts ZigzagTypes/Zigzag object to string representation
Parameters:
this : ZigzagTypes/Zigzagobject
sortKeys : If set to true, string output is sorted by keys.
sortOrder : Applicable only if sortKeys is set to true. Positive number will sort them in ascending order whreas negative numer will sort them in descending order. Passing 0 will not sort the keys
includeKeys : Array of string containing selective keys. Optional parmaeter. If not provided, all the keys are considered
Returns: string representation of ZigzagTypes/Zigzag
calculate(this, ohlc, indicators, indicatorNames)
Calculate zigzag based on input values and indicator values
Parameters:
this : Zigzag object
ohlc : Array containing OHLC values. Can also have custom values for which zigzag to be calculated
indicators : Array of indicator values
indicatorNames : Array of indicator names for which values are present. Size of indicators array should be equal to that of indicatorNames
Returns: current Zigzag object
calculate(this)
Calculate zigzag based on properties embedded within Zigzag object
Parameters:
this : Zigzag object
Returns: current Zigzag object
nextlevel(this)
Calculate Next Level Zigzag based on the current calculated zigzag object
Parameters:
this : Zigzag object
Returns: Next Level Zigzag object
clear(this)
Clears zigzag drawings array
Parameters:
this : array
Returns: void
drawfresh(this)
draws fresh zigzag based on properties embedded in ZigzagDrawing object
Parameters:
this : ZigzagDrawing object
Returns: ZigzagDrawing object
drawcontinuous(this)
draws zigzag based on the zigzagmatrix input
Parameters:
this : ZigzagDrawing object
Returns:

ZigzagTypesLibrary "ZigzagTypes"
Zigzag related user defined types. Depends on DrawingTypes library for basic types
Indicator
Indicator is collection of indicator values applied on high, low and close
Fields:
indicatorHigh : Indicator Value applied on High
indicatorLow : Indicator Value applied on Low
PivotCandle
PivotCandle represents data of the candle which forms either pivot High or pivot low or both
Fields:
_high : High price of candle forming the pivot
_low : Low price of candle forming the pivot
length : Pivot length
pHighBar : represents number of bar back the pivot High occurred.
pLowBar : represents number of bar back the pivot Low occurred.
pHigh : Pivot High Price
pLow : Pivot Low Price
indicators : Array of Indicators - allows to add multiple
Pivot
Pivot refers to zigzag pivot. Each pivot can contain various data
Fields:
point : pivot point coordinates
dir : direction of the pivot. Valid values are 1, -1, 2, -2
level : is used for multi level zigzags. For single level, it will always be 0
ratio : Price Ratio based on previous two pivots
indicatorNames : Names of the indicators applied on zigzag
indicatorValues : Values of the indicators applied on zigzag
indicatorRatios : Ratios of the indicators applied on zigzag based on previous 2 pivots
ZigzagFlags
Flags required for drawing zigzag. Only used internally in zigzag calculation. Should not set the values explicitly
Fields:
newPivot : true if the calculation resulted in new pivot
doublePivot : true if the calculation resulted in two pivots on same bar
updateLastPivot : true if new pivot calculated replaces the old one.
Zigzag
Zigzag object which contains whole zigzag calculation parameters and pivots
Fields:
length : Zigzag length. Default value is 5
numberOfPivots : max number of pivots to hold in the calculation. Default value is 20
offset : Bar offset to be considered for calculation of zigzag. Default is 0 - which means calculation is done based on the latest bar.
level : Zigzag calculation level - used in multi level recursive zigzags
zigzagPivots : array which holds the last n pivots calculated.
flags : ZigzagFlags object which is required for continuous drawing of zigzag lines.
ZigzagObject
Zigzag Drawing Object
Fields:
zigzagLine : Line joining two pivots
zigzagLabel : Label which can be used for drawing the values, ratios, directions etc.
ZigzagProperties
Object which holds properties of zigzag drawing. To be used along with ZigzagDrawing
Fields:
lineColor : Zigzag line color. Default is color.blue
lineWidth : Zigzag line width. Default is 1
lineStyle : Zigzag line style. Default is line.style_solid.
showLabel : If set, the drawing will show labels on each pivot. Default is false
textColor : Text color of the labels. Only applicable if showLabel is set to true.
maxObjects : Max number of zigzag lines to display. Default is 300
xloc : Time/Bar reference to be used for zigzag drawing. Default is Time - xloc.bar_time.
ZigzagDrawing
Object which holds complete zigzag drawing objects and properties.
Fields:
properties : ZigzagProperties object which is used for setting the display styles of zigzag
drawings : array which contains lines and labels of zigzag drawing.
zigzag : Zigzag object which holds the calculations.
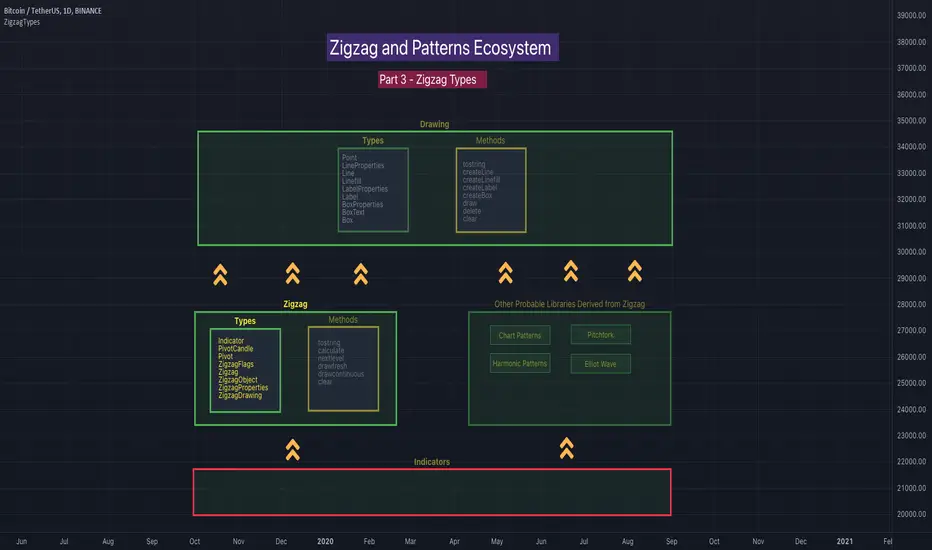
DrawingMethodsLibrary "DrawingMethods"
tostring(this, sortKeys, sortOrder, includeKeys)
Converts DrawingTypes/Point object to string representation
Parameters:
this : DrawingTypes/Point object
sortKeys : If set to true, string output is sorted by keys.
sortOrder : Applicable only if sortKeys is set to true. Positive number will sort them in ascending order whreas negative numer will sort them in descending order. Passing 0 will not sort the keys
includeKeys : Array of string containing selective keys. Optional parmaeter. If not provided, all the keys are considered
Returns: string representation of DrawingTypes/Point
tostring(this, sortKeys, sortOrder, includeKeys)
Converts DrawingTypes/LineProperties object to string representation
Parameters:
this : DrawingTypes/LineProperties object
sortKeys : If set to true, string output is sorted by keys.
sortOrder : Applicable only if sortKeys is set to true. Positive number will sort them in ascending order whreas negative numer will sort them in descending order. Passing 0 will not sort the keys
includeKeys : Array of string containing selective keys. Optional parmaeter. If not provided, all the keys are considered
Returns: string representation of DrawingTypes/LineProperties
tostring(this, sortKeys, sortOrder, includeKeys)
Converts DrawingTypes/Line object to string representation
Parameters:
this : DrawingTypes/Line object
sortKeys : If set to true, string output is sorted by keys.
sortOrder : Applicable only if sortKeys is set to true. Positive number will sort them in ascending order whreas negative numer will sort them in descending order. Passing 0 will not sort the keys
includeKeys : Array of string containing selective keys. Optional parmaeter. If not provided, all the keys are considered
Returns: string representation of DrawingTypes/Line
tostring(this, sortKeys, sortOrder, includeKeys)
Converts DrawingTypes/LabelProperties object to string representation
Parameters:
this : DrawingTypes/LabelProperties object
sortKeys : If set to true, string output is sorted by keys.
sortOrder : Applicable only if sortKeys is set to true. Positive number will sort them in ascending order whreas negative numer will sort them in descending order. Passing 0 will not sort the keys
includeKeys : Array of string containing selective keys. Optional parmaeter. If not provided, all the keys are considered
Returns: string representation of DrawingTypes/LabelProperties
tostring(this, sortKeys, sortOrder, includeKeys)
Converts DrawingTypes/Label object to string representation
Parameters:
this : DrawingTypes/Label object
sortKeys : If set to true, string output is sorted by keys.
sortOrder : Applicable only if sortKeys is set to true. Positive number will sort them in ascending order whreas negative numer will sort them in descending order. Passing 0 will not sort the keys
includeKeys : Array of string containing selective keys. Optional parmaeter. If not provided, all the keys are considered
Returns: string representation of DrawingTypes/Label
tostring(this, sortKeys, sortOrder, includeKeys)
Converts DrawingTypes/Linefill object to string representation
Parameters:
this : DrawingTypes/Linefill object
sortKeys : If set to true, string output is sorted by keys.
sortOrder : Applicable only if sortKeys is set to true. Positive number will sort them in ascending order whreas negative numer will sort them in descending order. Passing 0 will not sort the keys
includeKeys : Array of string containing selective keys. Optional parmaeter. If not provided, all the keys are considered
Returns: string representation of DrawingTypes/Linefill
tostring(this, sortKeys, sortOrder, includeKeys)
Converts DrawingTypes/BoxProperties object to string representation
Parameters:
this : DrawingTypes/BoxProperties object
sortKeys : If set to true, string output is sorted by keys.
sortOrder : Applicable only if sortKeys is set to true. Positive number will sort them in ascending order whreas negative numer will sort them in descending order. Passing 0 will not sort the keys
includeKeys : Array of string containing selective keys. Optional parmaeter. If not provided, all the keys are considered
Returns: string representation of DrawingTypes/BoxProperties
tostring(this, sortKeys, sortOrder, includeKeys)
Converts DrawingTypes/BoxText object to string representation
Parameters:
this : DrawingTypes/BoxText object
sortKeys : If set to true, string output is sorted by keys.
sortOrder : Applicable only if sortKeys is set to true. Positive number will sort them in ascending order whreas negative numer will sort them in descending order. Passing 0 will not sort the keys
includeKeys : Array of string containing selective keys. Optional parmaeter. If not provided, all the keys are considered
Returns: string representation of DrawingTypes/BoxText
tostring(this, sortKeys, sortOrder, includeKeys)
Converts DrawingTypes/Box object to string representation
Parameters:
this : DrawingTypes/Box object
sortKeys : If set to true, string output is sorted by keys.
sortOrder : Applicable only if sortKeys is set to true. Positive number will sort them in ascending order whreas negative numer will sort them in descending order. Passing 0 will not sort the keys
includeKeys : Array of string containing selective keys. Optional parmaeter. If not provided, all the keys are considered
Returns: string representation of DrawingTypes/Box
delete(this)
Deletes line from DrawingTypes/Line object
Parameters:
this : DrawingTypes/Line object
Returns: Line object deleted
delete(this)
Deletes label from DrawingTypes/Label object
Parameters:
this : DrawingTypes/Label object
Returns: Label object deleted
delete(this)
Deletes Linefill from DrawingTypes/Linefill object
Parameters:
this : DrawingTypes/Linefill object
Returns: Linefill object deleted
delete(this)
Deletes box from DrawingTypes/Box object
Parameters:
this : DrawingTypes/Box object
Returns: DrawingTypes/Box object deleted
delete(this)
Deletes lines from array of DrawingTypes/Line objects
Parameters:
this : Array of DrawingTypes/Line objects
Returns: Array of DrawingTypes/Line objects
delete(this)
Deletes labels from array of DrawingTypes/Label objects
Parameters:
this : Array of DrawingTypes/Label objects
Returns: Array of DrawingTypes/Label objects
delete(this)
Deletes linefill from array of DrawingTypes/Linefill objects
Parameters:
this : Array of DrawingTypes/Linefill objects
Returns: Array of DrawingTypes/Linefill objects
delete(this)
Deletes boxes from array of DrawingTypes/Box objects
Parameters:
this : Array of DrawingTypes/Box objects
Returns: Array of DrawingTypes/Box objects
clear(this)
clear items from array of DrawingTypes/Line while deleting underlying objects
Parameters:
this : array
Returns: void
clear(this)
clear items from array of DrawingTypes/Label while deleting underlying objects
Parameters:
this : array
Returns: void
clear(this)
clear items from array of DrawingTypes/Linefill while deleting underlying objects
Parameters:
this : array
Returns: void
clear(this)
clear items from array of DrawingTypes/Box while deleting underlying objects
Parameters:
this : array
Returns: void
draw(this)
Creates line from DrawingTypes/Line object
Parameters:
this : DrawingTypes/Line object
Returns: line created from DrawingTypes/Line object
draw(this)
Creates lines from array of DrawingTypes/Line objects
Parameters:
this : Array of DrawingTypes/Line objects
Returns: Array of DrawingTypes/Line objects
draw(this)
Creates label from DrawingTypes/Label object
Parameters:
this : DrawingTypes/Label object
Returns: label created from DrawingTypes/Label object
draw(this)
Creates labels from array of DrawingTypes/Label objects
Parameters:
this : Array of DrawingTypes/Label objects
Returns: Array of DrawingTypes/Label objects
draw(this)
Creates linefill object from DrawingTypes/Linefill
Parameters:
this : DrawingTypes/Linefill objects
Returns: linefill object created
draw(this)
Creates linefill objects from array of DrawingTypes/Linefill objects
Parameters:
this : Array of DrawingTypes/Linefill objects
Returns: Array of DrawingTypes/Linefill used for creating linefills
draw(this)
Creates box from DrawingTypes/Box object
Parameters:
this : DrawingTypes/Box object
Returns: box created from DrawingTypes/Box object
draw(this)
Creates labels from array of DrawingTypes/Label objects
Parameters:
this : Array of DrawingTypes/Label objects
Returns: Array of DrawingTypes/Label objects
createLabel(this, lblText, tooltip, properties)
Creates DrawingTypes/Label object from DrawingTypes/Point
Parameters:
this : DrawingTypes/Point object
lblText : Label text
tooltip : Tooltip text. Default is na
properties : DrawingTypes/LabelProperties object. Default is na - meaning default values are used.
Returns: DrawingTypes/Label object
createLine(this, other, properties)
Creates DrawingTypes/Line object from one DrawingTypes/Point to other
Parameters:
this : First DrawingTypes/Point object
other : Second DrawingTypes/Point object
properties : DrawingTypes/LineProperties object. Default set to na - meaning default values are used.
Returns: DrawingTypes/Line object
createLinefill(this, other, fillColor, transparency)
Creates DrawingTypes/Linefill object from DrawingTypes/Line object to other DrawingTypes/Line object
Parameters:
this : First DrawingTypes/Line object
other : Other DrawingTypes/Line object
fillColor : fill color of linefill. Default is color.blue
transparency : fill transparency for linefill. Default is 80
Returns: Array of DrawingTypes/Linefill object
createBox(this, other, properties, textProperties)
Creates DrawingTypes/Box object from one DrawingTypes/Point to other
Parameters:
this : First DrawingTypes/Point object
other : Second DrawingTypes/Point object
properties : DrawingTypes/BoxProperties object. Default set to na - meaning default values are used.
textProperties : DrawingTypes/BoxText object. Default is na - meaning no text will be drawn
Returns: DrawingTypes/Box object
createBox(this, properties, textProperties)
Creates DrawingTypes/Box object from DrawingTypes/Line as diagonal line
Parameters:
this : Diagonal DrawingTypes/PoLineint object
properties : DrawingTypes/BoxProperties object. Default set to na - meaning default values are used.
textProperties : DrawingTypes/BoxText object. Default is na - meaning no text will be drawn
Returns: DrawingTypes/Box object
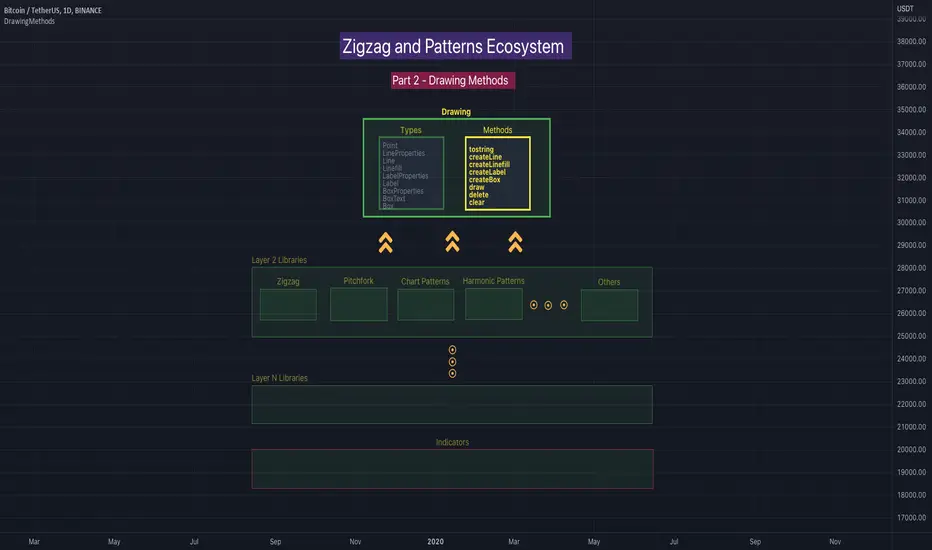
DrawingTypesLibrary "DrawingTypes"
User Defined Types for basic drawing structure. Other types and methods will be built on these.
Point
Point refers to point on chart
Fields:
price : pivot price
bar : pivot bar
bartime : pivot bar time
LineProperties
Properties of line object
Fields:
xloc : X Reference - can be either xloc.bar_index or xloc.bar_time. Default is xloc.bar_index
extend : Property which sets line to extend towards either right or left or both. Valid values are extend.right, extend.left, extend.both, extend.none. Default is extend.none
color : Line color
style : Line style, valid values are line.style_solid, line.style_dashed, line.style_dotted, line.style_arrow_left, line.style_arrow_right, line.style_arrow_both. Default is line.style_solid
width : Line width. Default is 1
Line
Line object created from points
Fields:
start : Starting point of the line
end : Ending point of the line
properties : LineProperties object which defines the style of line
object : Derived line object
LabelProperties
Properties of label object
Fields:
xloc : X Reference - can be either xloc.bar_index or xloc.bar_time. Default is xloc.bar_index
yloc : Y reference - can be yloc.price, yloc.abovebar, yloc.belowbar. Default is yloc.price
color : Label fill color
style : Label style as defined in www.tradingview.com Default is label.style_none
textcolor : text color. Default is color.black
size : Label text size. Default is size.normal. Other values are size.auto, size.tiny, size.small, size.normal, size.large, size.huge
textalign : Label text alignment. Default if text.align_center. Other allowed values - text.align_right, text.align_left, text.align_top, text.align_bottom
text_font_family : The font family of the text. Default value is font.family_default. Other available option is font.family_monospace
Label
Label object
Fields:
point : Point where label is drawn
lblText : label text
tooltip : Tooltip text. Default is na
properties : LabelProperties object
object : Pine label object
Linefill
Linefill object
Fields:
line1 : First line to create linefill
line2 : Second line to create linefill
fillColor : Fill color
transparency : Fill transparency range from 0 to 100
object : linefill object created from wrapper
BoxProperties
BoxProperties object
Fields:
border_color : Box border color. Default is color.blue
bgcolor : box background color
border_width : Box border width. Default is 1
border_style : Box border style. Default is line.style_solid
extend : Extend property of box. default is extend.none
xloc : defines if drawing needs to be done based on bar index or time. default is xloc.bar_index
BoxText
Box Text properties.
Fields:
boxText : Text to be printed on the box
text_size : Text size. Default is size.auto
text_color : Box text color. Default is color.yellow.
text_halign : horizontal align style - default is text.align_center
text_valign : vertical align style - default is text.align_center
text_wrap : text wrap style - default is text.wrap_auto
text_font_family : Text font. Default is
Box
Box object
Fields:
p1 : Diagonal point one
p2 : Diagonal point two
properties : Box properties
textProperties : Box text properties
object : Box object created