4-Year Cycles [jpkxyz]Overview of the Script
I wanted to write a script that encompasses the wide-spread macro fund manager investment thesis: "Crypto is simply and expression of macro." A thesis pioneered by the likes of Raoul Pal (EXPAAM) , Andreesen Horowitz (A16Z) , Joe McCann (ASYMETRIC) , Bob Loukas and many more.
Cycle Theory Background:
The 2007-2008 financial crisis transformed central bank monetary policy by introducing:
- Quantitative Easing (QE): Creating money to buy assets and inject liquidity
- Coordinated global monetary interventions
Proactive 4-year economic cycles characterised by:
- Expansionary periods (low rates, money creation)
- Followed by contraction/normalisation
Central banks now deliberately manipulate liquidity, interest rates, and asset prices to control economic cycles, using monetary policy as a precision tool rather than a blunt instrument.
Cycle Characteristics (based on historical cycles):
- A cycle has 4 seasons (Spring, Summer, Fall, Winter)
- Each season with a cycle lasts 365 days
- The Cycle Low happens towards the beginning of the Spring Season of each new cycle
- This is followed by a run up throughout the Spring and Summer Season
- The Cycle High happens towards the end of the Fall Season
- The Winter season is characterised by price corrections until establishing a new floor in the Spring of the next cycle
Key Functionalities
1. Cycle Tracking
- Divides market history into 4-year cycles (Spring, Summer, Fall, Winter)
- Starts tracking cycles from 2011 (first cycle after the 2007 crisis cycle)
- Identifies and marks cycle boundaries
2. Visualization
- Colors background based on current cycle season
- Draws lines connecting:
- Cycle highs and lows
- Inter-cycle price movements
- Adds labels showing:
- Percentage gains/losses between cycles
- Number of days between significant points
3. Customization Options
- Allows users to customize:
- Colors for each season
- Line and label colors
- Label size
- Background opacity
Detailed Mechanism
Cycle Identification
- Uses a modulo calculation to determine the current season in the 4-year cycle
- Preset boundary years include 2015, 2019, 2023, 2027
- Automatically tracks and marks cycle transitions
Price Analysis
- Tracks highest and lowest prices within each cycle
- Calculates percentage changes:
- Intra-cycle (low to high)
- Inter-cycle (previous high to current high/low)
Visualization Techniques
- Background color changes based on current cycle season
- Dashed and solid lines connect significant price points
- Labels provide quantitative insights about price movements
Unique Aspects
1. Predictive Cycle Framework: Provides a structured way to view market movements beyond traditional technical analysis
2. Seasonal Color Coding: Intuitive visual representation of market cycle stages
3. Comprehensive Price Tracking: Captures both intra-cycle and inter-cycle price dynamics
4. Highly Customizable: Users can adjust visual parameters to suit their preferences
Potential Use Cases
- Technical analysis for long-term investors
- Identifying market cycle patterns
- Understanding historical price movement rhythms
- Educational tool for market cycle theory
Limitations/Considerations
- Based on a predefined 4-year cycle model (Liquidity Cycles)
- Historic Cycle Structures are not an indication for future performance
- May not perfectly represent all market behavior
- Requires visual interpretation
This script is particularly interesting for investors who believe in cyclical market theories and want a visual, data-driven representation of market stages.
Marketcycle

2-Year MA Multiplier [UAlgo]The 2-Year MA Multiplier is a technical analysis tool designed to assist traders and investors in identifying potential overbought and oversold conditions in the market. By plotting the 2-year moving average (MA) of an asset's closing price alongside an upper band set at five times this moving average, the indicator provides visual cues to assess long-term price trends and significant market movements.
🔶 Key Features
2-Year Moving Average (MA): Calculates the simple moving average of the asset's closing price over a 730-day period, representing approximately two years.
Visual Indicators: Plots the 2-year MA in forest green and the upper band in firebrick red for clear differentiation.
Fills the area between the 2-year MA and the upper band to highlight the normal trading range.
Uses color-coded fills to indicate overbought (tomato red) and oversold (cornflower blue) conditions based on the asset's closing price relative to the bands.
🔶 Idea
The concept behind the 2-Year MA Multiplier is rooted in the cyclical nature of markets, particularly in assets like Bitcoin. By analyzing long-term price movements, the indicator aims to identify periods of significant deviation from the norm, which may signal potential buying or selling opportunities.
2-year MA smooths out short-term volatility, providing a clearer view of the asset's long-term trend. This timeframe is substantial enough to capture major market cycles, making it a reliable baseline for analysis.
Multiplying the 2-year MA by five establishes an upper boundary that has historically correlated with market tops. When the asset's price exceeds this upper band, it may indicate overbought conditions, suggesting a potential for price correction. Conversely, when the price falls below the 2-year MA, it may signal oversold conditions, presenting potential buying opportunities.
🔶 Disclaimer
Use with Caution: This indicator is provided for educational and informational purposes only and should not be considered as financial advice. Users should exercise caution and perform their own analysis before making trading decisions based on the indicator's signals.
Not Financial Advice: The information provided by this indicator does not constitute financial advice, and the creator (UAlgo) shall not be held responsible for any trading losses incurred as a result of using this indicator.
Backtesting Recommended: Traders are encouraged to backtest the indicator thoroughly on historical data before using it in live trading to assess its performance and suitability for their trading strategies.
Risk Management: Trading involves inherent risks, and users should implement proper risk management strategies, including but not limited to stop-loss orders and position sizing, to mitigate potential losses.
No Guarantees: The accuracy and reliability of the indicator's signals cannot be guaranteed, as they are based on historical price data and past performance may not be indicative of future results.

Market Cycle Phases IndicatorOverview
The Market Cycle Phases Indicator is a powerful tool designed to help traders identify and visualize the different phases of market cycles. By distinguishing between Accumulation, Uptrend, Distribution, and Downtrend phases, this indicator provides a clear and color-coded representation of market conditions, aiding in better decision-making and strategy development. It is especially useful for long-term investors to observe and understand market cycles over extended periods. The phases are color-coded for easy identification: Green for Accumulation, Blue for Uptrend, Yellow for Distribution, and Red for Downtrend.
Key Features
Identifies four key market phases: Accumulation, Uptrend, Distribution, and Downtrend
Uses a combination of moving averages and volatility measures
Color-coded background for easy visualization of market phases
Adjustable parameters for moving average length, volatility length, and volatility threshold
Plots the moving average and Average True Range (ATR) for reference
Suitable for both short-term trading and long-term investing
Concepts Underlying the Calculations
The calculations behind the Market Cycle Phases Indicator are straightforward, combining the principles of moving averages and volatility measures:
Moving Average (MA): A simple moving average is used to determine the overall trend direction.
Average True Range (ATR): This measures market volatility over a specified period.
Volatility Threshold: A multiplier is applied to the ATR to distinguish between high and low volatility conditions.
How It Works
The indicator first calculates a moving average (MA) of the closing prices and the Average True Range (ATR) to measure market volatility. Based on the position of the price relative to the MA and the current volatility level, the indicator determines the current market phase:
Accumulation Phase: Price is below the MA, and volatility is low (Green background). This phase often indicates a period of consolidation and potential buying interest before an uptrend.
Uptrend Phase: Price is above the MA, and volatility is high (Blue background). This phase represents a strong upward movement in price, often driven by increased buying activity.
Distribution Phase: Price is above the MA, and volatility is low (Yellow background). This phase suggests a period of consolidation at the top of an uptrend, where selling interest may start to increase.
Downtrend Phase: Price is below the MA, and volatility is high (Red background). This phase indicates a strong downward movement in price, often driven by increased selling activity.
How Traders Can Use It
Traders can use the Market Cycle Phases Indicator to:
Identify potential entry and exit points based on market phase transitions.
Confirm trends and avoid false signals by considering both trend direction and volatility.
Develop and refine trading strategies tailored to specific market conditions.
Enhance risk management by recognizing periods of high and low volatility.
Observe long-term market cycles to make informed investment decisions.
Example Usage Instructions
Add the Market Cycle Phases Indicator to your chart.
Adjust the input parameters as needed:
Base Length: Default is 50.
Volatility Length: Default is 14.
Volatility Threshold: Default is 1.5.
Observe the color-coded background to identify the current market phase
Use the identified phases to inform your trading decisions:
Consider buying during the Accumulation or Uptrend phases.
Consider selling or shorting during the Distribution or Downtrend phases.
Combine with other indicators and analysis techniques for comprehensive market insights.
By incorporating the Market Cycle Phases Indicator into your trading toolkit, you can gain a clearer understanding of market dynamics and enhance your ability to navigate different market conditions, making it a valuable asset for long-term investing.

Wall Street Cheat Sheet IndicatorThe Wall Street Cheat Sheet Indicator is a unique tool designed to help traders identify the psychological stages of the market cycle based on the well-known Wall Street Cheat Sheet. This indicator integrates moving averages and RSI to dynamically label market stages, providing clear visual cues on the chart.
Key Features:
Dynamic Stage Identification: The indicator automatically detects and labels market stages such as Disbelief, Hope, Optimism, Belief, Thrill, Euphoria, Complacency, Anxiety, Denial, Panic, Capitulation, Anger, and Depression. These stages are derived from the emotional phases of market participants, helping traders anticipate market movements.
Technical Indicators: The script uses two key technical indicators:
200-day Simple Moving Average (SMA): Helps identify long-term market trends.
50-day Simple Moving Average (SMA): Aids in recognizing medium-term trends.
Relative Strength Index (RSI): Assesses the momentum and potential reversal points based on overbought and oversold conditions.
Clear Visual Labels: The current market stage is displayed directly on the chart, making it easy to spot trends and potential turning points.
Usefulness:
This indicator is not just a simple mashup of existing tools. It uniquely combines the concept of market psychology with practical technical analysis tools (moving averages and RSI). By labeling the psychological stages of the market cycle, it provides traders with a deeper understanding of market sentiment and potential future movements.
How It Works:
Disbelief: Detected when the price is below the 200-day SMA and RSI is in the oversold territory, indicating a potential bottom.
Hope: Triggered when the price crosses above the 50-day SMA, with RSI starting to rise but still below 50, suggesting an early uptrend.
Optimism: Occurs when the price is above the 50-day SMA and RSI is between 50 and 70, indicating a strengthening trend.
Belief: When the price is well above the 50-day SMA and RSI is between 70 and 80, showing strong bullish momentum.
Thrill and Euphoria: Identified when RSI exceeds 80, indicating overbought conditions and potential for a peak.
Complacency to Depression: These stages are identified based on price corrections and drops relative to moving averages and declining RSI values.
Best Practices:
High-Time Frame Focus: This indicator works best on high-time frame charts, specifically the 1-week Bitcoin (BTCUSDT) chart. The longer time frame provides a clearer picture of the overall market cycle and reduces noise.
Trend Confirmation: Use in conjunction with other technical analysis tools such as trendlines, Fibonacci retracement levels, and support/resistance zones for more robust trading strategies.
How to Use:
Add the Indicator: Apply the Wall Street Cheat Sheet Indicator to your TradingView chart.
Analyze Market Stages: Observe the dynamic labels indicating the current stage of the market cycle.
Make Informed Decisions: Use the insights from the indicator to time your entries and exits, aligning your trades with the market sentiment.
This indicator is a valuable tool for traders looking to understand market psychology and make informed trading decisions based on the stages of the market cycle.

Market Time Cycle (Expo)█ Time Cycles Overview
Time cycles are a fascinating and powerful concept in the world of trading and investing. They are all about understanding and predicting the timing of market moves based on the premise that market events and price movements are not random, but instead occur in repeatable, cyclical patterns.
The Concept of Time Cycles: The foundation of time cycles lies in the belief that historical market patterns tend to repeat themselves over specific periods. These periods or cycles could be influenced by a myriad of factors like economic data releases, earnings reports, geopolitical events, or even natural human behavior. For example, some traders observe increased market activity around the start and end of a trading day, which is a form of intraday time cycle.
Understanding time cycles can provide traders with a roadmap, helping them anticipate potential trend shifts and make more informed decisions about when to buy or sell.
█ Indicator Overview
The Market Time Cycle (Expo) is designed to help traders track and analyze market cycles and generate signals for potential trading opportunities. It uses mathematical techniques to analyze market cycles and detect possible turning points. It does this by projecting the estimated cycle timeline and providing visual indications of cyclical phases through the use of color-coded lines and sine wave cycles.
Time cycles offer a compelling way to forecast market trends and time your trades better. By adding time cycles to your trading toolbox, you could potentially gain a new perspective on market movements and refine your trading strategy further. The indicator generates trading signals based on the sine wave's behavior. When the sine wave crosses certain thresholds, the indicator generates a signal suggesting a potential trading opportunity based on cycle behavior.
█ How to use
This indicator can be a valuable tool to help traders understand and predict market trends and time their trades more accurately. By visualizing the cyclic nature of markets, traders can better anticipate potential turning points and adjust their trading strategies accordingly. It helps traders to spot ideal entry and exit points based on the cyclical nature of financial markets.
█ Settings
You can customize the number of bars (NumbOfBars) that are taken into consideration for the cycle. Including a higher number of bars will provide more data, which can be helpful for analyzing long-term trends.
-----------------
Disclaimer
The information contained in my Scripts/Indicators/Ideas/Algos/Systems does not constitute financial advice or a solicitation to buy or sell any securities of any type. I will not accept liability for any loss or damage, including without limitation any loss of profit, which may arise directly or indirectly from the use of or reliance on such information.
All investments involve risk, and the past performance of a security, industry, sector, market, financial product, trading strategy, backtest, or individual's trading does not guarantee future results or returns. Investors are fully responsible for any investment decisions they make. Such decisions should be based solely on an evaluation of their financial circumstances, investment objectives, risk tolerance, and liquidity needs.
My Scripts/Indicators/Ideas/Algos/Systems are only for educational purposes!

timing marketIntraday time cycle . it is valid for nifty and banknifty .just add this on daily basis . ignore previous day data

RSI+ by Wilson (alt)Extension of the excellent RSI+ script by Wilsonlibero. I tweaked the parameters to better fit crypto markets, and I added a few more visuals, such as midline, overbought/oversold threshold lines and areas, background coloration depending on RSI trend above or below midline, and a few other tweaks especially colors (fixed the transp parameter deprecation for example). The color theme is by default more optimized for dark mode charts, but all colors can be configured, and all drawings can be enabled/disabled/tweaked in the parameters.
I'm just giving back to the community since I could modify this script only because it was open-source. If you like this script, please don't give me any credit, but please show some love to the original author Wilsonlibero:

Multiple MAs + No Trend Zone + ATR WidgetThis is my first Pine Script attempt. Nothing special, just an "all in one" for the most common things I use, and what I have found to be the most common in a lot of strategies.
Great for free and limited accounts as it combines 7 total indicators into one.
-- First 5 indicators are Independant Moving Averages:
-Each one can be set for length, as well as source and type (SMA, EMA, SMMA, WMA, VWMA) individually
-- Second type (6th) of indicator is one I find extremly useful for staying OUT of consolidation trading. It's called a "No Trend Zone" indicator I swipped from the Hoffman Startegy. Basically, its set for a small deviation (0.5) of a 35 EMA, which creates a "Band" around the 35 line. When you have this "Band" flat or with no discernable incline/decline, with price action OR some or multiple moving averages inside this banded zone, it typically indicates a zone of consolidation. This will help you identify when you may be in one of those zones, that way you don't get trapped "waiting for paint to dry" before the market starts to move again with your position, and keep you from entering should you be considering the market at that time.
The last indicator is my favorite, and one I will refine a little deeper soon.
-- The ATR widget finishes us out. This widget can be customized for colors, turned on or off, and automatically rounds the ATR (ATR period based on the chart timeframe) to a nice readable number for what you're trading. It has settings to show or not, the length, what rounding style to use (forex pip 0.0001, forex/stock/etf/indicies 0.01) where to show it on the pane, a Multiplier Factor (for stop loss calculations automatically) and the colors.
***NOTE ABOUT ATR WIDGET:
I am primarily a forex trader, so the defaults are for Forex 0.0001. If you see some odd numbers (like 55798 on a current chart), check the inputs tab on the settings, and change the "ATR Style" from "Forex 0.0001" to "Forex/Stock/ETF/Indicies 0.01", and you should arrive with the correct number.

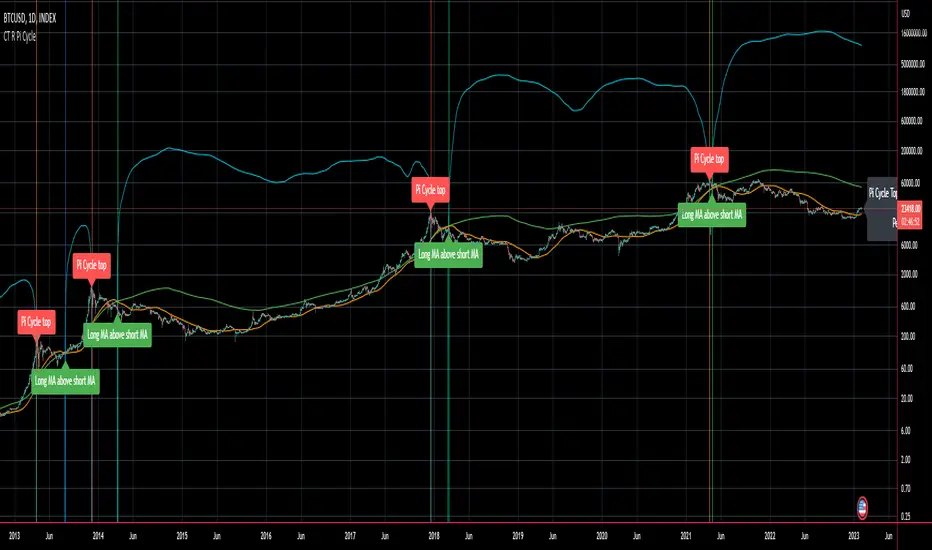
CT Reverse Pi Cycle Bitcoin Top IndicatorIntroducing the Reverse BTC Pi Market Cycle Top indicator
Much respect to Philip Swift the original creator of this idea and big thanks to Tradingview author Ninorigo for sharing the script which this indicator is based on.
Philip Swift has noted that:
Using the x2 multiple of the 350 day moving average along with the 111 day moving average provides an interesting market cycle indicator.
Over the past three market cycles, when the 350DMA x2 crosses below the 111DMA, Bitcoin price peaks in its market cycle, this has been accurate to within three days of Bitcoin price topping out.
Here I have modified an existing script by Tradingview author @Ninorigo which shows the moving averages and gives signals upon crossover by adding the following features:
A function which shows the price at which the 350DMA will Cross Below the 111DMA.
(This is calculated from the prior bar closing data and does not repaint)
An “anticipated cross” function which may give a 1 bar advanced warning of a cross.
(this is calculated from current bar values and may change and repaint)
The crossover levels are shown in an info label to the right of the current price.
When there is a BTC Pi Market Cycle Top anticipated cross on the next bar there will be an orange background signal.
When there is an actual BTC Pi Market Cycle Top cross there will be a red background signal
When there is an anticipated cross back there will be a blue background signal
When there is an actual cross back there will be a green background signal
This indicator will show the appropriate moving averages and crossover information from the daily timeframe regardless of the timeframe you are using.
This should be helpful in more accurately identifying the price level where the Pi Market Cycle moving averages will cross denoting a possible market cycle top.
It is interesting to note:
350 / 111 = 3.153
Which is the closest we can get to Pi when dividing 350 by another whole number.
This is a script to give another view and metric on an interesting experimental idea. This is not financial advice.
ETH Top Cap [jamesray]This script is modified from Top Cap , as published here.
Historically it matches market tops for ETH

Bitcoin Bulls and Bears by @dbtrBitcoin 🔥 Bulls & Bears 🔥
v1.0
This free-of-charge BTC market analysis indicator helps you better understand what's going with Bitcoin from a high-level perspective. At a glance, it will give you an immediate understanding of Bitcoin’s historic price channel dating back to 2011, past and current market cycles, as well as current key support levels.
Usage
Use this indicator with any BTCUSD pairs , ideally with a long price history (such as BNC:BLX )
We recommend to use this indicator in log mode, combined with Weekly or Monthly timeframe.
Features
🕵🏻♂️ Historic price channel curve since 2011
🚨 Bull & bear market cycles (dynamic)
🔥 All-time highs (dynamic)
🌟 Weekly support (dynamic, based on 20 SMA )
💪 Long-term support (channel bottom)
🔝 Potential future price targets (dynamic)
❎ Overbought RSI coloring
📏 Log/non-log support
🌚 Dark mode support
Remarks
With exception of the price channel curve, anything in this indicator is calculated dynamically , including bull/bear market cycles (based on a tweaked 20SMA), ATHs, and so on. As a result, historic market cycles may not be 100% accurately reflected and may also differ slightly in between various time-frames (closest result: Monthly). The indicator may even consider periods of heavy ups/downs as their own market cycles, even though they weren’t. Due to its dynamic nature, this indicator can however adapt to the future and helps you quickly identify potential changes in market structure, even if the indicator is no longer updated.
On top of that bullmarket cycles (colored in green) feature an ingrained RSI: the darker the green color, the more the RSI is overbought and close to a correction (darkest color in the chart = 90 Weekly RSI). In comparison with past bull cycles, it helps you easily spot potential reversal zones.
Thanks
Thanks to @quantadelic and @mabonyi which both have worked on the BTC "growth zones" indicator including the price channel, of which I have used parts of the code as well as the actual price channel data.
Follow me
Follow me here on TradingView to be notified as soon as new free and premium indicators and trading strategies are published. Inquire me for any other requests.
Enjoy & happy trading!

Trading Psychology - Fear & Greed Index by DGTPsychology of a Market Cycle - Where are we in the cycle?
Before proceeding with the question "where", let's first have a quick look at "What is market psychology?"
Market psychology is the idea that the movements of a market reflect the emotional state of its participants. It is one of the main topics of behavioral economics - an interdisciplinary field that investigates the various factors that precede economic decisions. Many believe that emotions are the main driving force behind the shifts of financial markets and that the overall fluctuating investor sentiment is what creates the so-called psychological market cycles - which is also dynamic.
Stages of Investor Emotions:
* Optimism – A positive outlook encourages us about the future, leading us to buy stocks.
* Excitement – Having seen some of our initial ideas work, we begin considering what our market success could allow us to accomplish.
* Thrill – At this point we investors cannot believe our success and begin to comment on how smart we are.
* Euphoria – This marks the point of maximum financial risk. Having seen every decision result in quick, easy profits, we begin to ignore risk and expect every trade to become profitable.
* Anxiety – For the first time the market moves against us. Having never stared at unrealized losses, we tell ourselves we are long-term investors and that all our ideas will eventually work.
* Denial – When markets have not rebounded, yet we do not know how to respond, we begin denying either that we made poor choices or that things will not improve shortly.
* Fear – The market realities become confusing. We believe the stocks we own will never move in our favor.
* Desperation – Not knowing how to act, we grasp at any idea that will allow us to get back to breakeven.
* Panic – Having exhausted all ideas, we are at a loss for what to do next.
* Capitulation – Deciding our portfolio will never increase again, we sell all our stocks to avoid any future losses.
* Despondency – After exiting the markets we do not want to buy stocks ever again. This often marks the moment of greatest financial opportunity.
* Depression – Not knowing how we could be so foolish, we are left trying to understand our actions.
* Hope – Eventually we return to the realization that markets move in cycles, and we begin looking for our next opportunity.
* Relief – Having bought a stock that turned profitable, we renew our faith that there is a future in investing.
It's hard to predict with certainty where we exactly are in the market cycle, we can only make an educated guess as to the rough stage based on data available. And here comes the study "Trading Psychology - Fear & Greed Index"
Factors taken into account in this study include:
1-Price Momentum : Price Divergence/Convergence versus its Slow Moving Average
2-Strenght : Rate of Return (RoR) also called Return on Investment (ROI) is a performance measure used to evaluate the efficiency of an investment, net gain or loss of an investment over a specified time period, the rate of change in price movement over a period of time to help investors determine the strength
3-Money Flow : Chaikin Money Flow (CMF) is a technical analysis indicator used to measure Money Flow Volume over a set period of time. CMF can be used as a way to further quantify changes in buying and selling pressure and can help to anticipate future changes and therefore trading opportunities. CMF calculations is based on Accumulation/Distribution
4-Market Volatility : CBOE Volatility Index (VIX), the Volatility Index, or VIX, is a real-time market index that represents the market's expectation of 30-day forward-looking volatility. Derived from the price inputs of the S&P 500 index options, it provides a measure of market risk and investors' sentiments. It is also known by other names like "Fear Gauge" or "Fear Index." Investors, research analysts and portfolio managers look to VIX values as a way to measure market risk, fear and stress before they take investment decisions
5-Safe Haven Demand : in this study GOLD demand is assumed
What to look for :
*Fear and Greed Index as explained above,
*Divergencies
Tool tip of the label displayed provides details of references
Conclusion:
As investors, we always get caught up in the day to day price movements, and lose sight of the bigger picture. The biggest crashes happen not when investors are cautious and fearful, it's when they're euphoric and expecting financial instruments to continue going higher. So as we continue investing, don’t forget to stop and ask yourself, where in the chart do you think we are right now? The Market Psychology Cycle shines light on how emotions evolve, fear and greed index can come in handy, provided that it is not the only tool used to make investment decisions. It is easy to look back at market cycles and recognize how the overall psychology changed. Analyzing previous data makes it obvious what actions and decisions would have been the most profitable. However, it is much harder to understand how the market is changing as it goes - and even harder to predict what comes next. Many investors use technical analysis (TA) to attempt to anticipate where the market is likely to go. Investors are advised to keep tabs on fear for potential buying the dips opportunities and view periods of greed as a potential indicator that financial instruments might be overvalued.
Warren Buffett's quote, buy when others are fearful, and sell when others are greedy
Trading success is all about following your trading strategy and the indicators should fit within your trading strategy, and not to be traded upon solely
Disclaimer : The script is for informational and educational purposes only. Use of the script does not constitute professional and/or financial advice. You alone have the sole responsibility of evaluating the script output and risks associated with the use of the script. In exchange for using the script, you agree not to hold dgtrd TradingView user liable for any possible claim for damages arising from any decision you make based on use of the script

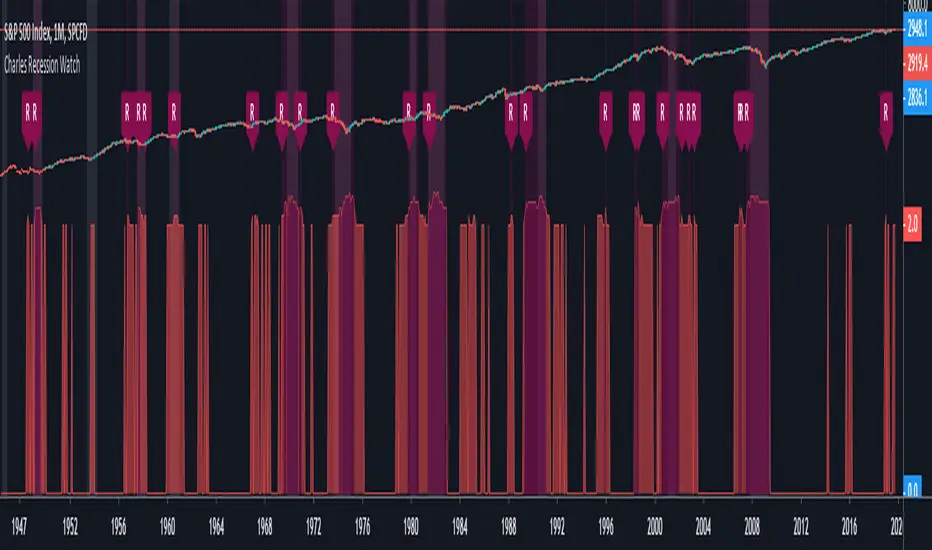
Charles Recession WatchThe “Recession Watch” indicator tracks 7 key economic metrics which have historically preceded US recessions. It provides a real-time indication of incoming recession risk.
This indicator gives a picture of when risk is increasing, and therefore when you might want to start taking some money out of risky assets.
All of the last seven recessions were preceded by a risk score of 3 or higher. Six of them were preceded by a risk score of 4 or higher. Unfortunately data prior to 1965 was inconsistent and prior recessions could not be considered.
Based on the indicator hit rate at successfully flagging recessions over the last 50 years, risk scores have the following approximate probabilities of recession:
- 0-1: Low
- 2: 25% within next 18 months
- 3: 30% within next 12 months
- 4-7: 50% within next 12 months
Note that a score of 3 is not necessarily a cause for panic. After all, there are substantial rewards to be had in the lead up to recessions (averaging 19% following yield curve inversion). For the brave, staying invested until the score jumps to 4+, or until the S&P500 drops below the 200day MA, will likely yield the best returns.
Notes on use:
- use MONTHLY time period only (the economic metrics are reported monthly)
- If you want to view the risk Score (1-7) you need to set your chart axis to "Logarithmic"
Enjoy and good luck!
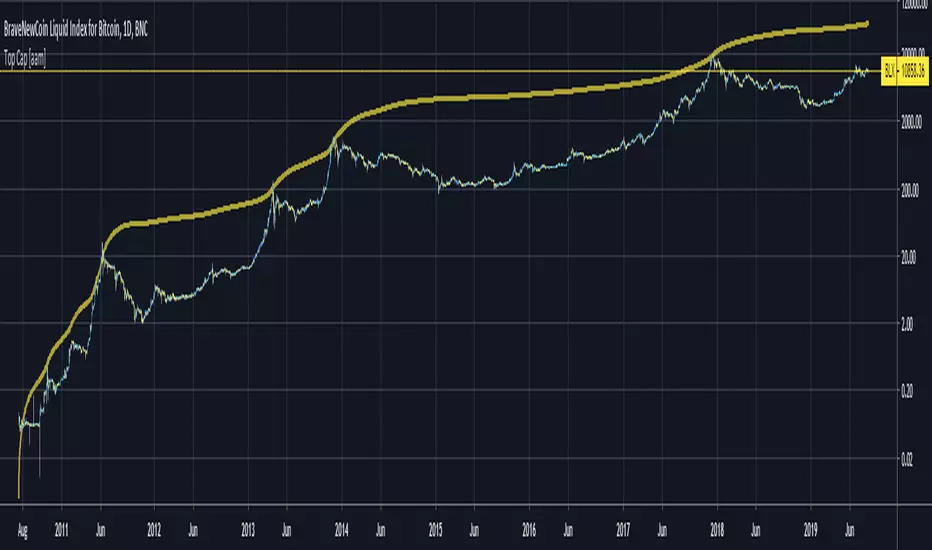
Top Cap [aamonkey]Historically matched market tops for BTC.
It's the Average Cap (see my other indicator) multiplied by 35.
The default settings are for BTC.
If you want to test this indicator on another chart you have to change the launch date settings (and maybe play around with the multiplier).
Some Interesting Launch dates:
- BTC: 3 JAN 2009
- ETH: 30. JUL 2015
- LTC: 7. OCT 2011
TOP & BOTTOM Cycle [aamonkey]Works best on BTC and only on the daily timeframe!
This is a TOP / BOTTOM indicator for big market cycles.
These tops and bottoms are based on the difference between the 200MA on the daily and the price.

Bitcoin Price User Correlation [aamonkey]You can only use this for BTC.
Bitcoin over time tends to be priced at 7000 times the number of users (in terms of market cap).
Calculation:
Number of Wallets*7000/(Circulating Supply or 21,000,000)
Settings:
You can decide whether you want to use the Circulating Supply or 21,000,000 as a reference.
The default settings are using 21,000,000 because it seems to be more accurate.
You can easily switch between both versions by checking the box in the settings.
Interesting Findings:
Using circulating supply:
- Most of the time we are under the estimated ("PUC") line
- Once we break above the PUC line we are in the parabolic phase of the Bullrun
- In history, we broke only 4 times above the PUC
- Once we are above the PUC we see crazy growth (parabolic phase)
- We don't spend much time above the PUC
- From breaking the PUC to the new All-Time High of the cycle we took in order: 3 Days, 7 Days, 22 Days, 30 Days
- So the trend is increasing (We are taking more and more time until we see the ATH)
- Currently, we are about to break the PUC
- Then I expect the parabolic phase to begin
- I expect the run to last about 30 days
