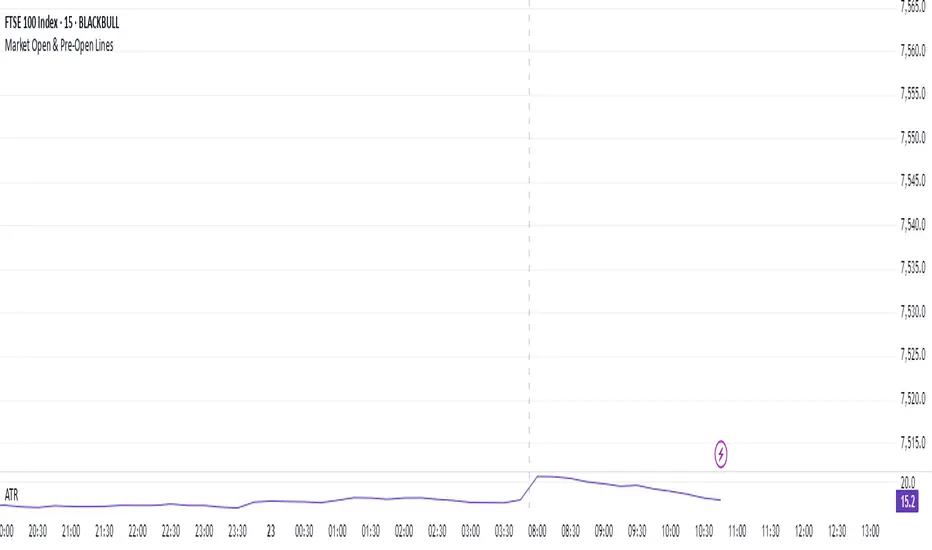
Market Open & Pre-Open Linesversion 1.0 2025-04-23
Stated vertical line for market open and pre-market open. Market option include US, EU, UK, JP and AU. This line do auto-defined during daylight saving time. This help for those trade during market open and benefit for those doing backtest on it.
Marketanalysis
Market Session Boxes with Volume Delta [algo_aakash]This script highlights four key forex trading sessions — Tokyo, London, New York, and Sydney — by drawing color-coded boxes directly on the chart. For each session, it shows:
High and low of the session
Total volume traded
Volume delta (bullish vs bearish pressure)
Optional extension of session highs/lows into future candles
Cleanly labeled time range and stats
Users can:
Select which sessions to display
Customize session times (in UTC+0)
Choose colors per session
Toggle session labels and extension lines
Use Case: Designed to help intraday and short-term traders visualize market rhythm, liquidity zones, and session-based volatility. The volume delta metric adds an extra layer of sentiment analysis.
This tool works best on intraday timeframes like 15m, 30m, or 1H.
Disclaimer:
This indicator is for educational and visual analysis purposes. It does not constitute trading advice or guarantee results. Always conduct your own analysis before making trading decisions.

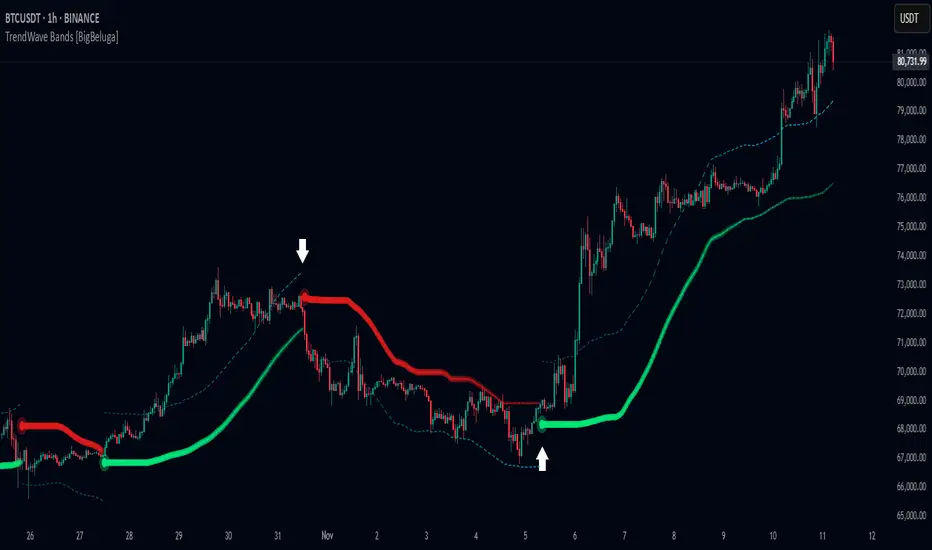
TrendWave Bands [BigBeluga]This is a trend-following indicator that dynamically adapts to market trends using upper and lower bands. It visually highlights trend strength and duration through color intensity while providing additional wave bands for deeper trend analysis.
🔵Key Features:
Adaptive Trend Bands:
➣ Displays a lower band in uptrends and an upper band in downtrends to indicate trend direction.
➣ The bands act as dynamic support and resistance levels, helping traders identify potential entry and exit points.
Wave Bands for Additional Analysis:
➣ A dashed wave band appears opposite the main trend band for deeper trend confirmation.
➣ In an uptrend, the upper dashed wave band helps analyze momentum, while in a downtrend, the lower dashed wave band serves the same purpose.
Gradient Color Intensity:
➣ The trend bands have a color gradient that fades as the trend continues, helping traders visualize trend duration.
➣ The wave bands have an inverse gradient effect—starting with low intensity at the trend's beginning and increasing in intensity as the trend progresses.
Trend Change Signals:
➣ Circular markers appear at trend reversals, providing clear entry and exit points.
➣ These signals mark transitions between bullish and bearish phases based on price action.
🔵Usage:
Trend Following: Use the lower band for confirmation in uptrends and the upper band in downtrends to stay on the right side of the market.
Trend Duration Analysis: Gradient wavebands give an idea of the duration of the current trend — new trends will have high-intensity colored wavebands and as time goes on, trends will fade.
Trend Reversal Detection: Circular markers highlight trend shifts, making it easier to spot entry and exit opportunities.
Volatility Awareness: Volatility-based bands help traders adjust their strategies based on market volatility, ensuring better risk management.
TrendWave Bands is a powerful tool for traders seeking to follow market trends with enhanced visual clarity. By combining trend bands, wave bands, and gradient-based color scaling, it provides a detailed view of market dynamics and trend evolution.
Volume Profile & Smart Money Explorer🔍 Volume Profile & Smart Money Explorer: Decode Institutional Footprints
Master the art of institutional trading with this sophisticated volume analysis tool. Track smart money movements, identify peak liquidity windows, and align your trades with major market participants.
🌟 Key Features:
📊 Triple-Layer Volume Analysis
• Total Volume Patterns
• Directional Volume Split (Up/Down)
• Institutional Flow Detection
• Real-time Smart Money Tracking
• Historical Pattern Recognition
⚡ Smart Money Detection
• Institutional Trade Identification
• Large Block Order Tracking
• Smart Money Concentration Periods
• Whale Activity Alerts
• Volume Threshold Analysis
📈 Advanced Profiling
• Hourly Volume Distribution
• Directional Bias Analysis
• Liquidity Heat Maps
• Volume Pattern Recognition
• Custom Threshold Settings
🎯 Strategic Applications:
Institutional Trading:
• Track Big Player Movements
• Identify Accumulation/Distribution
• Follow Smart Money Flow
• Detect Institutional Trading Windows
• Monitor Block Orders
Risk Management:
• Identify High Liquidity Windows
• Avoid Thin Market Periods
• Optimize Position Sizing
• Track Market Participation
• Monitor Volume Quality
Market Analysis:
• Volume Pattern Recognition
• Smart Money Flow Analysis
• Liquidity Window Identification
• Institutional Activity Cycles
• Market Depth Analysis
💡 Perfect For:
• Professional Traders
• Volume Profile Traders
• Institutional Traders
• Risk Managers
• Algorithmic Traders
• Smart Money Followers
• Day Traders
• Swing Traders
📊 Key Metrics:
• Normalized Volume Profiles
• Institutional Thresholds
• Directional Volume Split
• Smart Money Concentration
• Historical Patterns
• Real-time Analysis
⚡ Trading Edge:
• Trade with Institution Flow
• Identify Optimal Entry Points
• Recognize Distribution Patterns
• Follow Smart Money Positioning
• Avoid Thin Markets
• Capitalize on Peak Liquidity
🎓 Educational Value:
• Understand Market Structure
• Learn Volume Analysis
• Master Institutional Patterns
• Develop Market Intuition
• Track Smart Money Flow
🛠️ Customization:
• Adjustable Time Windows
• Flexible Volume Thresholds
• Multiple Timeframe Analysis
• Custom Alert Settings
• Visual Preference Options
Whether you're tracking institutional flows in crypto markets or following smart money in traditional markets, the Volume Profile & Smart Money Explorer provides the deep insights needed to trade alongside the biggest players.
Transform your trading from retail guesswork to institutional precision. Know exactly when and where smart money moves, and position yourself ahead of major market shifts.
#VolumeProfile #SmartMoney #InstitutionalTrading #MarketAnalysis #TradingView #VolumeAnalysis #CryptoTrading #ForexTrading #TechnicalAnalysis #Trading #PriceAction #MarketStructure #OrderFlow #Liquidity #RiskManagement #TradingStrategy #DayTrading #SwingTrading #AlgoTrading #QuantitativeTrading

Relative Volume Index [PhenLabs]Relative Volume Index (RVI)
Version: PineScript™ v6
Description
The Relative Volume Index (RVI) is a sophisticated volume analysis indicator that compares real-time trading volume against historical averages for specific time periods. By analyzing volume patterns and statistical deviations, it helps traders identify unusual market activity and potential trading opportunities. The indicator uses dynamic color visualization and statistical overlays to provide clear, actionable volume analysis.
Components
• Volume Comparison: Real-time volume relative to historical averages
• Statistical Bands: Upper and lower deviation bands showing volume volatility
• Moving Average Line: Smoothed trend of relative volume
• Color Gradient Display: Visual representation of volume strength
• Statistics Dashboard: Real-time metrics and calculations
Usage Guidelines
Volume Strength Analysis:
• Values > 1.0 indicate above-average volume
• Values < 1.0 indicate below-average volume
• Watch for readings above the threshold (default 6.5x) for exceptional volume
Trading Signals:
• Strong volume confirms price moves
• Divergences between price and volume suggest potential reversals
• Use extreme readings as potential reversal signals
Optimal Settings:
• Start with default 15-bar lookback for general analysis
• Adjust threshold (6.5x) based on market volatility
• Use with multiple timeframes for confirmation
Best Practices:
• Combine with price action and other indicators
• Monitor deviation bands for volatility expansion
• Use the statistics panel for precise readings
• Pay attention to color gradients for quick assessment
Limitations
• Requires quality volume data for accurate calculations
• May produce false signals during pre/post market hours
• Historical comparisons may be skewed during unusual market conditions
• Best suited for liquid markets with consistent volume patterns
Note: For optimal results, use in conjunction with price action analysis and other technical indicators. The indicator performs best during regular market hours on liquid instruments.

ADR (Log Scale) with MTF LabelsHere's a detailed presentation of the Average Daily Range (ADR) indicator, with a focus on its advantages compared to the classic ADR, its unique features, utility, and interpretation:
Advantages Compared to Classic ADR
1. Logarithmic Scale: Unlike the classic ADR, which uses a linear scale, this version uses a logarithmic scale for calculations. This approach provides a more accurate representation of relative price movements, especially for assets with large price ranges.
2. Multi-Timeframe Analysis: This enhanced ADR indicator allows traders to view daily, weekly, and monthly ADRs simultaneously. This multi-timeframe capability helps traders understand volatility trends over different periods, offering a more comprehensive market analysis.
3. Optional Smoothing: The inclusion of an optional smoothing feature (using Exponential Moving Average, EMA) helps reduce noise in the data. This makes the indicator more reliable by filtering out short-term fluctuations and highlighting the underlying volatility trend.
4. Information Display Labels: The indicator includes labels that display precise ADR values for each timeframe directly on the chart. This feature provides immediate, clear insights without requiring additional calculations or references.
Utility of the Indicator
1. Volatility Analysis: The ADR indicator is essential for assessing market volatility. By showing the average daily price range, it helps traders gauge how much an asset typically moves within a day, week, or month.
2. Risk Management: ADR levels can be used to set stop-loss points, improving risk management strategies. Knowing the average range helps traders avoid setting stops too close to the current price, which might otherwise be triggered by normal market fluctuations.
3. Setting Realistic Targets: By understanding the average daily range, traders can set more realistic profit targets. This helps in avoiding over-ambitious goals that are unlikely to be reached within the typical market movement.
4. Identifying Entry and Exit Points: The ADR can signal potential entry and exit points. For example, if the price approaches the upper or lower ADR boundary, it might indicate an overbought or oversold condition, respectively.
Interpretation and Examples
1. Increasing Volatility: If the ADR is increasing, it indicates rising market volatility. Traders might adjust their strategies accordingly, such as widening their stop-losses to accommodate larger price swings.
2. Range Breakout: If the price significantly exceeds the daily ADR, it may signal a strong trend or exceptional market movement. Traders can use this information to stay in the trade longer or to anticipate a potential reversal.
3. Mean Reversion: Prices often revert to the ADR mean. A trader might consider mean reversion trades when the price approaches the extremes of the ADR range, expecting it to move back towards the average.
4. Multi-Timeframe Comparison: If the daily ADR is higher than the weekly ADR, it may indicate unusually high short-term volatility. This can be a signal for traders to be cautious or to capitalize on the increased movement.
While the ADR indicator provides valuable insights into market volatility and can significantly enhance trading strategies, it is essential to remember that no indicator is foolproof. Market conditions can change rapidly, and past performance is not always indicative of future results. Traders should use the ADR indicator in conjunction with other tools and follow sound risk management practices to protect their capital.

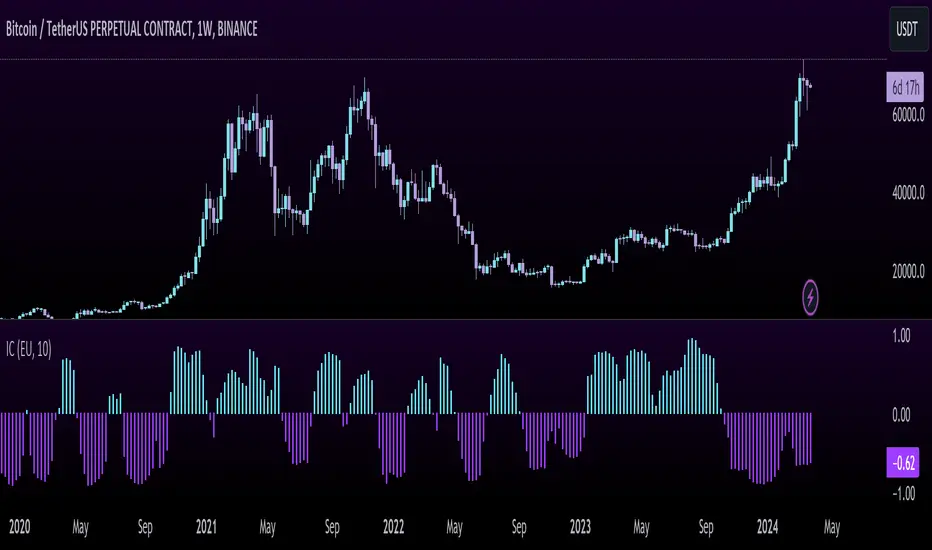
Inflation CorrelationHeyo fellas,
In today’s dynamic economic landscape, understanding the relationship of market prices to other economical factors like inflation rate is crucial. The Inflation Correlation Indicator is designed to provide traders with a clear visualization of this relationship. By correlating average inflation rates from selected countries with market closing prices, this indicator offers a unique perspective on potential market movements influenced by inflationary trends.
Features:
Country Selection: Choose from the European Union (EU), Germany (DE), or the United States (US) to tailor the correlation analysis to your specific market interest.
Correlation Length Customization: Adjust the correlation length to refine the sensitivity of the indicator to recent inflation data.
Visual Clarity: The correlation histogram changes color based on the direction of the correlation, providing an intuitive understanding of the inflation correlation.
Whether you’re a fundamental analyst seeking to incorporate macroeconomic indicators into your strategy or a trader looking for an edge in inflation-sensitive markets, the Inflation Correlation Indicator is an indispensable tool in your TradingView arsenal.
Thanks for checking this out!
Best regards,
simwai
Market Performance TableThe Market Performance Table displays the performance of multiple tickers (up to 5) in a table format. The tickers can be customized by selecting them through the indicator settings.
The indicator calculates various metrics for each ticker, including the 1-day change percentage, whether the price is above the 50, 20, and 10-day simple moving averages (SMA), as well as the relative strength compared to the 10/20 SMA and 20/50 SMA crossovers. It also calculates the price deviation from the 50-day SMA.
The table is displayed on the chart and can be positioned in different locations.
Credits for the idea to @Alex_PrimeTrading ;)

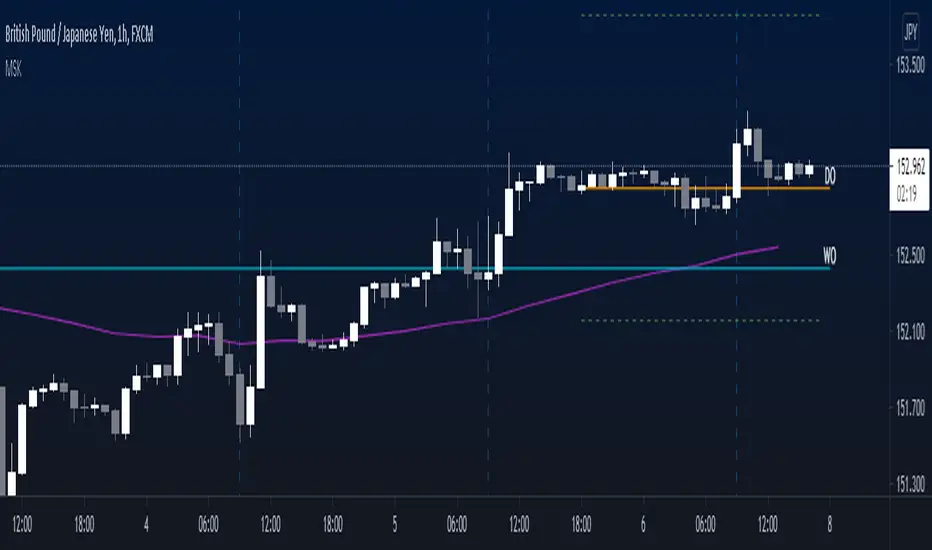
Market Swiss KnifeSimple script, helpful to analyse the current conditions of the market and make your own decisions. It's not a signal indicator
* Shows an EMA to help you identify the trend
* Uses the ATR to plot two lines below (current low + ATR) and above (current high - ATR) the current candle. Useful to see whether the market is overextended or find possible targets
* Plots a vertical line showing NY, Tokyo and London session opens
* Includes a position size calculator to calculate your desired lot size (works in forex and gold)
3GBH BTC DOM vs MCBitcoin Market Cap vs Dominance
- data normalized with RSI
Included in this indicator:
- RSI of BTC Market Cap
- RSI of BTC Dominance
- EMA of BTC Market Cap
- EMA of BTC Domiance
-----
Dominance influences the market. Is money flowing into Bitcoin?
-----
EMA's to help with Technical Analysis.
-----
User-friendly.
You can change all the inputs, they are labelled for ease-of-use.
You can toggle On/Off any or all of the options.

{Gunzo} Bulls Power vs. Bears PowerBulls Power vs. Bears Power is a unique tool that displays on each candle the balance between the bears (sellers) and the bulls (buyers).
OVERWIEW :
This indicator is mainly based on the popular indicator “Elder ray” made by Dr. Alexander Elder in 1989. This indicator has been developed in order to determine the strength of the competing groups of buyers and sellers in the markets.
CALCULATION :
To measure the competing power of bulls and bears, the indicator compares the current high (maximum power of the bulls) and current low (maximum power of the bears) to the average price using a exponential moving average.
Bull Power = Current High – EMA 13 (closing)
Bear Power = Current Low – EMA 13 (closing)
This Elder ray indicator can also tell us more information about market conditions :
If the current high and current low are above the EMA 13, the bulls are totally in control on the market
If the current high and current low are under the EMA 13, the bears are totally in control of the market
If the EMA 13 is in between of the current high and current low, there is strong fight about controlling the market, there is possible reversal in this configuration
SETTINGS :
Fast MA Period : Fast moving average period (only used for buy sell signal)
Slow MA Period : Slow moving average period (only used for buy sell signal)
Display candle labels : Show/hide candle labels on the chart
Display only bear labels above X : Exclude all top candle labels on the chart below the value specified.
Display only bull labels above X : Exclude all bottom candle labels on the chart below the value specified.
Display opposite values : Show all candle labels on top (bearish) and bottom (bullish) or only show the candle labels for the winning force on the candle.
Display box for last candle : Show/hide the dominance boxes (red and blue) after last candle showing the last bear and bull power.
Display box after X candles : How many candles in the future the dominance boxes should be displayed.
Display slow / fast crossover (o) : Display crossover signals (circles) between fast line and slow line.
Display bear / bull fighting (x) : Display fighting signals (crosses) between bull and bears.
VISUALIZATIONS :
This indicator has 3 possible complementary visualizations:
Candle labels : The labels on top are the percentage of the bears on the candle, while the labels on the bottom are the percentage of the bulls on the candle. When the bulls are winning the labels are blue, when the bears are winning the labels are red, silver otherwise.
Box after last candle : The blue and red boxes after the last candle are the percentage of bears and bulls on the last candle of the chart. That boxes can be disabled in the settings if you feel it is redundant with the labels.
Signals : The signals are displayed at the bottom of the main area of trading. The orange “x” represents an area where bulls and bears are fighting hard. The blue “o” represents a buy signal (fast line crosses over the slow line) and the red “o” represents a sell sinal (fast line crosses under the slow line).
USAGE :
The most important rule in the usage of this indicator is :
“The higher the current bull power is (or bear power), the higher the chances are the next candle will also be bullish (or bearish).”
When the prices is increasing, it is very interesting to follow the bull power to verify that it is either stable or increasing. If the bull power keeps decreasing candle after candle, there is chances that in the next candles there will be a reversal.
When there is orange crosses in the signal area (bottom of the screen), it means that there is a big fight between bulls and bears and that the current price of the asset is probably stable. During these fighting areas, reversals are more likely to happen.
When there is a blue circle in the signal area (or red signal), it can be considered as a buy signal (or sell signal). These signals are determined by the crossover of the fast and slow lines of the total power of the bulls plus the bears.
LIMITATIONS :
As Pine script only allows to display about 50 drawings on the chart, the labels on the candles can not be printed on all the historical candles. The option “Display opposites” could be useful to hide unnecessary labels and then be able to display more older labels.
As the Elder ray indicator uses an average price (EMA 13 of closing price), the indicator may be lagging in some situations, but most of the time it will help to filter the bad signals contrary to the indicators that are too reactive.

Trending/RangingThis script is a useful tool to use to identify the current market. It includes three other indicators:
1. ATR (combined with a SMA of the ATR)
2. ADX
3. RSI
It allows you to filter for when the market is trending vs. when the market is ranging by using any of the three indicators. You can also combine them to find extremely good trends to trade, or if you're a channel trader, identify when you wouldn't want to trade. This indicator also includes a time frame setting to allow you to ZOOM OUT and explore the long term trend of the security you are trading. I highly recommend using this indicator as a filter for when you enter a trade or not depending on the system you like to trade.

GMS: Market Performance IndicatorThis is just an easy way to visualize what the market's performance is (in price or percent) in any given session for any chosen time frame. The magnitude of price moves are not the same today as they were 50 years ago, which is why I included the percent selection to better compare historical movements. Time frame selections are Daily, Weekly, Monthly, Quarterly, and Yearly. I added in a little background highlight to show the start of a new session as well.
The source code is open so feel free to poke around!
Hope this helps,
Andre

Average True Range ShiftThis indicator builds on the idea of the Average True Range (ATR) as a way of measuring volatility. It uses two different ATRs to show a shift in market volatility.
It is mainly composed of two moving averages of ATR. One fast moving, which looks back at the previous 5 periods. One slow moving, which looks back at the previous 21 periods. Both ATRs have been normalized (show percentage instead of an absolute amount). The third component of this indicator is the histogram that is created by subtracting the slow moving average, from the fast moving average.
By having two ATRs of different lengths, traders can see how short term volatility compares to long term volatility, and how it is shifting over time. When the fast-moving crosses above the slow-moving, it will show a positive value on the histogram, meaning that short term volatility is increasing and higher than normal. When it crosses below, it will show a negative value on the histogram, meaning that short term volatility is decreasing, and lower than normal.
There are a variety of ways to utilize this indicator, and it will work in most markets. I find it is best to analyze macro market conditions on daily charts and above, rather than micro intraday moves.

Gopalakrishnan Range IndexThis indicator was originally developed by Jayanthi Gopalakrishnan (Stocks & Commodities, V.19:1 (January, 2001): "Gopalakrishnan Range Index").
Like and follow for more open source indicators!
Happy Trading!
