Correlation MA – 15 Assets + Average (Optional)This indicator calculates the moving average of the correlation coefficient between your charted asset and up to 15 user-selected symbols. It helps identify uncorrelated or inversely correlated assets for diversification, pair trading, or hedging.
Features:
✅ Compare your current chart against up to 15 assets
✅ Toggle assets on/off individually
✅ Custom correlation and MA lengths
✅ Real-time average correlation line across enabled assets
✅ Horizontal lines at +1, 0, and -1 for easy visual reference
Ideal for:
Portfolio diversification analysis
Finding low-correlation stocks
Mean-reversion & pair trading setups
Crypto, equities, ETFs
To use: set the benchmark chart (e.g. TSLA), choose up to 15 assets, and adjust settings as needed. Look for assets with correlation near 0 or negative values for uncorrelated performance.
Management

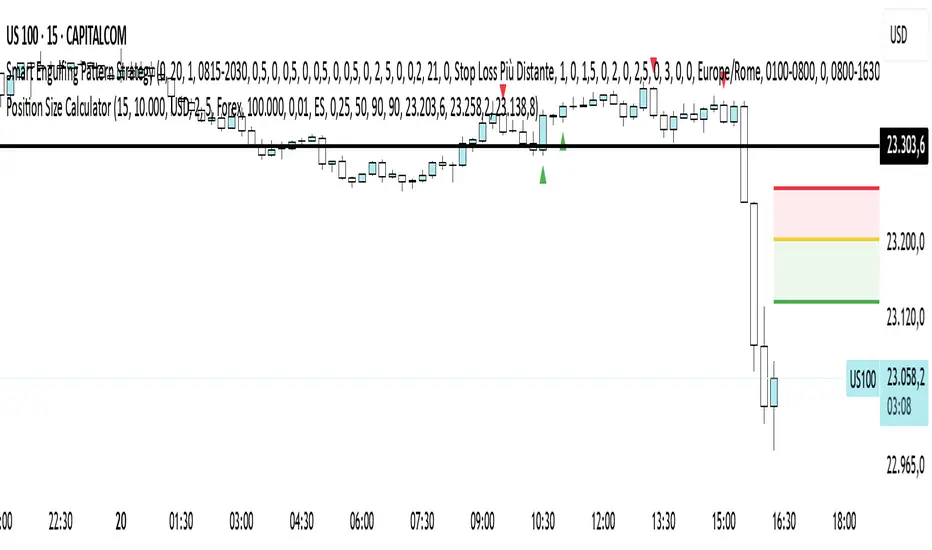
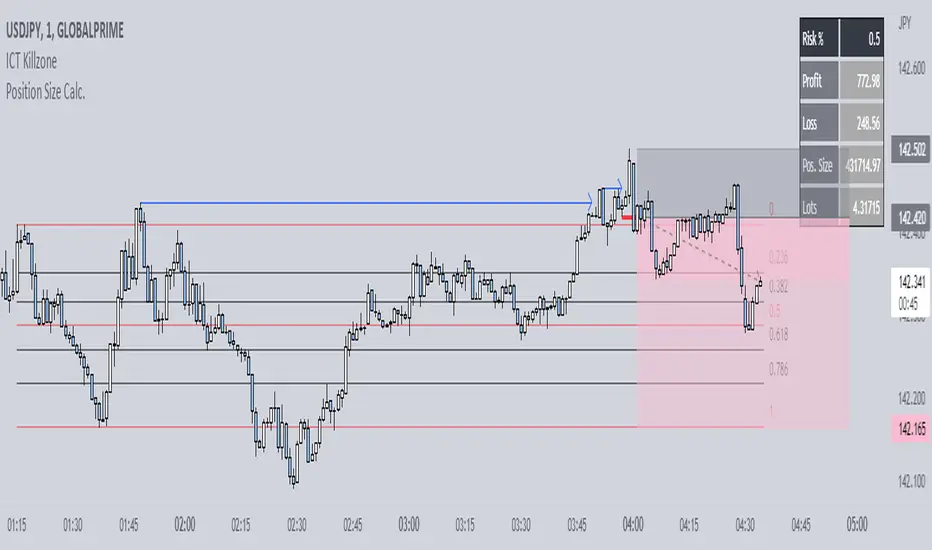
Position Size CalculatorPosition Size Calculator - User Guide
A simple tool to calculate optimal position size based on your risk preferences, visualize trade levels, and automatically determine trade direction.
Introduction
The Position Size Calculator is a TradingView indicator designed to help traders calculate the optimal position size for their trades based on account size and risk tolerance. This tool visually represents entry, stop loss, and take profit levels while automatically calculating the appropriate position size to maintain consistent risk management.
Getting Started
Setting Up Your Account Parameters
Setting Price Levels
Understanding the Visual Elements
Adjusting Your Trade on the Chart
Reading the Information Panel
1. Getting Started
After adding the indicator to your chart, you'll see three horizontal lines representing:
Yellow line: Entry price
Green line: Take profit price
Red line: Stop loss price
The indicator automatically detects whether you're planning a Long or Short trade based on the position of your take profit relative to your entry.
2. Setting Up Your Account Parameters
In the "Position Calculator" settings group:
Account Size : Enter your total account balance
Account Currency : Set your account currency (USD, EUR, etc.)
Risk (%) : Enter the percentage of your account you're willing to risk per trade (e.g., 2%)
Instrument Type : Select your trading instrument (Forex, Futures, Stocks, or Crypto)
Value per 0.01 lot per tick : Enter the value of 0.01 lots per tick (for most Forex pairs, this is $1 per pip for 0.01 lot)
Minimum Lot Size : Set the minimum lot size allowed by your broker (usually 0.01 for Forex)
3. Setting Price Levels
In the "Price Levels" section:
Entry Price : The price at which you plan to enter the trade
Stop Loss Price : Where you'll exit if the trade goes against you
Take Profit Price : Your target price where you'll take profits
If you set Entry Price to 0, it will default to the current price. If Stop Loss or Take Profit are set to 0, they'll default to 5% below or above entry price respectively.
4. Understanding the Visual Elements
Yellow line : Your entry price
Green line : Your take profit level
Red line : Your stop loss level
Green zone : The profit zone (between entry and take profit)
Red zone : The loss zone (between entry and stop loss)
Information panel : Shows all calculations and trade details
5. Adjusting Your Trade on the Chart
The beauty of this tool is its interactivity:
You can drag any of the lines directly on the chart to adjust entry, stop loss, or take profit
If you drag the take profit above the entry , the indicator automatically sets up for a Long trade
If you drag the take profit below the entry , it automatically configures for a Short trade
All calculations and visuals update in real-time as you adjust the lines
This means you can quickly test different scenarios and see how they affect your position size and potential profit/loss.
6. Reading the Information Panel
The information panel displays:
Account details : Your account size and currency
Risk information : Your percentage risk and the equivalent monetary amount
Position Size : The optimal lot size calculated based on your risk parameters
Price levels : Entry, Stop Loss, and Take Profit with distances in ticks
Risk/Reward ratio : Shown as 1:X (where X is the reward relative to 1 unit of risk)
Potential outcomes : The exact amount you stand to gain or lose on this trade
Trade direction : Whether this is a Long or Short trade
Visual Settings
You can customize the appearance in the "Visual" settings group:
Adjust colors for profit and loss zones
Change the transparency of colored zones
Toggle the filling of spaces between lines
Adjust how far the lines extend beyond the last candle
Practical Tips
Always double-check your "Value per 0.01 lot per tick" setting for the specific instrument you're trading
For Forex major pairs, the standard is usually $1 per pip for 0.01 lots
For other instruments, consult your broker's specifications
The indicator works best when you place your stop loss at a logical market level (support/resistance, swing high/low) rather than a fixed percentage
Final Thoughts
This Position Size Calculator helps remove emotion from your trading by objectively calculating your position size based on your predefined risk parameters. It ensures that you maintain consistent risk across all your trades, regardless of the stop loss distance, which is a key component of successful risk management.
Remember: The most important goal in trading is capital preservation. This tool helps you ensure that each trade risks only what you've decided is acceptable for your trading strategy.
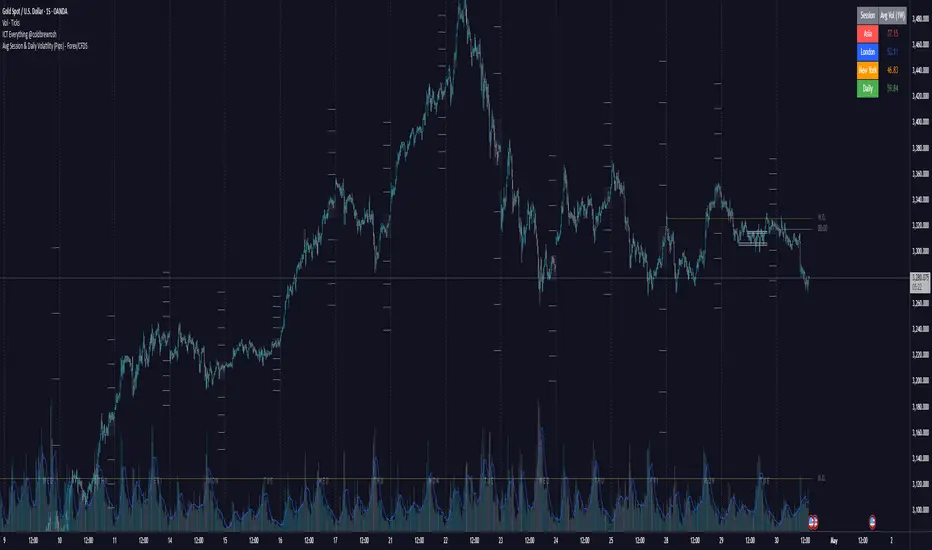
Avg Session & Daily Volatility (Pips) - Forex/CFDS🔍 Overview
The Avg Session & Daily Volatility (Pips) indicator measures the average High–Low range (volatility) of three major Forex sessions—Asia, London, New York—and the entire trading day, then displays the results in a compact overlay table.
⚙️ Key Features
Session Windows
Asia: Default 23:00 – 07:00 server time
London: 07:00 – 16:00
New York: 13:00 – 22:00
Daily Range
– Tracks the full High–Low from midnight to midnight.
Flexible Lookback
– Choose 1W / 2W / 4W / 8W (≈ 5 / 10 / 20 / 40 trading days)
Pip Conversion
Forex Pairs: 1 pip = 0.0001 → (ticks / mintick) / 10
XAU/USD (Gold): 1 pip = 1 USD → direct price difference
Custom Styling
– Pick your own colors per session & daily
– Table position: Left/Center/Right × Top/Middle/Bottom
📈 Benefits & Use Cases
Optimal Stop-Loss & Take-Profit
Gauge each session’s typical movement to size SL/TP appropriately.
Intraday Performance Check
Compare your real-time trade swings against historical averages.
Risk Management
Align position sizes with average volatility to control risk.
Multi-Asset Support
Works seamlessly for major Forex pairs and Gold (XAU/USD) thanks to smart pip logic.
🚀 How It Works
Session Scanning – Continuously tracks the session’s high and low.
Array Storage – At session close, calculates range in pips and pushes it into a rolling buffer.
Averaging – Computes the arithmetic mean of the last N values (your chosen lookback).
Visualization – Paints the four averages in a neat 2×5 table overlay.
👍 Pro Tips
Check Your Time Zone – Make sure chart timezone matches your broker’s session times.
Tweak Lookback – Use shorter windows (1W) to react quickly; longer (4–8W) to smooth out outliers.
Combine Indicators – Pair with volume or trend tools for deeper insights.
Happy Trading,
Riseofatrader
RiskCalc FX & GoldRiskCalc FX & Gold is a multi-market position sizing tool designed to help you manage risk quickly and accurately. With this script, simply enter your account capital, the percentage of risk you wish to take, and your stop in ticks. Depending on the selected market—Forex or XAUUSD—the script automatically adjusts its calculations:
Forex: Assumes 1 lot equals 100,000 units.
XAUUSD: Assumes 1 lot equals 100 ounces.
The script calculates your risk in dollars and, using a fixed value of 1 USD per tick per lot, determines the ideal position size in both lots and total contracts. Results are displayed in a clear, centralized table at the top of the chart for real-time decision-making.
Perfect for traders operating across multiple markets who need an automated and consistent approach to risk management.

MTF Signal XpertMTF Signal Xpert – Detailed Description
Overview:
MTF Signal Xpert is a proprietary, open‑source trading signal indicator that fuses multiple technical analysis methods into one cohesive strategy. Developed after rigorous backtesting and extensive research, this advanced tool is designed to deliver clear BUY and SELL signals by analyzing trend, momentum, and volatility across various timeframes. Its integrated approach not only enhances signal reliability but also incorporates dynamic risk management, helping traders protect their capital while navigating complex market conditions.
Detailed Explanation of How It Works:
Trend Detection via Moving Averages
Dual Moving Averages:
MTF Signal Xpert computes two moving averages—a fast MA and a slow MA—with the flexibility to choose from Simple (SMA), Exponential (EMA), or Hull (HMA) methods. This dual-MA system helps identify the prevailing market trend by contrasting short-term momentum with longer-term trends.
Crossover Logic:
A BUY signal is initiated when the fast MA crosses above the slow MA, coupled with the condition that the current price is above the lower Bollinger Band. This suggests that the market may be emerging from a lower price region. Conversely, a SELL signal is generated when the fast MA crosses below the slow MA and the price is below the upper Bollinger Band, indicating potential bearish pressure.
Recent Crossover Confirmation:
To ensure that signals reflect current market dynamics, the script tracks the number of bars since the moving average crossover event. Only crossovers that occur within a user-defined “candle confirmation” period are considered, which helps filter out outdated signals and improves overall signal accuracy.
Volatility and Price Extremes with Bollinger Bands
Calculation of Bands:
Bollinger Bands are calculated using a 20‑period simple moving average as the central basis, with the upper and lower bands derived from a standard deviation multiplier. This creates dynamic boundaries that adjust according to recent market volatility.
Signal Reinforcement:
For BUY signals, the condition that the price is above the lower Bollinger Band suggests an undervalued market condition, while for SELL signals, the price falling below the upper Bollinger Band reinforces the bearish bias. This volatility context adds depth to the moving average crossover signals.
Momentum Confirmation Using Multiple Oscillators
RSI (Relative Strength Index):
The RSI is computed over 14 periods to determine if the market is in an overbought or oversold state. Only readings within an optimal range (defined by user inputs) validate the signal, ensuring that entries are made during balanced conditions.
MACD (Moving Average Convergence Divergence):
The MACD line is compared with its signal line to assess momentum. A bullish scenario is confirmed when the MACD line is above the signal line, while a bearish scenario is indicated when it is below, thus adding another layer of confirmation.
Awesome Oscillator (AO):
The AO measures the difference between short-term and long-term simple moving averages of the median price. Positive AO values support BUY signals, while negative values back SELL signals, offering additional momentum insight.
ADX (Average Directional Index):
The ADX quantifies trend strength. MTF Signal Xpert only considers signals when the ADX value exceeds a specified threshold, ensuring that trades are taken in strongly trending markets.
Optional Stochastic Oscillator:
An optional stochastic oscillator filter can be enabled to further refine signals. It checks for overbought conditions (supporting SELL signals) or oversold conditions (supporting BUY signals), thus reducing ambiguity.
Multi-Timeframe Verification
Higher Timeframe Filter:
To align short-term signals with broader market trends, the script calculates an EMA on a higher timeframe as specified by the user. This multi-timeframe approach helps ensure that signals on the primary chart are consistent with the overall trend, thereby reducing false signals.
Dynamic Risk Management with ATR
ATR-Based Calculations:
The Average True Range (ATR) is used to measure current market volatility. This value is multiplied by a user-defined factor to dynamically determine stop loss (SL) and take profit (TP) levels, adapting to changing market conditions.
Visual SL/TP Markers:
The calculated SL and TP levels are plotted on the chart as distinct colored dots, enabling traders to quickly identify recommended exit points.
Optional Trailing Stop:
An optional trailing stop feature is available, which adjusts the stop loss as the trade moves favorably, helping to lock in profits while protecting against sudden reversals.
Risk/Reward Ratio Calculation:
MTF Signal Xpert computes a risk/reward ratio based on the dynamic SL and TP levels. This quantitative measure allows traders to assess whether the potential reward justifies the risk associated with a trade.
Condition Weighting and Signal Scoring
Binary Condition Checks:
Each technical condition—ranging from moving average crossovers, Bollinger Band positioning, and RSI range to MACD, AO, ADX, and volume filters—is assigned a binary score (1 if met, 0 if not).
Cumulative Scoring:
These individual scores are summed to generate cumulative bullish and bearish scores, quantifying the overall strength of the signal and providing traders with an objective measure of its viability.
Detailed Signal Explanation:
A comprehensive explanation string is generated, outlining which conditions contributed to the current BUY or SELL signal. This explanation is displayed on an on‑chart dashboard, offering transparency and clarity into the signal generation process.
On-Chart Visualizations and Debug Information
Chart Elements:
The indicator plots all key components—moving averages, Bollinger Bands, SL and TP markers—directly on the chart, providing a clear visual framework for understanding market conditions.
Combined Dashboard:
A dedicated dashboard displays key metrics such as RSI, ADX, and the bullish/bearish scores, alongside a detailed explanation of the current signal. This consolidated view allows traders to quickly grasp the underlying logic.
Debug Table (Optional):
For advanced users, an optional debug table is available. This table breaks down each individual condition, indicating which criteria were met or not met, thus aiding in further analysis and strategy refinement.
Mashup Justification and Originality
MTF Signal Xpert is more than just an aggregation of existing indicators—it is an original synthesis designed to address real-world trading complexities. Here’s how its components work together:
Integrated Trend, Volatility, and Momentum Analysis:
By combining moving averages, Bollinger Bands, and multiple oscillators (RSI, MACD, AO, ADX, and an optional stochastic), the indicator captures diverse market dynamics. Each component reinforces the others, reducing noise and filtering out false signals.
Multi-Timeframe Analysis:
The inclusion of a higher timeframe filter aligns short-term signals with longer-term trends, enhancing overall reliability and reducing the potential for contradictory signals.
Adaptive Risk Management:
Dynamic stop loss and take profit levels, determined using ATR, ensure that the risk management strategy adapts to current market conditions. The optional trailing stop further refines this approach, protecting profits as the market evolves.
Quantitative Signal Scoring:
The condition weighting system provides an objective measure of signal strength, giving traders clear insight into how each technical component contributes to the final decision.
How to Use MTF Signal Xpert:
Input Customization:
Adjust the moving average type and period settings, ATR multipliers, and oscillator thresholds to align with your trading style and the specific market conditions.
Enable or disable the optional stochastic oscillator and trailing stop based on your preference.
Interpreting the Signals:
When a BUY or SELL signal appears, refer to the on‑chart dashboard, which displays key metrics (e.g., RSI, ADX, bullish/bearish scores) along with a detailed breakdown of the conditions that triggered the signal.
Review the SL and TP markers on the chart to understand the associated risk/reward setup.
Risk Management:
Use the dynamically calculated stop loss and take profit levels as guidelines for setting your exit points.
Evaluate the provided risk/reward ratio to ensure that the potential reward justifies the risk before entering a trade.
Debugging and Verification:
Advanced users can enable the debug table to see a condition-by-condition breakdown of the signal generation process, helping refine the strategy and deepen understanding of market dynamics.
Disclaimer:
MTF Signal Xpert is intended for educational and analytical purposes only. Although it is based on robust technical analysis methods and has undergone extensive backtesting, past performance is not indicative of future results. Traders should employ proper risk management and adjust the settings to suit their financial circumstances and risk tolerance.
MTF Signal Xpert represents a comprehensive, original approach to trading signal generation. By blending trend detection, volatility assessment, momentum analysis, multi-timeframe alignment, and adaptive risk management into one integrated system, it provides traders with actionable signals and the transparency needed to understand the logic behind them.

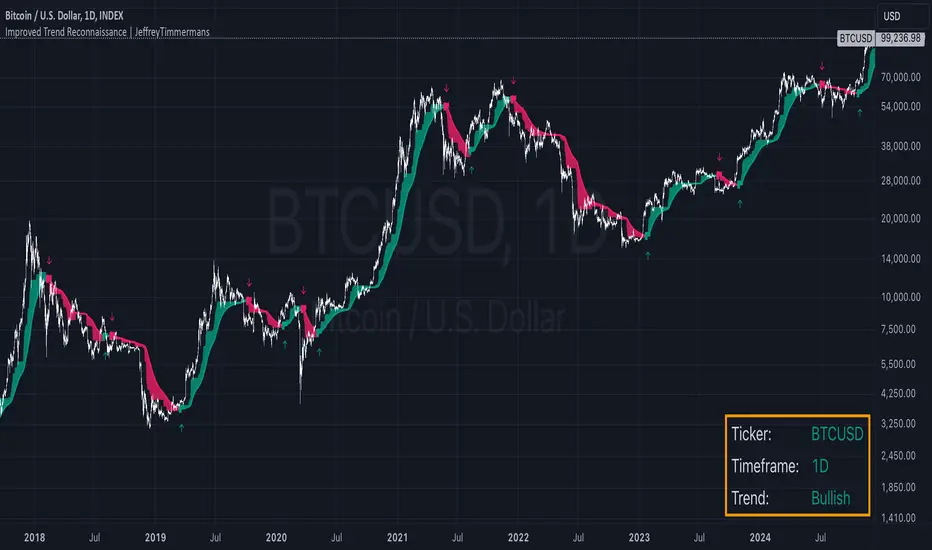
Improved Trend Reconnaissance | JeffreyTimmermansImproved Trend Reconnaissance
The Improved Trend Reconnaissance indicator is a robust tool designed to help traders identify and follow trends while avoiding market noise. It is especially effective for capturing longer-term trends and sustained price movements over extended time periods. By leveraging smoothed trend analysis and volatility-based consolidation detection, this indicator provides clear and actionable insights for traders focusing on significant market trends.
What Does This Indicator Do?
At its core, this indicator calculates a Half Trend value and applies advanced smoothing techniques to emphasize longer-term trends. Additionally, it incorporates volatility analysis using the Average True Range (ATR) to detect periods of consolidation, where trend signals are muted to prevent false signals.
Key Components Explained
Half Trend Calculation:
This indicator determines a Half Trend value based on the relationship between the Exponential Moving Average (EMA) of closing prices and the highest highs and lowest lows over a specified range.
The trend is further smoothed to minimize short-term fluctuations, ensuring the focus remains on sustained price movements.
ATR-Based Consolidation Detection:
By comparing the range of price highs and lows to a multiple of ATR, the indicator detects consolidation zones where the market is range-bound. During these periods, trend signals are suppressed to avoid false positives.
Trend Visualization:
Bullish Trends: Highlighted in green with upward markers and optional trend-colored candles.
Bearish Trends: Highlighted in red with downward markers and optional trend-colored candles.
Designed for Longer-Term Trends:
The default settings are optimized to capture longer-term trends, making this indicator particularly valuable for traders looking to identify and follow substantial market movements over extended periods.
Key Features
Optimized for Capturing Longer Trends:
With the default settings, the indicator is tailored to identify and follow longer-term price trends, reducing noise from minor fluctuations. This makes it ideal for traders focused on significant trends and extended price movements.
Customizable Inputs:
Parameters such as trend range, smoothing length, ATR calculation period, and consolidation threshold are fully customizable.
Visual settings, including trend colors and signal sizes, can be adjusted for personalized trading needs.
Dynamic Signal Generation:
Bullish Signals: Generated when the smoothed Half Trend crosses upward and the market is trending.
Bearish Signals: Generated when the smoothed Half Trend crosses downward and the market is trending.
Alerts can notify traders in real time when these conditions occur.
Enhanced Visualization:
Candle coloring based on trend direction provides an immediate visual representation of market momentum.
Plotted trend lines and filled regions between them emphasize the current trend's strength and direction.
Real-Time Dashboard:
Displays essential information, including the current ticker, trend direction, and status (bullish or bearish), directly on the chart.
How to Use This Indicator
Identify Longer-Term Trends:
Use the smoothed Half Trend line and trend-colored candles to identify and follow significant price trends.
The default settings are specifically designed to focus on extended trends, making it easier to spot major market moves.
Avoid Noise in Consolidation:
Pay attention to the consolidation detection feature, which suppresses signals during range-bound market conditions, aka mean-reverting markets.
This ensures that signals generated are more reliable and actionable.
Confirm Trend Signals:
Use the visual markers (flags) and dashboard status to validate bullish or bearish trends before making trading decisions.
Set Alerts:
Set alerts for bullish or bearish signals to stay informed about key market movements without constantly monitoring the charts.
Adapt for Your Strategy:
While optimized for longer-term trends, the customizable settings allow you to adapt the indicator for shorter-term strategies if needed.
What Makes This Indicator Unique?
Focus on Longer-Term Trends:
Unlike many indicators that respond to short-term fluctuations, this tool is tailored for longer-term trend-following systems, ensuring that traders capture the most meaningful price movements.
Noise Reduction:
By combining smoothing techniques and ATR-based consolidation detection, the indicator reduces market noise and focuses on actionable insights.
Clear Visual Representation:
The combination of trend-colored candles, plotted lines, and dashboard information simplifies the analysis of complex market trends.
Customizability:
Fully adjustable parameters ensure the indicator meets the specific needs of a wide range of trading styles.
Real-Time Feedback:
Alerts and dashboard integration keep traders informed, enabling timely and well-informed decision-making.
The Improved Trend Reconnaissance indicator is an essential tool for traders looking to focus on longer-term trends and sustained market movements. With its default settings optimized for capturing significant trends over extended periods, it offers clarity, precision, and actionable insights for successful trend-following trading.
-Jeffrey
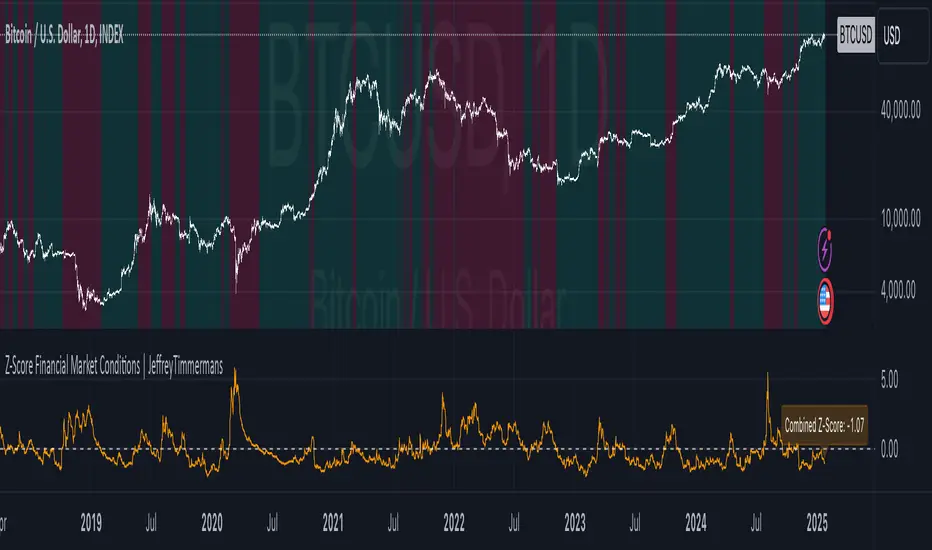
Z-Score Financial Market Conditions | JeffreyTimmermansZ-Score Financial Market Conditions
The Z-Score Financial Market Conditions indicator is a cutting-edge tool for measuring financial market stress and relaxation by combining eight critical financial metrics into a single composite Z-score. This dynamic indicator provides traders and analysts with actionable insights into the overall state of the financial markets, enabling informed decision-making across various trading and investment systems.
Purpose of the Indicator
This indicator serves as a comprehensive gauge of financial market conditions, offering a clear visualization of whether the markets are in a state of stress (elevated risks) or relaxation (normalized conditions). The Z-Score Financial Market Conditions tool is particularly effective for:
Macro-Level Risk Assessment: Identifying periods of high market stress or calmness.
Trend Following Systems: Gauging the market's underlying conditions to validate trends.
Mean Reversion Strategies: Using extreme Z-score levels to detect potential reversals.
Portfolio Risk Management: Adjusting asset exposure based on market-wide financial conditions.
This indicator works exclusively on the 1-day timeframe, as it is calibrated to analyze daily changes in the financial metrics that drive market behavior.
The Eight Key Components and Their Importance
The composite Z-score integrates the Z-scores of the following eight financial metrics. These metrics have been selected for their complementary insights into various aspects of financial market conditions:
VIX (S&P 500 Volatility Index)
Reflects implied volatility in the U.S. equity market.
High VIX values indicate increased uncertainty and risk aversion among market participants.
MOVE (US Treasury Bond Volatility Index)
Captures volatility in U.S. Treasury bonds.
Essential for understanding risk in fixed-income markets, which significantly impact broader economic conditions.
ICE BofA High Yield Option Adjusted Spread (BAMLH0A0HYM2)
Measures the risk premium for high-yield corporate bonds.
Rising spreads suggest increased credit risk and potential economic stress.
ICE BofA Corporate Index Option Adjusted Spread (BAMLC0A0CM)
Tracks credit spreads in the investment-grade bond market.
Helps evaluate the health of higher-quality corporate debt, a key indicator of financial stability.
ICE BofA US High Yield Index Spread (BAMLH0A0HYM2)
Focuses on high-yield U.S. corporate bonds.
Provides localized insights into U.S. credit conditions and risk levels.
CDS (Credit Default Swap Spreads)
Measures the cost of insuring against bond defaults.
Rising CDS spreads signal growing concern over creditworthiness, often a leading indicator of financial stress.
Global Bond Spread (AGG)
Represents global fixed-income spreads.
Offers a broader perspective on international financial conditions beyond the U.S. market.
TED Spread (Treasury-EuroDollar Spread)
The difference between interbank lending rates and short-term U.S. Treasury yields.
Widely regarded as an indicator of systemic risk in the banking sector.
Features and Improvements
This script builds upon the original concept by introducing advanced features to enhance its precision and usability:
Lookback Period Adjustment
A customizable lookback period for Z-score calculations (default: 160 days).
Allows for greater flexibility in adapting to different market conditions.
Moving Average (MA) Smoothing
Optional smoothing of Z-scores using an exponential moving average (EMA) for enhanced clarity.
Default smoothing length: 8 days.
Individual Component Visibility
Plots for individual Z-scores can be enabled or disabled to focus on specific metrics.
Dynamic Background Coloring
Visual cues to indicate bullish (green) or bearish (red) financial conditions based on the composite Z-score.
Custom Inputs
Toggle on/off for each financial metric to tailor the indicator to specific use cases.
Customizable parameters for smoothing and moving averages.
Applications
This indicator is versatile and can be effectively used in various trading systems and strategies:
Long-Term Investment Decision-Making: Assess macroeconomic trends for portfolio rebalancing.
Systematic Trading: Incorporate market conditions into algorithmic models to enhance robustness.
Volatility-Based Strategies: Use Z-score fluctuations to anticipate periods of market turbulence or calm.
Credits
This indicator was inspired by and builds upon the work of TomasOnMarkets . While incorporating significant enhancements, it acknowledges the foundational concepts provided by this original source. Thank you for sharing your input on this important indicator. We are honored to use it and to further improve upon it.
-Jeffrey
Portfolio [Afnan]🚀 Portfolio - Advanced Portfolio Management Indicator 📊
A game-changing portfolio management tool designed to help traders stay on top of their positions and manage risk efficiently. This indicator combines detailed tracking, real-time analytics, and visual clarity to ensure traders are well-equipped for the dynamic world of financial markets.
📈 Key Features 💡
Track up to 14 positions with ease
Real-time Profit & Loss (P&L) updates and risk metrics
Visual representation of entry, stop-loss (SL), and target levels
Alerts for stop-loss breaches and target achievements
Comprehensive portfolio summaries for quick analysis
Customizable options to suit individual trading styles
🔍 Main Components ⚙️
📊 1. Position Tracking
Detailed position data: entry, stop-loss, target levels, and more
Real-time risk-reward ratios
Insights into position size and exposure percentages
Continuous updates on P&L in real-time
📉 2. Visual Indicators
Clear visual markers for entry, SL, and target prices
Price labels with detailed percentage changes
Indicators that show the current position's market status
💼 3. Portfolio Summary
Aggregate account values and exposure
Summarized P&L metrics across all positions
Risk management insights for better decision-making
Daily performance tracking to evaluate strategies
⚠️ 4. Alert System
Instant notifications for stop-loss breaches
Alerts when target prices are hit
Alerts operate for the current chart symbol
⚡ Customization Options 🎨
Show or hide specific data columns
Adjust the table's position and size for better visibility
Personalize color schemes and text styles
Switch between full portfolio view and single symbol focus
📱 How to Use 📝
Input your positions in the indicator's settings
Enable or disable specific positions dynamically
Customize display preferences to your liking
Set up alerts for proactive risk management
Monitor all your trading activities in one comprehensive dashboard
📌 Important Notes ℹ️
Compatible with any trading symbol
Updates seamlessly during market hours
Alerts are specific to the currently active chart symbol
Maximum capacity: 14 simultaneous positions
Created by: @AfnanTAjuddin
⚠️ Disclaimer ⚠️
This indicator is a tool for informational purposes only. Ensure all calculations are verified and consult a financial professional before making investment decisions.
🎯 "Stay disciplined, trade smart, and let data guide your decisions." 📊

AutoPilot | FractalystWhat’s the purpose of this indicator?
The AutoPilot indicator automates the management of your active trades by:
Breaks Even: Moves the stop-loss to the entry price once the trade reaches a 1:1 risk-reward ratio.
Closes Trades: Automatically exits trades when trailing stop-losses are triggered.
This automation is facilitated through PineConnector and TradingView webhook integration, allowing traders to manage multiple positions across various markets effortlessly without any manual intervention.
----
How does this indicator trail stop-loss using market structure?
The AutoPilot indicator utilizes an advanced market structure trailing stop-loss mechanism to manage trades based on market dynamics and probabilities.
Here's how it works:
Market Structure Identification: The indicator first identifies key market structures such as higher highs, lower lows.
These structures are pivotal points where the market has shown a change in direction or momentum.
Probability-Based Trailing: Once a trade is active, the stop-loss isn't just set at a fixed distance or percentage but is dynamically adjusted based on the probability of the market structure holding or breaking.
This involves:
Trend Continuation Probability: If the market structure suggests a strong trend continuation (e.g., a series of higher highs in an uptrend), the stop-loss might trail closer to the price, but with a buffer calculated by the probability of the trend continuing versus reversing.
Reversal Probability: Conversely, if there's a high probability of a trend reversal based on recent market structures (like a significant lower high in an uptrend), the stop-loss might be adjusted to a point where the market structure would need to break to confirm the reversal, thus protecting potential profits or minimizing losses.
Dynamic Adjustment: The trailing stop-loss adjusts in real-time as new market structures form. For instance, if a new higher high is formed in an uptrend, the stop-loss might move up but not necessarily to the exact previous swing low. Instead, it's placed at a level where the probability of the next swing low not breaking this level is high, based on historical price action.
Risk Management: By using market structure and probabilities, the indicator aims to balance between giving the trade room to breathe (allowing for normal market fluctuations) and tightening the stop-loss when the market behavior suggests a potential trend change or continuation with high confidence.
This approach ensures that the stop-loss isn't just a static or simple trailing mechanism but a sophisticated tool that adapts to the evolving market conditions, aiming to maximize profit while minimizing the risk of being stopped out prematurely due to market noise.
----
How are the probabilities calculated? What are the underlying calculations?
The probability is designed to enhance trade management by using buyside liquidity and probability analysis to filter out low/high probability conditions.
This helps in identifying optimal trailing points where the likelihood of a price continuation is higher.
Calculations:
1. Understanding Swing highs and Swing Lows
Swing High: A Swing High is formed when there is a high with 2 lower highs to the left and right.
Swing Low: A Swing Low is formed when there is a low with 2 higher lows to the left and right.
2. Understanding the purpose and the underlying calculations behind Buyside, Sellside and Equilibrium levels.
3. Understanding probability calculations
1. Upon the formation of a new range, the script waits for the price to reach and tap into equilibrium or the 50% level. Status: "⏸" - Inactive
2. Once equilibrium is tapped into, the equilibrium status becomes activated and it waits for either liquidity side to be hit. Status: "▶" - Active
3. If the buyside liquidity is hit, the script adds to the count of successful buyside liquidity occurrences. Similarly, if the sellside is tapped, it records successful sellside liquidity occurrences.
5. Finally, the number of successful occurrences for each side is divided by the overall count individually to calculate the range probabilities.
Note: The calculations are performed independently for each directional range. A range is considered bearish if the previous breakout was through a sellside liquidity. Conversely, a range is considered bullish if the most recent breakout was through a buyside liquidity.
----
What does the automation table display?
The automation table in the AutoPilot indicator provides a summary of user-defined settings crucial for automated trade management through PineConnector and TradingView integration. It displays:
PineConnector License ID: This ensures that the indicator is linked to your specific PineConnector account, allowing for personalized and secure automation of your trades.
Order Type (Buy/Sell): Indicates whether the automation is set for buying or selling, which is essential for correctly executing your trading strategy.
Chosen Symbol: Specifies the trading pair or symbol in your broker's platform where the trade management commands (like closing orders) will be executed. This ensures that the automation targets the correct market or asset.
Risk Per Trade: Shows the percentage or amount of your capital you're willing to risk on each trade, helping you maintain consistent risk management across different trades.
Comment: A field for you to input notes or identifiers, particularly useful when trading across multiple markets or instruments. This helps in tracking and managing trades across different assets or strategies.
Comment: A field for you to input identifiers, particularly useful when trading across multiple timeframes or different enries.
Allowing users to manage specific comments for each previously taken entry, facilitating precise management of multiple trades with unique identifiers.
This table serves as a quick reference for your current settings, ensuring you're always aware of how your trades are being managed automatically before any adjustments are made or alerts are triggered.
----
How to use the indicator?
To use the AutoPilot indicator:
Purchase a License ID: Acquire a license ID from PineConnector.
Setup PineConnector EA: Install and configure the PineConnector Expert Advisor on your MetaTrader platform.
Input Settings: Enter your PineConnector license ID, choose the order type, set your risk per trade, add the order comment, and select the trading symbol in the indicator's settings.
Create Alert: Right-click on the automation table, and set up an alert with the provided webhook to connect with PineConnector.
Automatic Management: Once set, your active trades will be automatically managed according to the alert conditions you've set.
This setup ensures your trades are managed seamlessly without constant manual intervention.
----
What makes this indicator original?
Integration with PineConnector: The AutoPilot indicator's originality lies in its integration with PineConnector, which allows for real-time trade management directly from TradingView to your MetaTrader platform. This setup is unique as it combines the analytical capabilities of TradingView with the execution capabilities of MetaTrader through a custom indicator, providing a seamless bridge between analysis and action.
Market Structure-Based Trailing Stop-Loss: Unlike many indicators that might use fixed percentages or ATR (Average True Range) for stop-loss adjustments, the AutoPilot indicator uses market structure (higher highs, lower lows) to dynamically adjust the stop-loss.
Probability-Based Adjustments: The indicator doesn't just trail stop-losses based on price but incorporates the probability of market structure holding or breaking. This probability-based trailing mechanism is innovative, aiming to balance between giving trades room to breathe and tightening when market behavior suggests a potential reversal or continuation.
Customizable Automation Table: The automation table within the indicator allows for detailed customization, including setting specific comments for trades. This feature, while perhaps not unique in concept, is original in its implementation within trading indicators, providing users with a high degree of control and personalization over trade management.
Real-Time Trade Management Alerts: The ability to set up alerts directly from the indicator to manage trades in real-time via webhooks to PineConnector adds a layer of automation that's not commonly found in standard trading indicators. This real-time connection for trade management enhances its originality by reducing the lag between analysis and trade execution.
User-Centric Design: The design of the AutoPilot indicator focuses heavily on user interaction, allowing for inputs like risk per trade, specific order types, and comments. This user-centric approach, where the indicator adapts to the trader's strategy rather than the trader adapting to the tool, sets it apart.
External Integration for Enhanced Functionality: By leveraging external services like PineConnector for execution, the indicator extends its functionality beyond what's typically possible within TradingView alone, making it original in its ecosystem integration for trading purposes.
Practical Implication: This means if you're in a trade and the market structure suggests the trend is continuing (e.g., making higher highs in an uptrend), your stop-loss might trail closer to the price but not too close to avoid being stopped out by normal fluctuations. If the structure breaks (e.g., a lower high in an uptrend), the stop-loss could adjust more aggressively to protect profits or minimize losses, anticipating a potential trend change.
This combination of features creates an original tool that not only analyzes market conditions but actively manages trades based on sophisticated market structure analysis.
----
User-input settings and customizations
----
Terms and Conditions | Disclaimer
Our charting tools are provided for informational and educational purposes only and should not be construed as financial, investment, or trading advice. They are not intended to forecast market movements or offer specific recommendations. Users should understand that past performance does not guarantee future results and should not base financial decisions solely on historical data. By utilizing our charting tools, the buyer acknowledges that neither the seller nor the creator assumes responsibility for decisions made using the information provided. The buyer assumes full responsibility and liability for any actions taken and their consequences, including potential financial losses. Therefore, by purchasing these charting tools, the customer acknowledges that neither the seller nor the creator is liable for any unfavorable outcomes resulting from the development, sale, or use of the products.
The buyer is responsible for canceling their subscription if they no longer wish to continue at the full retail price. Our policy does not include reimbursement, refunds, or chargebacks once the Terms and Conditions are accepted before purchase.
By continuing to use our charting tools, the user acknowledges and accepts the Terms and Conditions outlined in this legal disclaimer.

Drawdown % (with SMA)This script, titled "Drawdown % (with SMA)" and designed for Pine Script version 5
offers a sophisticated tool for traders to monitor drawdown percentages, a crucial metric in assessing investment risks. The script calculates the drawdown as the percentage decrease from the all-time high value of the selected financial instrument.

Altcoin ManagerThe Altcoin Manager is a comprehensive script for identifying the current altcoin narrative by tracking and analyzing of a wide array of altcoins across various blockchain layers and categories, such as DeFi, GameFi, AI, and Meme coins. Ideal for traders looking to get a broad yet detailed view of the altcoin market, covering various sectors and chains.
The Key Features:
Versatile Asset Tracking:
Tracks 40 different cryptocurrencies (as of publishing) across different categories, allowing for a diversified and detailed analysis of the altcoin market.
Customizable Assets and Category Analysis:
Select 20 of your own coins across 4 different categories such as DeFi, GameFi, AI, and Meme coins as well as specifying their individual chains.
Dynamic Layer and Chain Analysis:
Includes options to plot and analyze specific blockchain layers and chains such as Ethereum Chain, Solana Chain, BNB Smart Chain, Arbitrum Chain, and Polygon Chain. The script associates various assets with specific blockchains, providing a clearer picture of how different segments of the altcoin market are performing.
Cumulative and Per-Candle Change:
Switch between viewing the total cumulative change since a set start date or the per-candle change, offering flexibility in analyzing price movements over different timeframes.
Denomination Adjustment:
Includes a functionality to denominate asset prices in other currencies or crypto such as BTC, allowing for a more tailored financial analysis according to your preference.
Moving Averages for Categories and Chains:
Calculates and plots moving averages for each category and chain, aiding in the identification of trends over the selected moving average length.
How do I use it?
This script is not used with any particular chart. Instead, assign it it's own tab and layout.
For a clearer analysis, use multiple different panels to track Categories and Chains separately, both Cumulative for a longer term analysis and Per-Candle to find ongoing breakouts and changes in trend.
You can either use the pre-selected altcoins to represent the market, or you can select your own.
The Layer 1 and Layer 2 are not customizable but consists of 15 popular Layer 1 incl Bitcoin, Ethereum, Solana etc. Layer 2 consists of 5 popular Layer 2.

Position and Risk Calculator (for Indices) [dR-Algo]Position and Risk Calculator : Your Ultimate Risk Management Tool for Indices
The difference between a novice and a seasoned trader often comes down to one essential element: risk management. While trading indices, the challenges are even more intense due to market volatility and leverage. The Position and Risk Calculator steps in here to bridge the gap, providing you with an efficient tool designed exclusively for indices trading.
Key Features:
User-Friendly Interface: Designed to integrate effortlessly with your TradingView chart, this tool's interface is intuitive and clutter-free.
Dynamic Price Level Adjustment: Move your Entry, Stop Loss, and Take Profit levels directly on the chart for an interactive experience.
Account Balance Input: Customize the tool to understand your unique financial situation by inputting your current account balance.
Trade Risk Customization: Define how much you're willing to risk per trade, and the tool will do the rest.
Automated Calculations: The indicator calculates the maximum monetary risk and translates it into the maximum lot size you can afford. It delivers a full-integer lot size to make your trading decisions easier.
Comprehensive Risk Evaluation: Beyond lot sizes, it provides you with the Cost-to-Reward Ratio (CRV) of your trade, the actual monetary risk according to the calculated lot size, and the potential profit.
How To Use:
Once you add the Position and Risk Calculator to your TradingView chart, a new interactive panel appears. Here’s how it works:
Set Price Levels: Using draggable lines on the chart, set your Entry Price, Stop Loss, and Take Profit levels.
Account Details: Go to settings and enter your Account Balance and your desired risk percentage per trade.
Automatic Calculations: As soon as the above details are set, the indicator goes to work. It first calculates your maximum risk in monetary terms and then translates that into the maximum lot size you can take for the trade.
Review and Trade: The indicator shows you all the vital statistics - CRV of the trade, the money at risk according to the calculated lot size, and the possible profit.
Why Choose This Tool?
Informed Decisions: Your trading decisions will be based on concrete numbers, removing guesswork.
Time-saving: No need for manual calculations or using separate tools; everything is in one place.
Focus on Trading: By automating the risk management aspect, this tool allows you to focus more on your trading strategy and market analysis.
Tailor-Made for Indices: Unlike many other tools that try to serve all markets, the Position and Risk Calculator is designed specifically for indices trading.
Remember, effective risk management is what separates successful traders from those who burn out. The Position and Risk Calculator not only helps you define your risk but also helps you understand it, empowering you to trade with confidence.
So why not give yourself the best chance of success? Add the Position and Risk Calculator to your TradingView setup and experience the difference it can make.

Modern Portfolio Management IndicatorAfter weeks of grueling over this indicator, I am excited to be releasing it!
Intro:
This is not a sexy, technical or math based indicator that will give you buy and sell signals or anything fancy, but it is an indicator that I created in hopes to bridge a gap I have noticed. That gap is the lack of indicators and technical resources for those who also like to plan their investments. This indicator is tailored to those who are either established investors and to those who are looking to get into investing but don't really know where to start.
The premise of this indicator is based on Modern Portfolio Theory (MPT). Before we get into the indicator itself, I think its important to provide a quick synopsis of MPT.
About MPT:
Modern Portfolio Theory (MPT) is an investment framework that was developed by Harry Markowitz in the 1950s. It is based on the idea that an investor can optimize their investment portfolio by considering the trade-off between risk and return. MPT emphasizes diversification and holds that the risk of an individual asset should be assessed in the context of its contribution to the overall portfolio's risk. The theory suggests that by diversifying investments across different asset classes with varying levels of risk, an investor can achieve a more efficient portfolio that maximizes returns for a given level of risk or minimizes risk for a desired level of return. MPT also introduced the concept of the efficient frontier, which represents the set of portfolios that offer the highest expected return for a given level of risk. MPT has been widely adopted and used by investors, financial advisors, and portfolio managers to construct and manage portfolios.
So how does this indicator help with MPT?
The thinking and theory that went behind this indicator was this: I wanted an indicator, or really just a "way" to test and back-test ticker performance over time and under various circumstances and help manage risk.
Over the last 3 years we have seen a massive bull market, followed by a pretty huge bear market, followed by a very unexpected bull market. We have been and continue to be plagued with economic and political uncertainty that seems to constantly be looming over everyone with each waking day. Some people have liquidated their retirement investments, while others are fomoing in to catch this current bull run. But which tickers are sound and how tickers and funds have compared amongst each other remains somewhat difficult to ascertain, absent manually reviewing and calculating each ticker individually.
That is where this indicator comes in. This indicator permits the user to define up to 5 equities that they are potentially interested in investing in, or are already invested in. The user can then select a specific period in time, say from the beginning of 2022 till now. The user can then define how much they want to invest in each company by number of shares, so if they want to buy 1 share a week, or 2 shares a month, they can input these variables into the indicator to draw conclusions. As many brokers are also now permitting fractional share trading, this ability is also integrated into the indicator. So for shares, you can put in, say, 0.25 shares of SPY and the indicator will accept this and account for this fractional share.
The indicator will then show you a portfolio summary of what your earnings and returns would be for the defined period. It will provide a percent return as well as the projected P&L based on your desired investment amount and frequency.
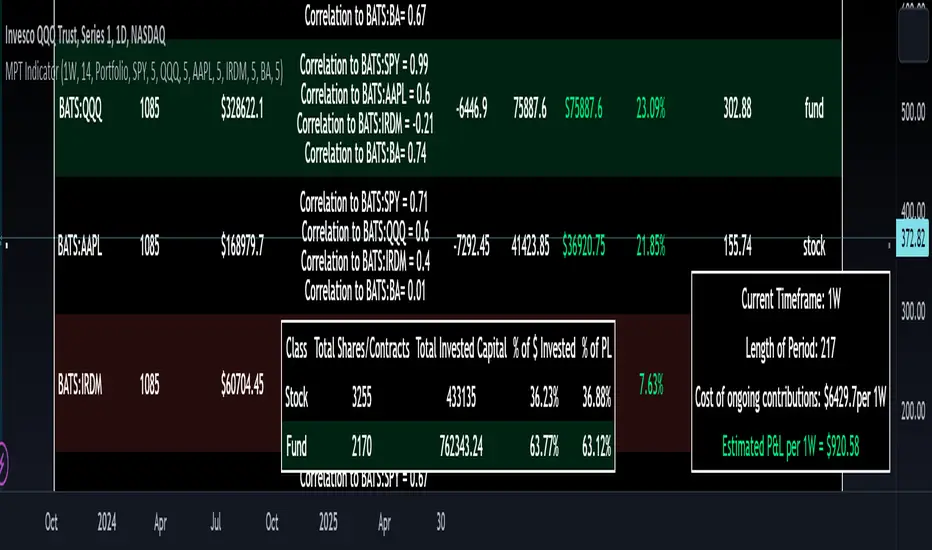
But it goes beyond just that, you can also have the indicator display a simple forecasting projection of the portfolio. It will show the projected P&L and % Return over various periods in time on each of the ticker (see image below):
The indicator will also break down your portfolio allocation, it will show where the majority of your holdings are and where the majority of your P&L in coming from (best performers will show a green fill and worst will show a red fill, see image below):
This colour coding also extends to the portfolio breakdown itself.
Dollar cost averaging (DCA) is incorporated into the indicator itself, by assuming ongoing contributions. If you want to stop contributions at a certain point, you just select your end time for contributions at the point in which you would stop contributing.
The indicator also provides some basic fundamental information about the company tickers (if applicable). Simply select the "Fundamental" chart and it will display a breakdown of the fundamentals, including dividends paid, market cap and earnings yield:
The indicator also provides a correlation assessment of each holding against each other holding. This emphasizes the profound role of diversification on portfolios. The less correlation you have in your portfolio among your holdings, the better diversified you are. As well, if you have holdings that are perfectly inverse other holdings, you have a pseudo hedge against the downturn of one of your holdings. This is even more helpful if the inverse is a company with solid fundamentals.
In the below example you will see NASDAQ:IRDM in the portfolio. You will be able to see that NASDAQ:IRDM has a slight inverse relationship to SPY:
Yet IRDM has solid fundamentals and is performing well fundamentally. Thus, this makes IRDIM a solid addition to your portfolio as it can potentially hedge against a downturn for SPY and is less risky than simply holding an inverse leveraged share on SPY which is most likely just going to cost you money than make you money.
Concluding remarks:
There are many fun and interesting things you can do with this indicator and I encourage you to try it out and have fun with it! The overall objective with the indicator is to help you plan for your portfolio and not necessarily to manage your portfolio. If you have a few stocks you are looking at and contemplating investing in, this will help you run some theoretical scenarios with this stock based on historical performance and also help give you a feel of how it will perform in the future based on past behaviour.
It is important to remember that past behaviour does not indicate future behaviour, but the indicator provides you with tools to get a feel for how a stock has performed under various circumstances and get a general feel of the fundamentals of the company you could potentially be investing in.
Please note, this indicator is not meant to replace full, fundamental analyses of individual companies. It is simply meant to give you a "gist" of how companies are fundamentally and how they have performed historically.
I hope you enjoy it!
Safe trades everyone!
Consensio Allocation ToolOriginally created and taught by Taylor Jenks, this indicator provides portfolio allocation suggestions based on the behaviour of price and 3 simple moving averages (4/10/40 by default)
(ie. when short & medium term SMAs are above the long term then allocation is to be 100%).
This percentage allocated to the stock/commodity is to be reduced as it passes below the SMA's, particularly as each moving average crosses.
Consensio is useful for scaling in and out of a position as the portfolio allocation will change according to the momentum of the asset.
The rules below are my own based on understanding of the trading system developed by Jenks and his online content.
This script has the following rules:
if fastAboveSlowMA and not mediumAboveSlowMA
allocation := 30.0
else if longAboveFastMA
allocation := 0.0
else if fastAboveMediumMA and fastAboveSlowMA
allocation := 100.0
else if not fastAboveMediumMA and fastAboveSlowMA
allocation := 80.0
else if not fastAboveMediumMA and not fastAboveSlowMA
allocation := 50.0
else if not mediumAboveSlowMA and fastAboveSlowMA
allocation := 50.0
// Calculate adjusted allocation percentage based on crossing moving averages
allocation := allocation + (priceAboveFastMA ? 10.0 : -10.0)
allocation := allocation + (priceAboveMediumMA ? 10.0 : -10.0)

Average Cost (Costo Promedio)ENGLISH
This 'Average Cost' script allows the user to input and visualize profit or loss for different stocks (up to 50) with average cost and quantity data on a single chart. This is useful for tracking the profit or loss of each stock in real-time.
To use this script, the user should follow these steps:
1. Add the 'Average Cost' script to your TradingView chart.
2. In the script's configuration window, input the tickers, average costs, and quantity of shares for each ticker you want to monitor.
3. Click 'Accept' to apply the changes.
This script is primarily designed for stock markets, but can also be useful in other financial markets where the user is interested in tracking the performance of multiple assets.
ESPAÑOL
Este script de "Costo Promedio" permite al usuario ingresar y visualizar si hay ganancia o perdida para diferentes acciones (hasta 50) con los datos de costos promedio y cantidad de acciones en un solo gráfico. Esto es útil para realizar un seguimiento de la ganancia o pérdida de cada acción en tiempo real.
Para utilizar este script, el usuario debe seguir estos pasos:
1. Agregue el script "Costo Promedio" a su gráfico en TradingView.
2. En la ventana de configuración del script, ingrese los tickers, costos promedio y cantidad de acciones para cada ticker que desee monitorear.
3. Haga clic en "Aceptar" para aplicar los cambios.
Este script está diseñado principalmente para los mercados de acciones, pero también puede ser útil en otros mercados financieros donde el usuario esté interesado en rastrear el rendimiento de múltiples activos.

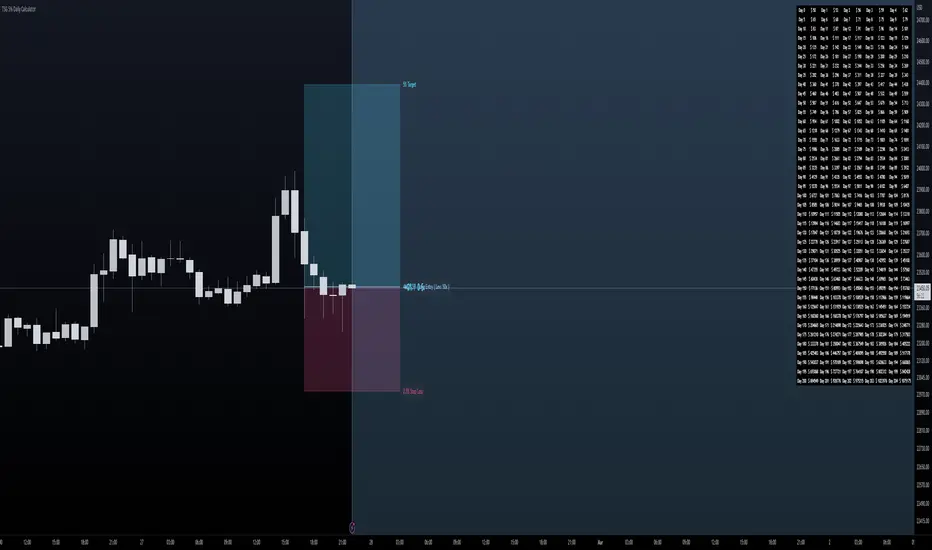
TSG 5% Daily CalculatorThis is a calculator I've created to help visualize Target and Risk Levels based on leverage use to trade crypto.
How to use it ?
Basic Use:
- Set the Direction of your trade - either Long or Short
- Set the Leverage you use in your trade - it is crutial to define the risk and target levels
- Set the Risk Amount you want to risk (in %) of your total balance ( Advised 2-3% )
- Set the Target Amount you want to profit at the target (the idea of this is 5% daily, so 5%).
- Set Entry Price if you have opened a position, and you will visually see your progress. Otherwise the levels will be adjusted to the Close of the candle.
Additions:
- Set your Initial Balance - to help you visualize on the Table your progress
- Set your Current Balance - for visualization purposes on ongoing trades and on the Table
- Entry Date - Advised to set it when you open a trade - you will be tracking the progress of your trade since the candle on which you opened it
- Show Table - to show the table of 5% daily and the target it is set on per day
- Table Size - Set table to be small or normal
- Together with the Table you have a big blue area behind that ends on the day you will become a Millionaire based on the Initial Balance, Current balance and Target % in your inputs
RISK MANAGEMENTHi dear Traders,
Here I would present you my 'Risk Management' tool which is based on your buy orders, trading fees and your desired benefit.
Easily, fulfill the price and volume of each entries. Add to this, you can prepare the info about your next proposed entries, just let them not check at first and by meeting the prices then active the check-box beside it.
Two line will be presented on your candle-plot, one of the indicate the place that without any lose/win you can exit and also the desired exit position by considering user defined benefit.
Use it for free but please do not forget to boost the script.
Best regards and happy trading.
Shakib

Position Size Calc. (Minimalist)This is a simplified position size calculator in the form of a table.
The reason I published this script is because all other position size calculator scripts try to provide way too much when it should be much simpler, position in strange areas of the chart and leave unwanted chart pollution.
This is a bare-bones functional table that takes your risk level, entry, stop and take profit as inputs, and calculates your loss, profit and required position size for your chosen risk level as a result.
Inspired by a table type position size calculator made by DojiEmoji design/color-wise. Functionally different however.
I hope you find this script useful and include it on your trading journey.
LevelsManagerLibrary "LevelsManager"
TODO: Track up to 6 TakeProfits and 1 StopLoss achievement for one or many of your buy/sell conditions.
manageTrade(bool, bool, bool, string, string, float, float, bool, bool, bool, bool, bool, bool, float, float, float, float, float, float, float)
Track TakeProfits and StopLoss achievement for one or many of your buy/sell conditions. CHECK the commented section: "Function @manageTrade" for Description
Parameters:
bool : useSignal.
bool : b_gameOVer.
bool : b_gameOVer.
string : bName.
string : sName.
float : buyEntrySource.
float : sellEntrySource.
bool : useTp1.
bool : useTp2.
bool : useTp3.
bool : useTp4.
bool : useTp5.
bool : useTp6.
float : tp1x.
float : tp2x.
float : tp3x.
float : tp4x.
float : tp5x.
float : tp6x.
float : slx.
Returns: check commented section: "Function @manageTrade".
showOnlyFirstOccurence(booleanInput)
Single out the occurence of a bool series between to 2 bool series.
Parameters:
booleanInput : to activate or deactivate occurences filtering.
Returns: filterred or not bool series.

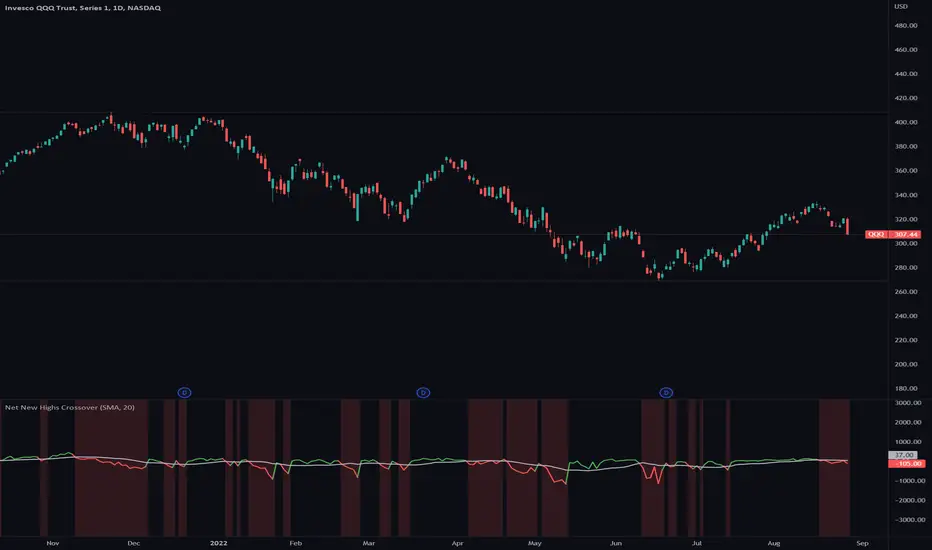
Net New Highs CrossoverA lot of traders have a hard time to get in and out of the market at the right time.
Net New Highs of stocks can guide you to increase or decrease your exposure based on the current market health.
They are calculated by subtracting the new highs of the new lows, based on all stocks of the NYSE, NASDAQ and AMEX.
+ A positive value shows that the market is doing good, since more stocks are making new highs compared to new lows.
- A negative value shows that the market is doing bad, since more stocks are making new lows compared to new highs.
Combined with a moving average you can see crossovers that can warn you early when there is a change in the current market health.
Features
■ You can select different Net New High indices or combine them (NYSE, NASDAQ and AMEX)
■ You can specify a moving average line ( SMA / EMA and length)
■ Use single color or two colors for the moving average line to better spot the crossovers
Hints
*New highs and new lows index values currently only get updated at the end of the day
*Only works on daily timeframe
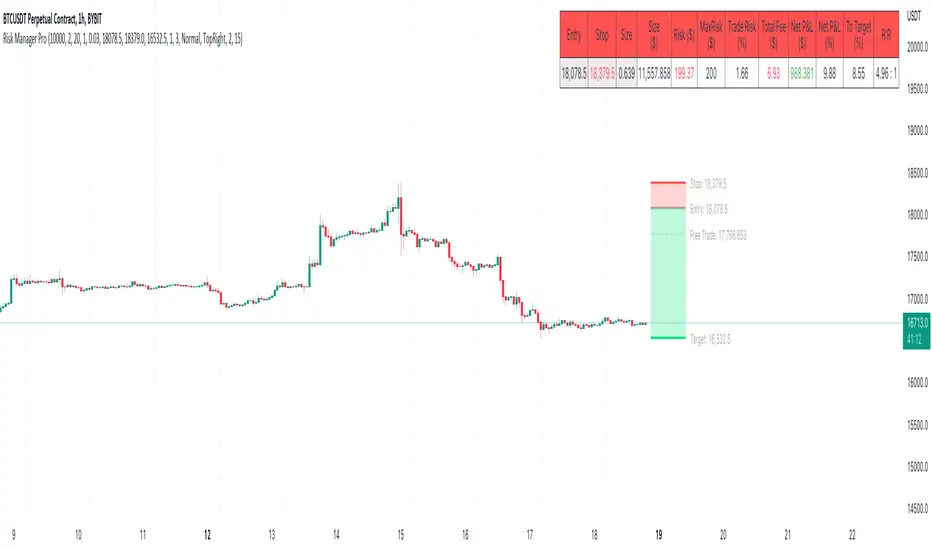
Risk Management & Position Size Dashboard ProThis version of the dashboard system factors in trading fees to your max risk to account per trade. This comes in handy when trading very low timeframes where trade risk can be tiny and leverage high where traditional position size calculations can yield huge position sizes where just the fees can far exceed your risk appetite. This system calculates your position size factoring in fees so you will never exceed your risk settings. Details below.
****
This indicator is designed to assist traders by instantly providing the necessary information to execute orders based on defined risk parameters. This is not an indicator that tells you WHEN to buy or sell, but HOW MUCH to buy or sell based on your risk appetite. The indicator is compatible with any strategy and any instrument
The indicator uses some great pinescript features, allowing you to drag and drop your levels directly on the chart for instant feedback from the risk management dashboard. Huge timesaver.
Instructions:
1. The first time you add the indicator to your chart, you will be asked to identify your Entry, Stop and Target levels by clicking on them directly on the chart. You can at any point adjust these levels directly on the chart, or you can manually enter them in settings
2. Setup your risk profile in the indicator settings:
(a) Current Capital: Enter the current value of your trading account
(b) Max Risk Per Trade: Enter the maximum % of your Capital you want to risk per trade
(c) Max Leverage: Enter the maximum leverage you want applied to your account. This comes in handy when you trade on very low timeframes where position sizes can become very large. No matter what you enter here, position size will never exceed Max Risk Per Trade
(d) Stop Ticks: Number of ticks to use above/below the identified high/low for stops
(e) % fee per trade: enter your brokers fees here to ensure the system takes this into consideration while calculating position size
(e) Use Current Price as Entry (Market Orders): By default, the system will use the entry level you have selected for limit orders. If you want to use the system to display data based on current price for market orders, select “Use Current Price as Entry (Market Orders)”
(f) number of TP levels: enter the number of TP levels you are planning to use to ensure the fees are calculated for them
3. Based on your stop and target levels, the system will automatically determine if you're looking to long or short and accordingly display all relevant data to you.
4. Display Free Trade Level: toggle this on to display the level you should exit 50% of your position to make the trade risk free
5. Dashboard / Text size / level colours and positions are customisable
The Dashboard displays the following information at all times:
1. Entry
2. Stop
3. Trade Risk (%): Percentage price difference between Entry and Stop
4. Max Risk ($): Currency value of loss if the trade is stopped out
5. Size: Position Size to execute your trade based on your risk profile/appetite
6. Size($): Position Size in currency value
7. Total Fees: Total fees for the trade based on settings above
7. P&L($): Potential profit to your Capital in currency value
8. P&L(%): Potential profit to your Capital in %
9. Risk to account: % risk to account - used as confirmation that the max risk to your account, factoring fees is circa your risk appetite
10. R:R: Risk to Reward Ratio
11. % to Target: Percent price needs to move to achieve your target
Hope this helps you with your trading. I built this as I was tired of wasting time opening up spreadsheets or calculators to execute trades - especially on lower timeframes. Making the code open source so if you do make improvements to this I'd love to hear from you. Also open to suggestions.
Happy Trading!
PrimeTrading ExposureThis indicator helps traders staying on the right side of the market and increasing their portfolio exposure as the market health improves.
Nothing kills more accounts than trying to pick a bottom by loading positions below all kma’s. What if the market rollover? Then you take a major hit on your p&l.
The goal is to increase your maximum allowable exposure as the market confirms his way above key moving averages (kma’s).
Market based maximum exposure PT rules:
■ Price < 50dma & Price > 5dma = 20%
■ Price < 50dma & Price > 21dma = 40%
■ Price > 50dma = 60%
■ Price > 50dma & Price > 21dma = 80%
■ Price > 50dma & Price > 21dma & Price > 10dma = 100%
Features
■ You can select the indices reference you prefer to calculate the max exposure ( IWM , QQQ , SPY )
■ You can see the price extension for kma’s (5,10,21,50 dma)
■ Use the current symbol or lock on your preferred reference indices

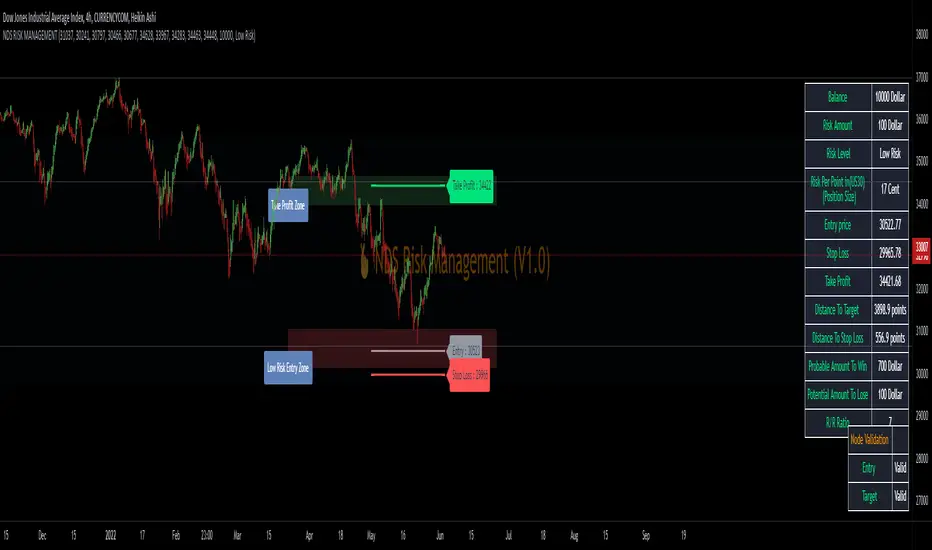
NDS RISK MANAGEMENT (V1.0)Here is a Risk Management Program that calculates stop loss and position sizing based on NDS analysis.
Inputs:
Entry: The First Symmetry Level T1.
Entry: The Second Symmetry Level T2.
Entry: The Node 1 Level
Entry: The Node 2 Level
Entry: The 86% Level
Target: The First Symmetry Level T1
Target: The Second Symmetry Level T2.
Target:
The Node 1 Level
Target: The Node 2 Level
Target: The 86% Level
Balance: Balance Amount
Risk Level: Percent that is risked of the Balance for one Trade
Output:
Risk Per Point
Stop Loss Price
Take Profit Price
Low Risk Entry Zone
Take Profit Zone
Disclaimer
The Following indicator/code IS NOT intended to be a formal investment advice or recommendation by the author, nor should be construed as such.
You declare to know the principles and risks of the financial markets. Therefore, you declare that you are aware of the financial risks involved in trading.
In this sense, the author can not be held responsible for errors, omissions, inappropriate investment, technical problems, events beyond his control, and, more generally, financial losses that you may realize, or results obtained in the practice of trading resulting from the markets.
Trading involves a high level of financial risk, and may not be appropriate because you may experience losses greater than your deposit. Leverage can be against you.
Do not trade with capital that you can not afford to lose. You must be aware and have a complete understanding of all the risks associated with the market and trading. We can not be held responsible for any loss you incur.
Trading also involves risks of gambling addiction.
سلب مسئولیت
این اندیکاتور /کد به منظور توصیه یا توصیه رسمی سرمایهگذاری توسط سازنده طراحی نشده است ، و همچنین نباید چنین تفسیر شود.
شما اعلام می کنید که از اصول و ریسک های بازارهای مالی مطلع هستید. بنابراین، شما اعلام میکنید که از ریسکهای مالی موجود در معاملات آگاه هستید.
در نتیجه، طراح در قبال اشتباهات، خطاها ، سرمایه گذاری نامناسب، مشکلات فنی، رویدادهای خارج از کنترل خود، و به طور کلی، خسارات مالی که ممکن است متحمل شوید هیچونگه مسیولیتی ندارد
معاملات دارای سطح بالایی از ریسک مالی است و ممکن است مناسب نباشد زیرا ممکن است زیان هایی بیشتر از سپرده خود داشته باشید. اهرم می تواند علیه شما باشد.
با سرمایه ای که نمی توانید از دست بدهید معامله نکنید. شما باید آگاه باشید و درک کاملی از تمام ریسک های مرتبط با بازار و معامله داشته باشید. ما نمی توانیم در قبال ضرر و زیان شما مسئولیتی داشته باشیم.
ترید یا معامله خطرات اعتیاد به قمار را نیز در بر دارد