Invest-Long : Script for quick checks before investingA simple script to verify RSI, SMAs, VWMA, and Pivots on Daily, Weekly, and Monthly time frames.
In case if you are not interested in SMA's or want to add different cheks -- simply copy the script to local and edit.
Happy investing.
Add the script to any chart and table values remain the same irrespective of current chart resolution, as it checks on Daily, Weekly, and Monthly time frames.
The table has multiple columns.
1st column checks on RSI value on all 3 timeframes. Ideally, look for all green and D>W>M
2nd Column: Check current Close is above 20 SMA and 50 SMA on Daily / Weekly / Monthly time frames
3rd Column: Check SMA 13> SMA 34, SMA 34 > SMA 55 and SMA 20 > SMA 50 on Daily / Weekly time frames
4th Column: Check Current close is above Weekly Pivot and Monthly Pivot. And also verify Close is above 4 Week High.
5th Column: Verify Close is above Daily VWMA. Also Daily VWMA is > Weekly VWMA and Weekly > Monthly.
// Similarly you can add more checks based on different time frames
Feel free to trouble me incase if need help.
Longterm

Balance of Power Heikin Ashi Investing Strategy Balance of Power Heikin Ashi Investing Strategy
This is a swing strategy designed for investment help.
Its made around the Balace of Power indicator, but has been adapted on using the Monthly Heikin Ashi candle from the SPY asset in order to be used with correlation for US Stock/ETF/Index Markets.
The BOP acts as an oscilallator showing the power of a bull trend when its positive and a bearish trend when its in negative. At the same time we can spot reversals, based on the percentiles ( 99/1)
The rules for entry :
For long : The 99 percentile is ascending, and we are either in a positive value (>0), or we crossed the bottom place ( -0.35)
For short : the 99 and 1 percentile are descending, and we are either in a negative value(<0), or we crossed down the top place ( 0.6)
If you have any questions please let me know !

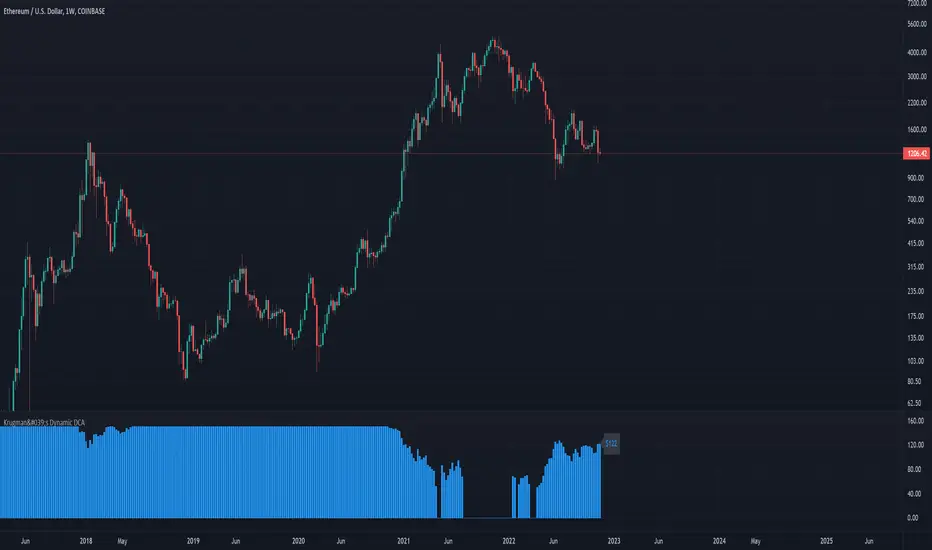
Krugman's Dynamic DCAThis script helps you create a DCA (dollar-cost averaging) strategy for your favorite markets and calculates the DCA value for each bar. This can be used to DCA daily, weekly, bi-weekly, etc.
Configuring the indicator:
- DCA Starting Price : the price you want to begin DCA'ing
- DCA Base Amount : the $ amount you will DCA when price is half of your starting price
- DCA Max Amount : the maximum amount you want to DCA regardless of how low price gets
The DCA scaling works exactly like the formula used to calculated the gain needed to recover from a given % loss. In this case it's calculated from the DCA Starting Price . The idea is to increase the DCA amount linearly with the increased upside potential.
Buffett Indicator: Wilshire 5000 to GDP Ratio [WhaleCrew]Our Implementation of the famous Buffett Indicator a long-term valuation indicator for stocks.
Calculation: Wilshire 5000 Index divided by US GDP (Gross Domestic Product)

FieryTrading Long-Term Bitcoin Investor ToolDear community,
Today I want to present you one of my favorite scripts for long-term Bitcoin trading. I'm publishing this script because I think it will help traders to become more profitable in the long-term. Consequently, this script is targeted at long-term investors only, since it can take years before the price goes from the green area to the red area.
To use this script correctly you will need to use the BTCUSD index from Tradingview. Search "Bitcoin Index" in your symbol search bar, top result. Use daily candles on a logarithmic scale.
This scripts consists of two price bands, green and red. The green band has historically been a great area for the accumulation of BTC, whilst the red area has historically been a great area for exiting BTC. You could say that if the price is in (or below) the green bands BTC is undervalued, with the opposite being true for the red bands.
If you wish to add alerts to this script, simply click on the alert button > condition=Fierytrading BTC Tool. You can add alerts when the price enters the green area (Buy Area Cross) or red area (Sell Area Cross).
This simple script has historically proven to be very efficient at identifying bottoms (accumulation) and tops (distribution). Be aware that the usability of this script is not guaranteed in the future.

TrendTracers Bitcoin Stock to Flow ModelFor the best results, make sure to view this indicator on a bitcoin chart with a very long history (e.g. BNC:BLX)!
This model treats Bitcoin as being comparable to commodities such as gold, silver or platinum. These are known as ‘store of value’ commodities because they retain value over long time frames due to their relative scarcity. It is difficult to significantly increase their supply i.e. the process of searching for gold and then mining it is expensive and takes time. Bitcoin is similar because it is also scarce. In fact, it is the first-ever scarce digital object to exist. There are a limited number of coins in existence and it will take a lot of electricity and computing effort to mine the remaining coins still to be mined, therefore the supply rate is consistently low.
The stock-to-flow model predicts value changes in a straightforward manner. It compares an asset’s current stock to the rate of new production, or how much is produced in a year.
Calculation:
Take bitcoin production in a period, divide it by that period and then multiply by 365 to get the estimated yearly production and then calculate the stock to flow.
yearlyFlow = ((stockChange) / period ) * 365
stockToFlow = (stock - missingBitcoins) / yearlyFlow
Model Value = -1.84ᵉ * stockToFlow³.³⁶ (mathematical model to calculate the model price)
For more information about the calculations followed: stats.buybitcoinworldwide.com
Features:
Works on the Daily, Weekly and Monthly Timeframe.
Allows you to adjust between a 10-day period and a 463-day period.
Has the option to account for missing bitcoins, lets you adjust the amount of missing bitcoins.
The ability to toggle a standard deviation of the Model Value with a multiplier of 1, 2 or 3
Displays a Stock to Flow Deviation Ratio: If the Deviation Ratio is close to 0 it means the price of Bitcoin is close to the Model Value Line(or Stock to Flow Ratio). If the Deviation Ratio is close to 1 or -1, it means the price of bitcoin is near the selected deviation levels.
You can toggle between the Overlay version and the Oscillator version, default is on Oscillator version. If you want to switch: Untick Oscillator mode in the indicator settings, click on the three dots and select "move to existing pane above". Then click on the three dots again and select Pin to scale A. Done!
As a bonus: Now you can toggle a "1-year Realized Price" graph, while it's not officially part of the Stock to Flow Model it does share similar technicals about supply and scarcity. The 1-year Realized Price is the realized market cap divided by total amount of generated coins.
I just noticed that, while the color gradient function is pretty cool, it does not allow for end users to customize their colors after applying this indicator to their chart. Sorry!

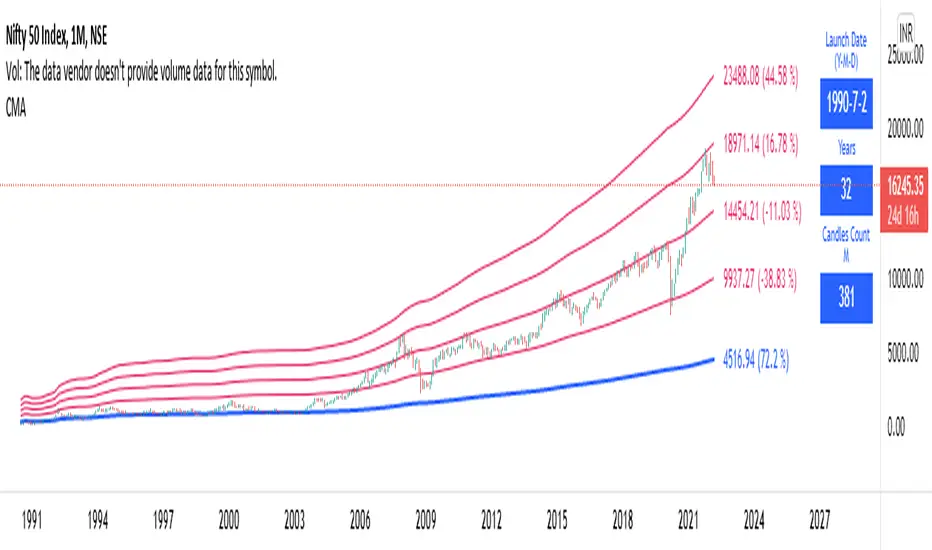
Long Term: Cumulative Moving AverageWho to use?
This indicator is for Long Term Investors or for Position trading and not for Day traders.
What time-frame to use?
• Daily, Weekly or Monthly
What is Blue line?
• Blue line is Cumulative Moving Average. It is cumulative sum of closing price.
• It is a trend reversal level.
• It is a strong support level.
• If price is below Blue line better not to take any Long position until it crosses above it.
What are Red lines?
• Red lines are Multiplier levels.
• These are target levels to exit the position.
• It can be breakout or pull back levels.
• The level combination numbers can be fully odd or even numbers.
• For example in certain stocks the working levels will be 1x, 3x, 5x etc., in others it will be even numbers like 2x, 4x, 6x etc.
• In some cases the levels need to be tweaked with custom decimals like 1.1x, 2.1x, 3.1x, 4.1x etc. to align the support & resistance levels.
How to use?
Entry
• Enter when the Price reach closer to the Blue line.
• Enter Long when the Price takes a pullback or breakout at the Red lines.
Exit
• Exit position when the Price reach closer to the Red lines in Long positions.
Indicator Menu
• Works only in higher time-frames like D, W & M.
• Will not work in Lower time-frames less than "D" or the Launch Date shows wrong in Lower time-frames.
Multipliers:
(Read above What are Red lines?)
Launch Date:
• Launch Date: Starting date of stock when it appeared in the exchange. Works only in D, W & M timeframes.
• Years: Total number of years from the Launch Date. Accurate date will be shown in Daily timeframe.
• Candles Count: Total number of candles from the Launch Date in the current timeframe.
Labels:
• First number is last traded price.
• Second number in () is percentage change from last traded price to that level.
Vwap SalvatierraVwap Salvatierra. an indicator that must be accompanied by other volume indicators.
Benefits:
- Long term Vwap.
- Middle Std. deviations, Calculated automatically.
- Previous zones available.
How to use:
when the price is >= stdev+3, look for shorts till came back to vwap
whe the price is <= stdev-3, look for longs till came back to vwap
if the vwap cannot be broken, as resistance, after several attempts, then sell
if the vwap can't be broken, like support, after several tries, then buy.

Profit Maxima: a crypto strategyThis strategy is designed for those who are looking for long-term positions with low risk and high profitability.
How does it work?
In short, the basis of this strategy is the frequent modeling of the price using regression equations and the estimation of the range of price movements.
The price modeling process starts from the first bars and will be repeated on each bar. This process is performed in each candle based on the data available up to that candle, and data for subsequent bars is not used.
There is also no fixed price model, but it will change from one candle to the next; Therefore, the more candles there are, the larger the statistical population and therefore the quality of the price model increases.
I have also used the concept of scarcity. Bitcoin is the first scarce digital object in the world. Once something becomes scarce enough, it can be used as money. This scarcity gradually increases and affects the price. The entire crypto market also follows Bitcoin.
However, always remember that past results in no way guarantee future performance.
Why this strategy generates a small number of trades?
Preston Pysh believed Bitcoin cycles happen in three phases: the Bull Run, the Correction, and the Reversion to the Mean. He estimates there are about 200,000 blocks per cycle and there are about 144 blocks per day.
Therefore, each cycle of Bitcoin lasts about four years. The entire crypto market follows bitcoin. On the other hand, cryptocurrency is a new phenomenon. They have a limited price history.
This strategy is designed to open a long position at the lowest possible price. In addition, due to the concept of scarcity and its continued impact on prices, trading in the “short” direction is avoided.
The combination of these factors leads to generate a small number of trades. However, you can test it on several different charts to make sure it works properly.
Default settings
{ default_qty_type } = strategy.percent_of_equity
{ default_qty_value } = 3.3
{ commission_value } = 0.1
{ pyramiding } = 3
{ close_entries_rule } = "ANY"
In a simple word, buy (Entry) and sell (take-profit) orders are each done at three different levels. At each level, 3.3% of equity is used (9.9% in total)
0.1% commission is considered for each transaction.
“close_entries_rule” determines the order in which orders are closed. The default is FIFO (first in, first out), but in this strategy, orders are executed in “first in, last out” order. In this way, the lowest buy (Entry) order corresponds to the lowest sell (take profit) order.
Choose the best chart
Charts have a significant impact on the performance of the strategy. As mentioned, the more historical bars there are, the larger the statistical population and therefore the quality of the price model increases.
You can use the Chart Quality panel to choose the appropriate chart:
The ‘Historical Bars’ field shows the number of candles in the chart. Choose the chart of an exchange that has the most historical bars.
The ‘Recommended Chart’ field shows the suggested chart for some symbols.
The “Predictability” field indicates to what extent price movements can be predicted using the model; the higher the “predictability”, the more credible the results of the strategy. "Predictability" indicates that the results of the strategy are reliable or not.
The image below shows the recommended chart for 20 different symbols:
How to use
You don't need automated trading platforms to use it. It can be used by placing simple buy and sell (take-profit) orders manually.
The green and red lines indicate the 'Entry' and 'Profit' levels respectively. If there is no order (buy / sell) active on one of these levels, it will be displayed in gray. The corresponding values are displayed in the Entry & Profit Limits table.
After choosing the appropriate chart, you can use this table to place your orders manually.
Note that trading in the "short" direction is not recommended at all.
Samples

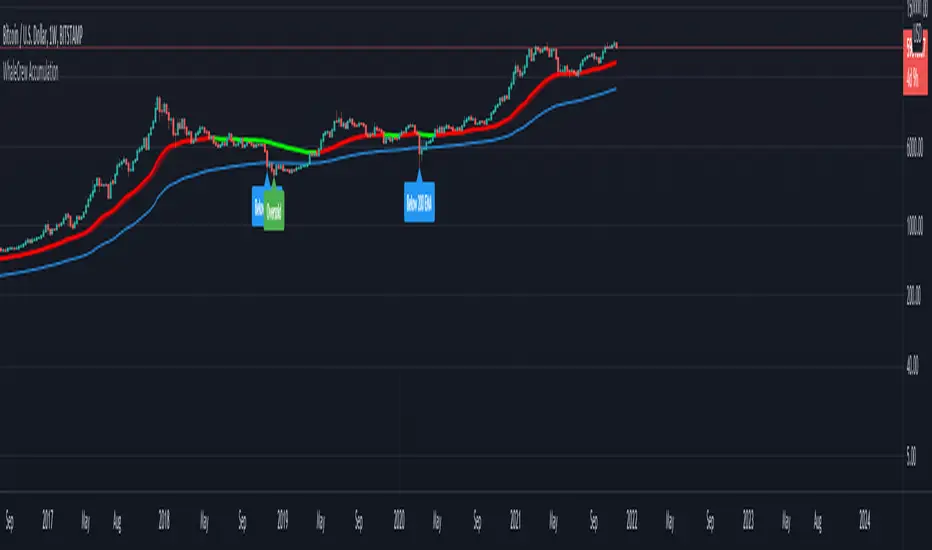
WhaleCrew AccumulationThis script was built for the BTC weekly chart.
Purpose: Accumulation of longterm (spot) holdings.
Bull Market Support-Band:
Bundle of the 20 EMA & SMA
Often acted as support during previous bullmarkets
Some people like to trade retests/breaks of this band
Accumulation-Band (+ alerts):
Green: Possible Accumulation/DCA Opportunity
Color might change while candle is still open (e.g. Weekly Candle - 19 Jul '21, flipped green -> closed red)
Labels (+ alerts):
Break of the 200 Weekly EMA
Oversold RSI (< 30)
The DD investThe script tells me when to invest in the stock.
Split ur money into 3 piles. Each must be bigger than the previous one.
Buy with the first pile when the chart touches the middle line (SMA200).
Buy with the second pile when the chart touches the bottom line (lowest price of 200 weeks).
Buy with the third pile when the chart goes significantly below the bottom line (lowest price of 200 weeks).
Watch only the W1 chart (!!!).
Circles on the chart indicate places where you should buy (examples).
Consider selling half of the holding when the chart touches the top line (the highest price of 200 weeks).
Hold the rest much longer then you plan to ;)

Moses Long-term Index ETF Investing StrategyMoses is a script designed for long-term Index ETF investors.
Moses Goals.
1. Alerts you when a major crash is starting or is underway (Bear Market Signal)
2. Warn you of price events in the market that may lead to increased volatility and downward price pressure (Shock Event Warning)
3. Clearly inform you when the market is in a bull phase (growing) or bear phase (decreasing) (Bull/Bear Signal)
4. Inform you if the market is showing early signs of recovery from a crash
5. Alert you to catastrophic events, which are extreme one bar price drops (typically occurring before or during a major stock market crash)
Moses Logic.
Moses is the product of years of testing, but the application of the logic is simple.
1. Moses is designed specifically to work on a weekly chart (5 days per bar). Do not use the scripts on daily, monthly, or intraday charts
2. Moses Uses 4 Moving Average Indicators
3. Moses uses the position of price and the moving averages to determine the state of the market (Bull/Bear/Recovery)
4. Moses uses price action to determine shock events and catastrophic event warnings
5. The script is hardcoded to start trading in 1997. Why? So that the script's primary goal of avoiding crashes is tested on 3 major crashes, the Dotcom 2000, the Financial Crisis 2008, and the Corona Crash in 2020.
How Moses Works
Being able to exit the market before or during a large market crash enables you to preserve a portion of your equity from decline. Buying back into the market on a Bull Market or Early Recovery Signal enables you to enter the market at a lower price. This goal is achieved during major crashes.
As with all scripts, there are false signals which may incur a losing trade; you can see in the strategy tester results the % of Winning/Losing Trades.
Strategy Setup In Tradingview
Initial Capital $10,000
Order Size 100% of equity (this is because it is a long-term strategy with only one trade in play – you are either long or not invested, using a smaller position size means you cannot meaningfully compare a Moses strategy to a Buy & Hold Strategy)
Commission is $5 per trade (this is negligible because the strategy only trades at most once per year)
Slippage – 10 ticks
This Script Displays the 5 Main MOSES Signals Directly On Your Chart To Help Your Investing Decision Making
1. Bull Market Signal - Green
2. Bear Market Signal - Red
3. Stock Market Recovery Signal - Amber/Yellow
4. Shock Event Warning - Shock Label on Price
5. Catastrophic Event Warning - Red Catastrophe Label
Includes 5 Moses Scripts
• Moses Signals 2.0 (plots all alerts directly on the price chart)
• Moses Buy on Bull - Sell on Bear (Plots a buy on the first Bull Market Signal - Closes All Positions on a Bear Market Signal)
• Moses Buy on Bull - Sell on Catastrophe (Plots a buy on the first Bull Market Signal - Closes All Positions on a Catastrophic event)
• Moses Buy on Recovery - Sell on Catastrophe (Plots a buy on the first Recovery Signal - Closes All Positions on a Catastrophic Event)
• Buy & Hold Script (Used to compare the effectiveness of the strategies versus a Buy and Hold Strategy)
As the script has 3 Moses Strategies, the idea is that you choose the strategy that best fits the ETF you are trading.
Moses is a long-term investing strategy that has historically outperformed the US and European Major Indices for the last 24 years. There is no guarantee of future performance.
Moses has outperformed the market (buy and hold strategy) from 1997 on the:
Nasdaq 100, S&P500, Russell 3000, Nasdaq Composite, EuroStoxx 50, Italian Milano Borsa, German DAX, Paris CAC40
Moses does not outperform the market on:
Nifty 50, BSE Sensex, ASX 200, Chinese Market
Backtested Performance
Test Timeframe Jan 13 1997 - Sept 21 2021
Duration Years 24.75
Initial Investment $10,000
North America Strategy-------------------------------$ Return------------CAGR-------Total %
Nasdaq 100 Buy & Hold----------------------------$176,380-----------12.30%------1664%
Buy Bull - Sell Bear------------------$288,554-----------14.55%------2786%
Buy Bull - Sell Catastrophe---------$202,491-----------12.92%------1925%
Buy Recovery - Sell Catastrophe---$229,866-----------13.50%------2199%
North America Strategy-------------------------------$ Return-----------CAGR------Total %
S&P 500 Buy & Hold----------------------------$58,122-----------7.37%------481%
Buy Bull - Sell Bear------------------$48,544-----------6.59%------385%
Buy Bull - Sell Catastrophe $59,573-----------7.48%------496%
Buy Recovery - Sell Catastrophe $64,579-----------7.83%------546%
North America Strategy-------------------------------$ Return-----------CAGR------Total %
Russell 3000 Buy & Hold----------------------------$61,363-----------7.61%------514%
Buy Bull - Sell Bear------------------$52,957-----------6.97%------430%
Buy Bull - Sell Catastrophe---------$64,027-----------7.79%------540%
Buy Recovery - Sell Catastrophe---$71,565-----------8.28%------616%
North America Strategy-------------------------------$ Return-----------CAGR------Total %
Nasdaq Composite Buy & Hold----------------------------$112,839-----------10.29%------1028%
Buy Bull - Sell Bear------------------$123,308-----------10.68%------1133%
Buy Bull - Sell Catastrophe---------$107,699-----------10.08%------977%
Buy Recovery - Sell Catastrophe---$112,453-----------10.27%------1025%
*CAGR - Compound Annual Growth Rate
From a Declaration of Principles jointly adopted by a Committee of the American Bar Association and a Committee of Publishers
This work is provided to you for informational purposes only and should not be construed as an offer to buy or sell a particular security or a solicitation of offers to buy or sell a particular security. The author may make available certain information related to the potential price movement of particular securities. By reading this report or using the training materials, you acknowledge and agree that any reliance upon the content or data available is at your own sole risk. You are strongly advised to use your own judgment, your own research, and question everything. The information is generic in nature and not targeted to individuals or individual circumstances. The author is an independent investor and is not licensed to give formal Stock advice to the individual, run funds of any type, or accept fees for individual stock advice. The Author accepts no responsibility for loss of money for following any of the lessons or systems created. Trading of securities may not be suitable for all users of this information; if in doubt, seek a professional advisor. All use of this work is at your sole risk.

Trend Momentum with Buyers / Sellers PowerHi there!
With this indicator, you can hunt big trends before they start.
This indicator is combined with RSI and Momentum indicators
It can show you the power of trend and which side it wants to go
It can help you to open a position at the first point of a new trend or at the safe and proven point of the trend, also it can help you to close your position before the trend change its direction (it's not recommended to use it to close your positon, but sometimes it can help you to find the ending point of big pumps)
Rules:
* Baseline is ZERO ( 0 ) line
* When gray line crossover red line, it shows us a powerful uptrend
* When the gray line crossunder the red line it shows us a powerful upward trend
Signals:
* Only use Buy signals(Long) when they are above or crossing-up baseline
* Only use Sell signals(Short) when they are under or crossing-down baseline
* If they both (red and gray lines) are too high and they suddenly starting to come back to baseline, it shows we have a range trend, the trend is weak or a reversal trend is coming!!
!! WARNING: DO NOT USE THIS INDICATOR ALONE !!
Suggestions :
-Use 1H, 4H, daily, or Weekly timeframes
-Use ADX and DI or three WMA's
-Use divergence
-You can use it for scalping but you need to change the inputs (not recommended)
If you have any idea about making new indicators(what information do you want from the chart?), comment please, then I can research and make it for all of us! =)

Godtrix's Crypto HA+RSI+EMA+ATH+DCA Strategy 3.0New Updates is here! Upgrade from previous version 2.0 (Please avoid using v2.0 as it's outdated.)
Great stability, Repaint bug fixes, and New features!
==================
| Introduction: |
==================
This is a Long Term Strategy, using compounding profit method, it can generate high returns, but it also risk for losses, this can be overcome if you set Stop Loss to over 25% for bitcoin & 60% for Altcoins.
Best profit plan with this strategy is you trade on Future leverage while you hold on to your coin, so that when price goes up, your coin value goes up, and at the same time, you trade with your leverage to earn even more, easily doubling up your total profit.
Benefits:
Fully customizable and you can easily personalized it and FINE TUNE it according to the market or coin you trading on.
The strategy is based on REAL PRACTICAL trading skills, so it works in real-world.
I fixed the "repainting" issue so the backtest it shows you IS ACCURATE when you run for real-time.
We all know one indicator is not going to help you win your trades, so this strategy combines ALL three: EMA for long+short term trend, HA for short term trend, RSI for entry/exit
This strategy is designed for LONG trade (Buy low, Sell high), not for SHORT trade.
This is not day trading, it is more to mid-term trading, where there's only few trades per month
Mainly is coded to work with 3Commas bot auto trading, so you only need to key in your Bot ID & Email Token.
Bot trading NOTE:
- You need to replace the Alert Message with this: {{strategy.order.alert_message}}
- And you'll need the Bot's webhook Url set with the Alert too.
- One Alert will work for both Buy and Sell Order
- If you using other Bot service, you can enter Custom Command in Input Settings too, it works on any bot service.
Lastly,
regarding the setting advice, I would say you try playing with different settings and your objective is to achieve a backtest result that has:
1) Profitable is > 80%
2) Losing trades is nearly 0 or below 25% of your winning trades. Trick is using far stop loss %
3) Net Profit be almost same or more than "Buy & Hold Profit"
==================
| Latest Updates: |
==================
=| Tidy Up Codings |=
- Group input fields so it'll be easier to understand and find the settings
- Upgrade code for obsolete 'transp' options
=| Repaint Issues |=
- Previous v2.0's RSI has repaint issue, creating false result against real-time data. I've fixed this.
- Also done fine-tuning other parts of the codes to prevent possible repaint issues.
=| Bot System |=
- Improved Custom Bot system, so that you're able to set dynamic order size/quantity with my custom keyword: and
Base Order Example:
{ 'message_type': 'bot', 'bot_id': 1234567, 'email_token': 'abcdefgh-1234-1234-1234', 'base_order': , 'delay_seconds': 0, 'pair': 'USDT_BTC'}
=| EMA Downtrend Exit |=
- Added option for you to decide whether to close position when detected EMA Long term downtrend.
=| EMA 2 (short term) is removed |=
- After several test, I've decided to remove this because it doesn't contribute to improving the results.
=| Heikin Ashi System |=
- Improved the chart display, now you'll see the HA candle 'shadowed' behind, so you'll see both actual price candle and HA candle at same time.
- Added the system that detect the HA candle sizes to decide specifically when it's suitable for Entry and Exit.
>> For "Entry/Exit Range"
- This means after HA is valid for Entry or Exit, how many following bars are allowed to stay valid so it will match other requirements to be completely fulfilled for Entry or Exit.
>> For "Crossing Interval"
- This means after detected HA line crossover, how many HA intervals is allow to Entry or Exit
>> For "Reversed Exit"
- This function let's you decide whether to close position if after HA bull (green candle) changed into HA Bear (red candle)
=| RSI A Entry |=
- Added option to avoid Entry during NTZ (No trade Zone)
- Also added the option to avoid next same condition RSI A entry too soon
=| RSI B Entry |=
- This function is for Entry if RSI is going very low, mostly due to bigger price drops in short time, it's good for buying DIP, however we'll never be able to know when a DIP ends, so do more test on this settings before put into real use.
- Added "avoid" options to help avoid getting Entry at "false" DIP, more like a short & fast pullback which causes RSI to drop very low but actually the price is near ATH or Recent High.
- Added option for Entry with Trailing Price Lower Buy combine with a limit order that grabs low price, so whichever it fulfill first.
=| New: Avoid Entry |=
- Well, it's a pain if you bought at the top, so I've added two options that will avoid buying near ATH and Recent High.
=| Time-limit Removed |=
- Sorry that I've missed look on the script policy which I'm not allowed to put a time-limit for public scripts.
=| System Improvements |=
- HA condition detection is optimized and bug fixed
- RSI values now reads accurately on each bar despite using higher timeframe, especially when moving to next interval
=| New: Dollar Cost Averaging (DCA) Orders |=
- Although DCA strategy is not appealing for Long term strategy, but I've added it for your extra options and flexibilities.
- The settings are quite straight-forward and standard, so I won't be explaining here.
=| New: Backtest Start & End Date |=
- This is very good function when you need more accurate result starting at specific date & time.
- Also if you set the date & time for your real trading starts, it'll much result the same as your actual trading records, which helps you to see clearer and make future decisions.
Any found bugs or flaws, please feel free to PM me, I can't get notifications from comments here below, so I'll not able to reply you the soonest possible, still not sure how to turn on notification for comments, anyone who knows can PM and teach me, lol... Thanks in advance!
Well, this is free version, hope it helps! Feedbacks are all welcome :)
(To Moderators: I've fully use the "f_security()" guideline, but instead of creating a separate function, I apply directly on all security() function. Please don't ban my script before fully check if I've truly fixed repaint. Thank you.)
BITSTAMP:BTCUSD COINBASE:BTCUSD COINBASE:ETHUSD BINANCE:BNBUSDT

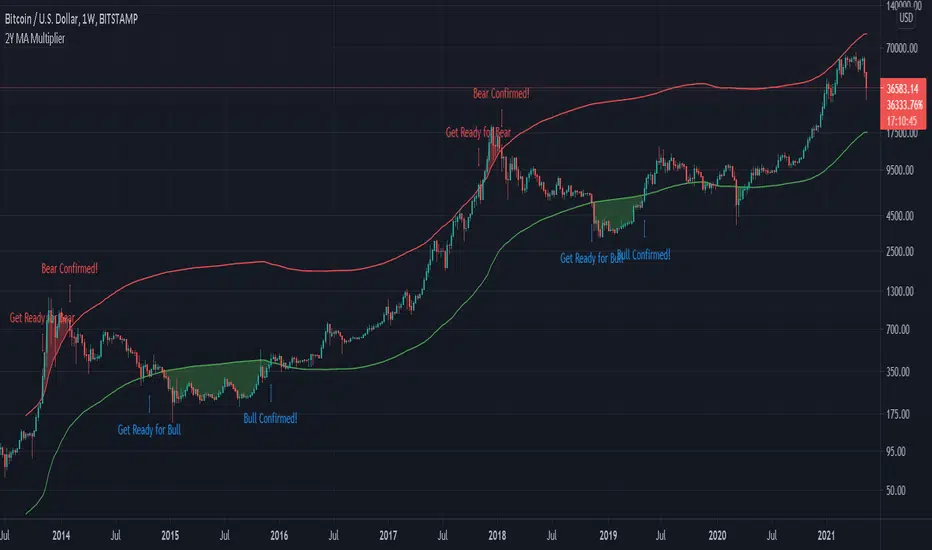
Bitcoin 2-Year MA Multiplier by GodtrixHi guys, I found this tool very useful and accurate, but can't find it on Trading View, so I made one for myself and everyone here ;)
Alert is available too.
Indicator Overview
The 2-Year MA Multiplier is intended to be used as a long term investment tool.
It highlights periods where buying or selling Bitcoin during those times would have produced outsized returns.
To do this, it uses a moving average (MA) line, the 2yr MA, and also a multiplication of that moving average line, 2yr MA x5.
Note: the x5 multiplication is of the price values of the 2yr moving average, not of its time period.
Buying Bitcoin when price drops below the 2yr MA (green line) has historically generated outsized returns. Selling Bitcoin when price goes above the 2yr MA x 5 (red line) has been historically effective for taking profit.
Why This Happens
As Bitcoin is adopted, it moves through market cycles. These are created by periods where market participants are over-excited causing the price to over-extend, and periods where they are overly pessimistic where the price over-contracts. Identifying and understanding these periods can be beneficial to the long term investor.
This tool is a simple and effective way to highlight those periods.
Credit to & Created By
Philip Swift
Date Created
July 2017
BITSTAMP:BTCUSD
Ravih Pro Trend BreakoutThis is a Trend Breakout Strategy on “DAILY Time-frame”
This Strategy is designed keeping in mind with Medium to Long Term traders. The strategy works only on Daily Time-frame and on Closing Price.
The concept here is to identify assets with potential change in trend. Primary focus is to position for the big move. There are times... trying to catch every trend, many of which can be unprofitable especially in side-way market. However, the primary purpose of this strategy is to catch all the major trend movements, which are much more profitable than minor market losses in all the side-way market.
I’ve simplified it to make it user-friendly.
How to use?
Set it to Daily Time-frame.
Buy, Take Profit 1,2,3 and Exit signals are included on chart based on the current Trend direction. The system shows an Exit signal if the system’s exit conditions are met. It works only on Daily Time-frame and on Closing Price.
Dark Blue Up Triangle denotes Buy at the Closing Price. Entry Price is Closing Price or with + or – 2% tolerance of the Closing Price for the following market day.
Purple Down Triangle denotes Exit to close any remaining position to free up capital.
Little Green Up Triangles denote the Bulls are in Control and Overpowering the Bears and represents minor Buying opportunities with strong probability of continuing up-moves.
Setting Up Alerts
The user has the option to Setup Alerts for all chart signals that is…
For Buy, for Exit, for Take Profit 1 set at 24%, for Take Profit 2 set at 48% and for Take Profit 3 set at 72%
The user also has the option to adjust the Take Profit as per their desire. However, the predetermined Take Profit set for this strategy does work reasonably well.
Remember...
This strategy is only built for stocks. It is Not for Indices neither for any other financial instruments.
No SHORT signals in this strategy.

Momentum Indicator avg short return minus avg long returnAverage daily return over the period 2-12 months ago minus the average daily return over the period 1-5 years ago
=> a higher return 2-12 months ago indicates a higher return in coming months according to research, because of the momentum risk factor premium
=> a higher return 1-5 years ago indicates a lower return in coming months according to research, because of the momentum risk factor premium

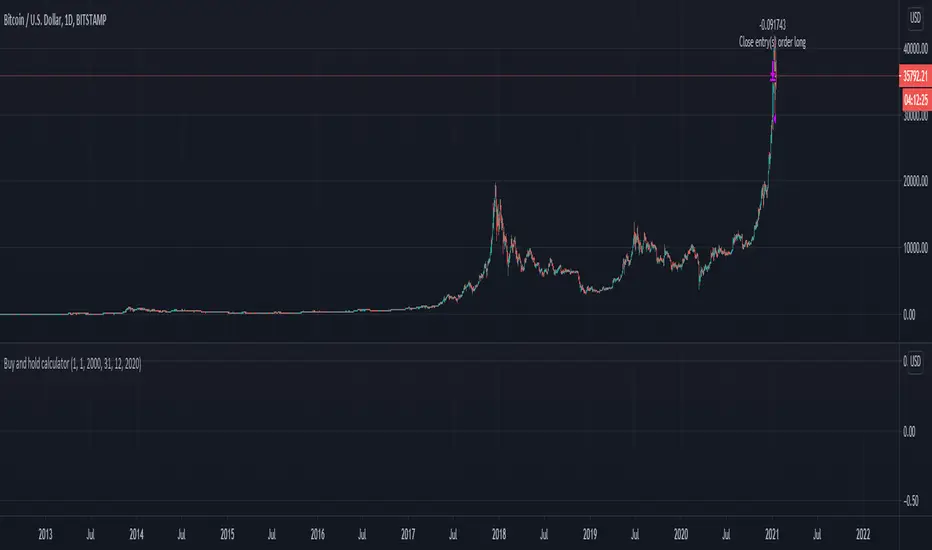
Buy and hold calculatorThis is a simple buy and hold calculator.
You have an initial date and once that dated it passed it will sell the product that was bought initially.
This strategy buys and sell 100% of the initial volume.
Buy the Dips (by Coinrule)Taking your first steps into automated trading may be challenging. Coinrule's mission is to make it as easy as possible, also for beginners.
Here follows the best trading strategy to get started with Coinrule. This strategy doesn't involve complex indicators, yet was proved to be effective in the long term for many coins. Results seem to be improved when trading a coin vs Bitcoin.
The strategy buys the dips of a coin to sell with a profit. A stop-loss protects every trade.
Crypto markets offer high volatility and, thus, excellent opportunities for trading. Excluding times of severe downtrend, buying the dip is a simple and effective long-term trading strategy. The buy-signal is set to a 2% drop in a 30-minutes time frame.
Each trade comes with a take profit and a stop loss. Both set at 2%.
You can adjust these percentages to the market volatility as an advanced setup. You can backtest the outcomes using the backtesting tool from Tradingview
The strategy assumes each order to trade 30% of the available capital. A trading fee of 0.1% is taken into account. The fee is aligned to the base fee applied on Binance, which is the largest cryptocurrency exchange.

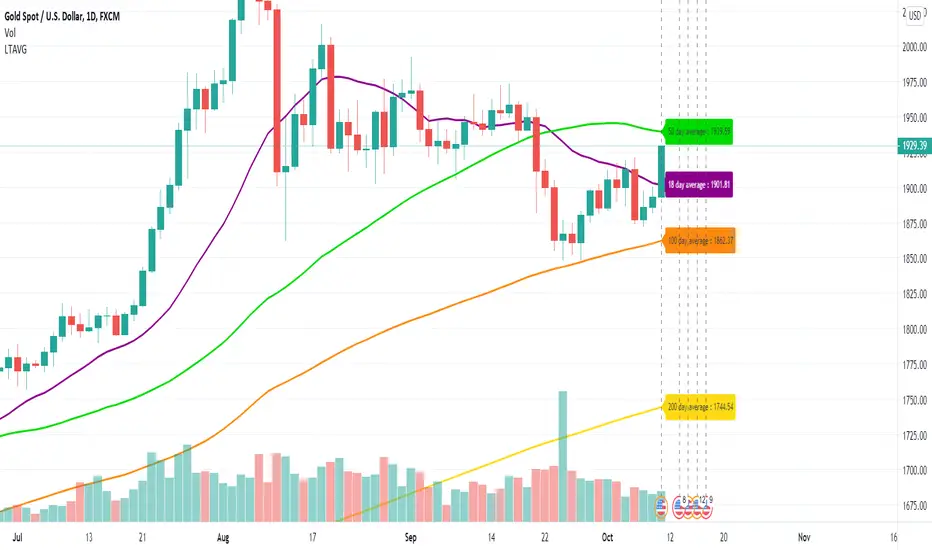
Long Term Moving AverageThis scripts plots the long term moving average calculated daily for 4 sets.
The default averages are:
18 day
50 day
100 day
200 day
The settings can be used to flexibly change this and to hide / show labels
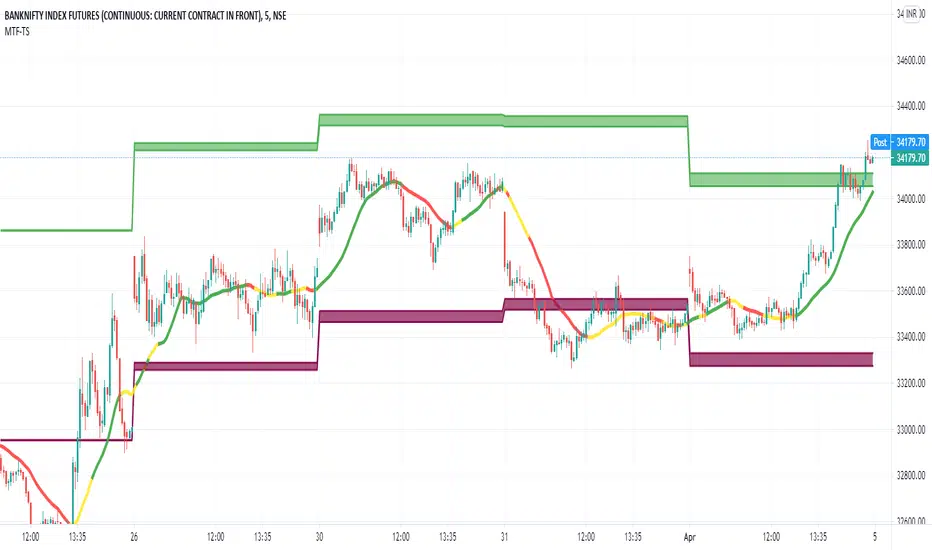
Multi Time Frame - Trade SetupsMuti Time Frame - Trade Setups
How does it work ? Price movements over range of period is used to compute the range moving forward.
As the option for wider time periods are selected more candles are selected for calculation
The Trend Line is the supporting factor to this logic and SMA20 is used as the basis of the trend line.
To Indicate the strength of the trend line , RSI is computed over multiple timeframes and then used to colour the trend line to show its strength
Once the Range is identified it can be considered as the Breakout/Breakdown zones or as the Potential Reversal Zones (PRZ)
How to Deploy / Use
As part of the Indicator there are four Choices that the user can opt for
Show Intraday Trades - This works for Intraday Trades - when the resolution is kept to less than 1 hour ( Say 3 , 5 , 10 , 15 Mins)
Show Short Term Trades - This works well when the resolution is kept to 1 Day - Good for Swing Trades spanning over a few days
Show Long Term Trades - This works well when the resolution is kept to 1 Day or Week - Good for Investments
Show Trend Line - Will show the user the Simple Moving Average 20 based on the resolution selected , The Trend Line Is a repainted based on the hybrid RSI Logic
The Trend Line would show in three colours
Green : T he Setup is in Up Trend- Try to take the trade as closer to the band as possible and when it continues to be in green ( and recommended when it would have just crossed from Red/Yellow to Green )
Red : The Setup is in Down Trend - Try to take the trade as closer to the band as possible and when it continues to be in red ( and recommended when it would have just crossed from Green/Yellow to Red )
Yellow : The Setup in sideways Trend ( a new trade isnt recommend in this band
Visual Checks - It is always recommended to enter/exit the trade it it touches crosses over the Trend Line from one side to the other
When closer to the support resistance bands , wait for a confirmation candle to determine if you are getting resistance breakout / support or breakdown
Stop Loss - That should be done by following ones risk appetite , Ideally the open/close of the previous candle should be the stop loss for the buy/sell
but everyone has their own Risk Management Strategies based on the capital deployed.
Usage/Markets : Index Trading / Equities and on proper analysis you may use it for Option Trading also. - Doesnt work that well with Commodities and Currencies
Disclaimer : There could be scenarios when the breakout/breakdown candle is rejected , especially when it is long one
so it is always recommended to have a confirmation candle that open-closes above the breakout candle / open-closes below the breakdown candle
If you like it and find it useful or if you find a defect or bug , Please let us know in the comments .. that would encouraging !! for us to develop it further
Thank you and have a beautiful and Profitable trading session !
How to get access
Please click on the link / email in the signature or send me a private message to get access
Feedback
Please click on the link/email in the signature or send me a private message for suggestions/feedbacks
Detrended Price OscillatorTHIS IS THE INDICATOR VERSION
What is DPO?
A detrended price oscillator is an oscillator that strips out price trends in an effort to estimate the length of price cycles from peak to peak or trough to trough. Unlike other oscillators, such as the stochastic or moving average convergence divergence (MACD), the DPO is not a momentum indicator. It highlights peaks and troughs in price, which are used to estimate buy and sell points in line with the historical cycle.
(From Investopedia )
Indicator features:
Responds faster to trend changes than the original code.
Added alternative smoothing algorithms. Defaults to Ehler's Optimum Elliptic filter instead of the orginal SMA
IPOCS - can start printing out data at day 1 instead of waiting for 14 or 20 bars
Dynamic colors
Auto timeframe detection to adjust period/length
How to use:
Buy above zero
Sell below zero
Who is it for?
Long term investors - this is the perfect indicator for those who buy and hold
Timeframe usage:
Works best on the weekly and monthly chart. Again, this is an indicator for long term trades, not day trading

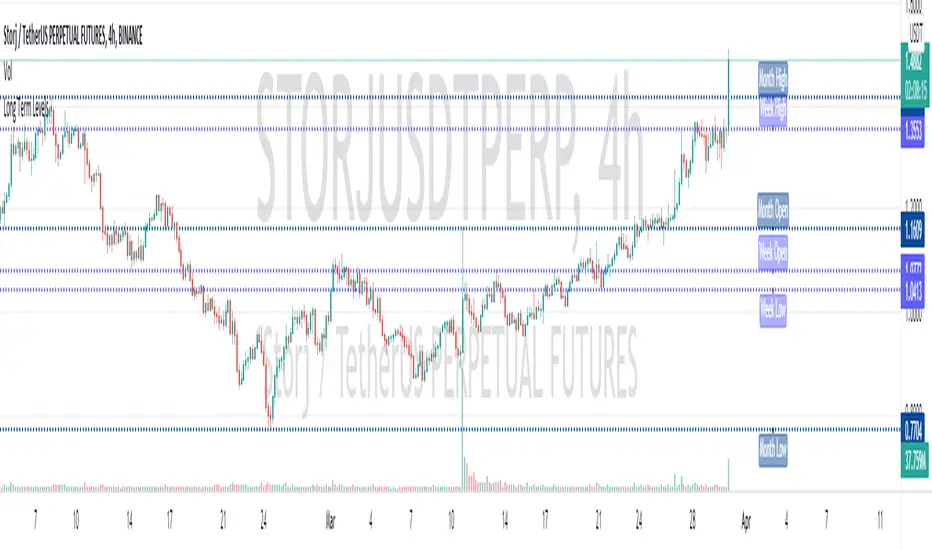
Long Term Levels (4h, D, W, M, Q, & Y)This shows and labels the highs and lows from the previous 4h, daily, weekly, monthly, quarterly and yearly session. By default it only shows weekly, monthly and yearly. It also has an option to use small labels (M vs Monthly High) to save your eyeballs. You may need to adjust your charts right hand margin to see them properly.
Everything is shown in very tasteful shades of blue. For a faster loading version of this check my other indicators.