CelineTrades LondonIntroduction
CelineTrades London is a precision-focused indicator designed to structure London session price action around liquidity, multi-timeframe context and fair value concepts. Built for traders who rely on objective market behavior, this tool highlights where liquidity is taken and where high-probability opportunities can form in real time.
By combining higher-timeframe (HTF) and intermediate-timeframe (ITF) liquidity sweeps with Inversion Fair Value Gaps (IFVGs), the indicator provides a clear framework for London session execution.
Description
The indicator automatically tracks previous highs and lows across two configurable timeframes (HTF and ITF), monitors when those levels are swept and conditions lower-timeframe execution logic on that sweep behavior.
Once aligned liquidity is taken, the script identifies IFVGs that meet strict structural, size and timing requirements. Developing IFVGs are displayed first, allowing traders to anticipate potential entries, while confirmed IFVGs are clearly marked once price validates the setup.
Built-in risk logic assists with trade planning by calculating position size based on stop distance, maximum dollar risk and risk per point. Alerts ensure you never miss critical events such as liquidity sweeps or IFVG confirmations during active market hours.
Features
Multi-timeframe liquidity levels
Automatically plots previous HTF and ITF highs and lows.
Dynamic labelling with overlap management for clean charts.
Liquidity sweep detection
Identifies when prior highs or lows are taken.
Optional sweep extensions and visual differentiation.
Alerts for HTF and ITF sweeps.
Inversion Fair Value Gaps (IFVG)
Developing IFVG visualization.
Confirmed IFVG box plotting.
Minimum FVG size and stop-loss distance filters.
Time-limited entry logic.
Risk & position sizing
Maximum dollar risk control.
Automatic contract calculation based on stop size.
Visual buy/sell labels with calculated size.
Customization
Line styles, widths, colors, label size, line offsets.
Toggle visibility for all major components.
Clean, performance optimized plotting.
Alerts
HTF liquidity sweep.
ITF liquidity sweep.
IFVG entry confirmation.
Terms & Conditions
This indicator is provided for educational and informational purposes only and does not constitute financial advice.
Trading involves risk and past performance is not indicative of future results.
The user assumes full responsibility for any trading decisions made using this indicator.
Redistribution, resale or modification of this script without permission is strictly prohibited.
London

Trading Sessions The sessions are individually selectable, meaning you can choose which sessions you want to display.
There is also a legend in the bottom left showing the corresponding trading hours.
Displayed sessions:
ASIA
LONDON
NEW YORK
#ZEBI

ASIA | LONDON | NEW YORK - Session Range [Entry Lab]This free community indicator automatically plots the highs and lows of each trading session, helping you clearly identify where liquidity is likely to be swept. Fully customisable to your personal time zone, it removes the manual work and keeps your focus on what matters most: structure, context, and timing.
Built by the EntryLab team for traders who want better entries, deeper market understanding, and a repeatable edge. Our mission is simple — make winning a common occurrence, not a rare one.
#EntryLab

Range Multi-jour Double - SessionEnglish:
Allows you to display the daily highs and lows for two specific sessions, along with the RSI shown as a numerical value at the top. This lets you see at a glance if it's overbought or oversold (turning red). It provides an OPR for both the London and NY sessions in a single indicator.
Français:
Permet d'avoir le plus haut et le plus bas de 2 sessions pour chaque journée + le RSI afficher en haut en chiffre pour voir en un coup d'oeil s'il est en surachat ou en survente, il devient rouge. Ca permet d'avoir un OPR pour la session de londre et de NY en 1 indicateur.

LBMA London Gold Fix Times [Auto DST]## Overview
This lightweight indicator automatically marks the **LBMA Gold Price Fixing** times on your chart using vertical lines. It is designed specifically for **XAUUSD (Gold)** traders who need to monitor institutional liquidity and volatility shifts during the London session.
The indicator tracks the two key daily fixing moments:
* **AM Fix:** 10:30 (London Time)
* **PM Fix:** 15:00 (London Time)
## Key Features
* **🌍 Auto Daylight Saving Time (DST):** Built with the `Europe/London` timezone parameter. It automatically adjusts to British Summer Time (BST) and GMT, so you never have to manually change the UTC offset settings.
* **⚡ Minimalist Design:** Draws clean vertical lines without cluttering your chart with text labels.
* **🎨 Fully Customizable:** You can adjust the line color, width, and style (Solid, Dashed, Dotted) for both AM and PM sessions independently.
## Why are these times important?
The London Gold Fix (LBMA Gold Price) is the global benchmark for physical gold settlement. Major institutions, central banks, and mining companies settle contracts at these times. Consequently, **10:30** and **15:00** (London time) often witness:
1. Significant spikes in volatility.
2. Trend reversals or accelerations.
3. Massive volume injection.
## Usage Tips
* **Timeframe:** This indicator works best on **Intraday Timeframes** (1-minute to 30-minute charts).
* *Note:* It may not be visible on H1 (1-hour) charts or higher because the fix times (e.g., 10:30) occur in the middle of an hourly candle.
* **Setup:** Simply add it to your chart. No timezone configuration is required; the script calculates London time internally.
## Settings
* **AM Fix Color:** Default is Blue (London Morning).
* **PM Fix Color:** Default is Red (London Afternoon/US Morning overlap).
* **Line Style:** Choose between Solid, Dashed, or Dotted lines.
概述 (Overview)
这是一个轻量级的辅助指标,通过垂直线在图表上自动标记 LBMA 伦敦金定盘价(LBMA Gold Price Fixing) 的时刻。它是专为 XAUUSD(黄金) 交易者设计的,旨在帮助大家捕捉伦敦时段内机构流动性和市场波动的关键节点。
该指标会自动锁定每天两个核心的定盘时间:
上午定盘 (AM Fix): 10:30 (伦敦时间)
下午定盘 (PM Fix): 15:00 (伦敦时间)
主要功能 (Key Features)
🌍 自动识别夏令时 (Auto DST): 代码内置 Europe/London 时区参数。无论英国处于夏令时 (BST) 还是冬令时 (GMT),指标都会自动精准对齐,无需用户手动调整时区设置。
⚡ 极简主义设计: 仅绘制干净的垂直线,不显示任何文字标签,避免遮挡K线或干扰视线。
🎨 高度可定制: 您可以独立调整上午和下午定盘线的颜色、粗细以及样式(实线、虚线或点线)。
为什么要关注这两个时间点?
LBMA 伦敦金定盘价是全球实物黄金结算的基准价格。大型金融机构、中央银行和金矿公司通常会在这个时间点集中进行合约结算。因此,在伦敦时间 10:30 和 15:00 前后,市场经常会出现:
波动率瞬间激增。
短期趋势的反转或加速。
巨量成交量的涌入。
使用建议 (Usage Tips)
适用周期: 建议在 日内分时图(1分钟、5分钟、15分钟或30分钟)上使用。
注意: 在 1小时 (H1) 或更大的周期上,线条可能无法显示,因为定盘时间(如 10:30)发生在整点K线的内部,无法被单独标记。
设置方法: 加载指标即可使用。无论您本地电脑的时间设置如何,脚本内部会自动计算正确的伦敦时间。
参数设置 (Settings)
AM Fix Color: 上午定盘线颜色(默认为蓝色)。
PM Fix Color: 下午定盘线颜色(默认为红色,此时往往也是美盘初期的波动高峰)。
Line Style: 线条样式选择(实线、虚线、点线)。

[ICT Sebo] SessionOverview
This indicator visualizes the Asia, London and New York trading sessions and tracks each session’s high, low and midpoint in real time. It highlights key session phases and monitors how price interacts with prior session liquidity levels across subsequent sessions.
The script is designed as a session structure and liquidity context tool and does not generate trade signals.
How it works
The indicator uses a daylight-saving-time-aware New York timezone to ensure accurate session alignment throughout the year. Each trading session is defined by its start and end time and is highlighted directly on the chart.
During an active session, the script continuously updates the session high, session low and midpoint. These levels are extended forward into later sessions to observe how price reacts to previous session ranges.
For each session, the first third of its duration is calculated and visually highlighted, allowing traders to focus on early-session price behavior.
Session interaction logic
The indicator monitors when price touches or trades through highs and lows from previous sessions. For example, Asia session highs and lows are tracked during the London and New York sessions, and London session highs and lows are tracked during the New York session.
Once a session level is touched, it is locked and will not trigger repeated events.
Alerts
Alerts are generated when price touches a session high or low during a subsequent session. These alerts allow traders to monitor potential liquidity interactions without watching the chart continuously.
The following alert events are supported:
Asia session high or low touched during the London session
Asia session high or low touched during the New York session
London session high or low touched during the New York session
Alerts are triggered only once per level to avoid duplicate notifications.
Visualization
Each session is color-coded and displayed with a background highlight. Session highs, lows and midpoints are drawn as horizontal levels and extended forward for reference.
The first third of each session is highlighted with a shaded box to emphasize early-session structure.
Intended use
This tool supports session-based market analysis, liquidity mapping and time-of-day context evaluation. It is suitable for intraday analysis and should be used in combination with broader market context and risk management.
Notes
This indicator does not predict price direction, does not provide entry or exit signals and is intended purely as a visual and analytical reference.

[ICT Sebo Lite] SessionOverview
This indicator visualizes the Asia, London and New York trading sessions using a DST-aware New York time reference. It dynamically tracks each session’s high, low and midpoint and highlights key interaction areas across sessions.
The script is designed as a lightweight session-structure and contextual reference tool and does not generate trade signals.
How it works
Each session is defined using configurable session times and is calculated with full daylight saving time support based on the New York timezone. When a session begins, the indicator starts tracking the session high and low in real time and continuously updates these levels until the session ends.
For each session, the following elements are plotted directly on the chart: the session high, the session low and a dynamic midpoint calculated from the current range. These levels extend forward and can remain visible into subsequent sessions to provide structural context.
Session interaction and level tracking
The indicator monitors how session highs and lows interact with later sessions. When a prior session’s high or low is traded during London or New York, the event is marked directly on the chart with a label. Each level is locked after being touched to avoid repeated signals.
This behavior helps highlight common session-based liquidity interactions, such as Asia range highs or lows being taken during London or New York.
Initial session range highlight
For each session, the indicator highlights the initial portion of the session range, corresponding to approximately the first third of the session duration. This area is displayed as a shaded box that dynamically adjusts to the evolving session high and low.
The highlighted range provides a visual reference for early-session price development and potential areas of interest as the session unfolds.
Intended use
This tool supports session-based market structure analysis, liquidity context evaluation and time-based price behavior studies. It is suitable for intraday analysis and should be used in combination with broader market context and risk management.
Notes
This indicator does not predict price direction, does not provide entry or exit signals and is intended purely as a visual and analytical aid.

Sessions + Kill Zones 🔹 Description (UA)
Індикатор для інтрадею, що автоматично показує торгові сесії (Tokyo, Frankfurt, London, New York) та Kill Zones з чітким початком і кінцем. Підтримує кастомну таймзону, гнучкі налаштування та працює лише на intraday таймфреймах.
🔹 Short Description (EN)
Intraday indicator that automatically displays major trading sessions (Tokyo, Frankfurt, London, New York) and Kill Zones with clear start and end points. Supports custom timezones, flexible settings, and works on intraday timeframes only.
Marketing Description (EN)
🔥Trade when the market really moves.
Sessions + Kill Zones is a powerful intraday tool designed to highlight the most important market hours — when liquidity enters and volatility expands.
✔ Instantly visualize Tokyo, Frankfurt, London, and New York sessions
✔ Clearly mark London & New York Kill Zones
✔ Fully customizable colors, labels, and line styles
✔ Perfect for ICT, Smart Money Concepts, scalping, and day trading
No clutter. No guesswork.
Just clean session structure and precise timing — exactly what professional traders focus on.
🔥 Marketing Description (UA)
Торгуй тоді, коли ринок справді рухається.
Sessions + Kill Zones — це інструмент для інтрадею, який показує ключові години ліквідності та волатильності.
✔ Візуалізація сесій Tokyo, Frankfurt, London, New York
✔ Чіткі межі London та New York Kill Zones
✔ Повна кастомізація кольорів, підписів і стилів
✔ Ідеально для ICT, Smart Money, скальпінгу та day trading
Жодного шуму.
Лише структура ринку та точний таймінг.

GardFx - Fusion Pro FREE TrialFusion Pro - by GardFx
This script is a specialized session-trading system designed to capitalize on the Opening Range Breakout (ORB) by utilizing Fair Value Gaps (FVG) as entry confirmation zones. Unlike standard breakout indicators that signal immediately upon a range break, this system waits for a price retest (mitigation) of specific imbalances created during the breakout move.
Core Concept
The strategy operates on a three-step logic sequence:
Define the Range: It establishes the High and Low of the opening session (London or New York).
Identify Imbalance: Upon a breakout of this range, the script scans for the creation of a Fair Value Gap (FVG) on the 1-minute timeframe.
Confirm Entry: It waits for price to retrace into the FVG (mitigation) and looks for specific candle confirmation patterns before generating a signal.
Detailed Methodology
1. The Opening Range (ORB)
The script monitors the first 15 minutes of the session (configurable).
High Line: The highest price reached during the first 15m.
Low Line: The lowest price reached during the first 15m.
Breakout: A breakout is validated when a candle closes outside of this defined range.
2. Fair Value Gap (FVG) Detection
Shutterstock
Not all breakouts are valid. This script filters for momentum by requiring an FVG to form immediately following the breakout.
Bullish FVG: Defined when the Low of Candle 1 is higher than the High of Candle 3.
Bearish FVG: Defined when the High of Candle 1 is lower than the Low of Candle 3.
Note: If an FVG is not formed shortly after the breakout, the setup is considered low-probability and ignored.
3. Entry Confirmation Models Once an FVG is identified and price returns to mitigate it, the script offers three confirmation modes:
Instant (First Touch): Aggressive entry immediately when price touches the FVG box.
Reversal Close: Waits for a candle to close in the direction of the trend after touching the FVG (e.g., a green candle close after dipping into a bullish FVG).
Engulfing Candle: The most conservative filter. Requires a full engulfing candle pattern occurring within or bouncing off the FVG.
4. Advanced Filters To reduce false signals during choppy markets, two optional filters are included:
Volume Filter: Requires the breakout candle's volume to be higher than its Moving Average (multiplied by a user-defined factor).
Higher Timeframe (HTF) Trend: Checks the trend on a higher timeframe (e.g., 1H or 4H).
Logic: If the HTF Close is > HTF EMA 50, only Buy signals are permitted. If HTF Close < HTF EMA 50, only Sell signals are permitted.
5. Risk Management The script includes an automated Risk/Reward calculator.
Stop Loss (SL): Placed at the invalidation point of the FVG structure, plus an optional ATR buffer to account for volatility.
Take Profit (TP): Calculated based on a user-defined Risk:Reward ratio (e.g., 1:2) relative to the Stop Loss distance.
Dashboard A multi-timeframe dashboard is displayed to provide a "Glance View" of market bias across the Daily, 4H, 1H, and 15M timeframes, ensuring trades are aligned with macro momentum.
3 hours ago
Release Notes
🚀 GardFx - Fusion Pro V2: The Ultimate ORB & ICT Suite
Welcome to Version 2.0 of Fusion Pro. This update transforms the indicator from a simple breakout tool into a complete institutional trading system. We have integrated Multi-Timeframe (MTF) logic, Candlestick Pattern recognition, and Smart Exit management to filter out noise and catch high-probability moves.
🔥 NEW FEATURES IN V2:
1. 🧠 Smart MTF Bias & Voting System
No more guessing the trend. The script now checks Daily, 4H, 1H, and 15m timeframes.
Voting Logic: A trade is only signaled if the higher timeframes agree (e.g., 2 out of 3 votes).
Visuals: The dashboard displays the live bias for every timeframe.
2. 🎯 Advanced Entry Confirmations We have added specific trigger patterns to reduce fake-outs. You can now choose your entry style:
🦄 Unicorn Setup: ORB Level + FVG overlap.
🕯️ Candlestick Patterns: Pinbar, Engulfing, Tweezer Tops/Bottoms, and Inside Bar.
📉 FVG 50%: Wait for price to retrace to the 50% equilibrium of the gap before entering.
3. 🛡️ Entry Validation Modes Control exactly when the entry label fires:
Instant: Enters immediately upon touch.
Candle Close: Waits for the candle to close in your direction.
Break of High/Low: Places a pending order at the wick; only enters if momentum breaks that level.
Wait for MSS: Waits for a Market Structure Shift (local high/low break).
4. 💰 Dynamic Smart Exit (Secure TP)
A new Volume-Based Exit Manager detects sudden momentum shifts or volume spikes against your position.
It prints a "Secure TP" label to help you bank profits before a reversal occurs, even if the fixed TP hasn't been hit.
5. 📊 Enhanced Dashboard & Stats
Tracks Win/Loss rates separately for Asia, London, and New York sessions.
Weekly and Daily stats reset automatically.
Fully customizable size and position.
6. ⚡ Automated UK Sessions
Built-in timings for Asia, London, and New York based on UTC (London) time. No more timezone conversion headaches.

SMC Sessions NYThis script plots vertical session markers on the chart to highlight session opens and closes based on New York time.
Key characteristics:
The indicator is plotted on the price chart (overlay).
It draws thin, dotted vertical lines at specific session times.
Sessions are calculated using the America/New_York timezone to ensure correct alignment.
Only weekdays (Monday to Friday) are considered.
The script draws sessions for today and up to one week back (maximum 7 calendar days).
All drawings are created once on the last bar to avoid duplicates and performance issues.
Each session has its own color for clear visual distinction:
Asia session (open)
London session (open and close)
New York / Kill Zone Morning (open and close)
Lunch session (open and close)
New York / Kill Zone Afternoon (open and close)
The Asia session open at 20:00 NY is intentionally excluded on Fridays, as there is no valid Asia session start on Friday evening.
The vertical lines extend across the entire visible price range of the chart.
The script is optimized to stay well within TradingView object limits.
Purpose:
The indicator is designed to give traders a clean, non-intrusive visual reference for key session transitions, helping to analyze price behavior around session opens and closes without cluttering the chart.
This approach is suitable for intraday and session-based trading models, including SMC-style workflows.

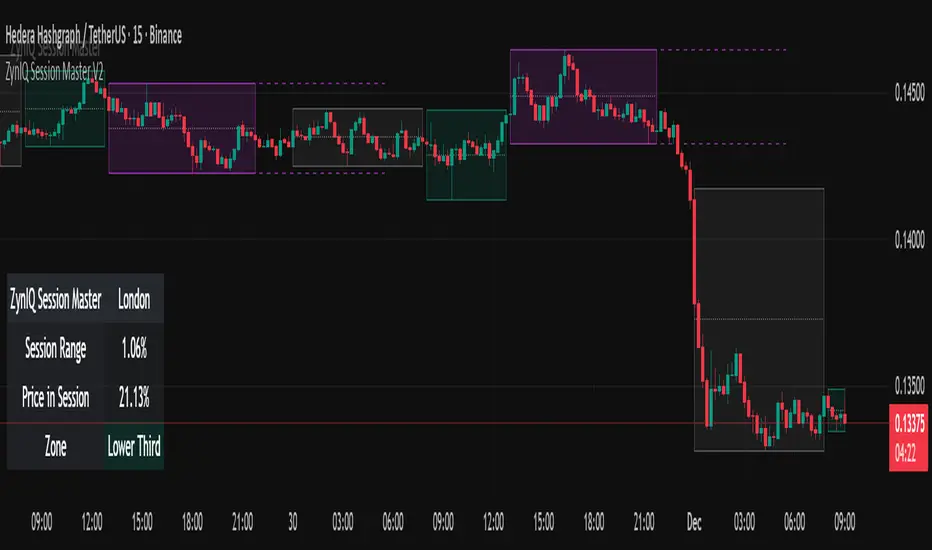
ZynIQ Session Master v2 - (Lite Pack)Overview
ZynIQ Session Master v2 (Lite) highlights key market sessions and their associated ranges, helping traders understand when volatility tends to shift between Asian, London and New York sessions. It provides clean visual context for intraday trading without overwhelming the chart.
Key Features
• Automatic detection and shading of major trading sessions
• Configurable session highlighting
• Optional range markers for Asia, London and New York
• Lightweight visuals suitable for fast intraday charting
• Simple session-based structure for context around volatility shifts
• Optional labels marking session transitions
Use Cases
• Seeing where session volatility typically increases
• Identifying when price is leaving a session range
• Timing trades around session opens
• Combining session structure with breakout, trend or momentum tools
Notes
This script provides session structure and volatility context. It is not a standalone trading system. Use alongside your preferred confirmation and risk management.
ORBs, EMAs, AVWAPThis Pine Script (version 6) is a multi-session trading indicator that combines Opening Range Breakouts (ORBs), Exponential Moving Averages (EMAs), and an Anchored VWAP (AVWAP) system — all in one overlay script for TradingView.
Here’s a clear breakdown of its structure and functionality:
🕒 1. Session Logic and ORB Calculation
Purpose: Identify and plot the high and low of the first 30 minutes (default) for the Tokyo, London, and New York trading sessions.
Session Anchors (NY time):
Tokyo → 20:00
London → 03:00
New York → 09:30
(All configurable in inputs.)
ORB Duration: Default is 30 minutes (orbDurationMin), also user-configurable.
Resets:
London and NY ORBs reset at the start of each new New York trading day (17:00 NY time).
Tokyo ORB resets independently using a stored timestamp.
Process:
For each session:
While the time is within the ORB window, the script captures the session’s high and low.
Once the window closes, those levels remain plotted until reset.
Plot Colors:
Tokyo → Yellow (#fecc02)
London → Gray (#8c9a9c)
New York → Magenta (#ff00c8)
These form visible horizontal lines marking the prior session ranges — useful for breakout or retest trading setups.
📈 2. EMA System
Purpose: Provide trend and dynamic support/resistance guidance.
It calculates and plots four EMAs:
EMA Period Color Purpose
EMA 9 Short-term Green Fast signal
EMA 20 Short-term Red Confirms direction
EMA 113 Medium Aqua Trend filter
EMA 200 Long-term Orange Macro trend baseline
Each EMA is plotted directly on the price chart for visual confluence with ORB and VWAP levels.
⚖️ 3. Anchored VWAP (AVWAP)
Purpose: Display a volume-weighted average price anchored to specific timeframes or events, optionally with dynamic deviation or percentage bands.
Features:
Anchor Options:
Time-based: Session, Week, Month, Quarter, Year, Decade, Century
Event-based: Earnings, Dividends, Splits
VWAP resets when the chosen anchor condition is met (e.g., new month, new earnings event, etc.).
Bands:
Up to three levels of symmetric upper/lower bands.
Choose between Standard Deviation or Percentage-based widths.
Display Toggles:
Each band’s visibility is optional.
VWAP can be hidden on 1D+ timeframes (hideonDWM option).
Color Scheme:
VWAP: Fuchsia (magenta-pink) line
Bands: Green / Olive / Teal with light-filled zones
⚙️ 4. Technical Highlights
Uses ta.vwap() with built-in band calculations.
Handles instruments with or without volume (errors if missing volume).
Uses time-zone aware timestamps (timestamp(NY_TZ, …)).
Uses timeframe.change() to detect new anchors for the VWAP.
Employs persistent variables (var) to maintain session state across bars.
💡 In Practice
This indicator is designed for multi-session intraday traders who:
Trade Tokyo, London, or NY open breakouts or retests.
Use EMA stacking and crossovers for trend confirmation.
Use Anchored VWAP as a fair-value or mean-reversion reference.
Need clear visual structure across different market sessions.
It provides strong session separation, trend context, and volume-weighted price reference — making it ideal for discretionary or semi-systematic trading strategies focused on liquidity zones and session momentum.

Sessions Highs/LowsThis indicator plots the High and Low of the three main trading sessions:
Asia (20:00–03:00) – green lines
London (03:00–08:00) – blue lines
New York (08:00–13:00) – red lines
Features:
Levels update in real time during each session.
When a new session starts, the previous lines are deleted – only the latest active sessions remain visible.
Default session times are set to Asia (20:00–03:00), London (03:00–08:00), and New York (08:00–13:00), but you can adjust them to your own custom hours in the settings.
Colors can also be customized.
Use cases:
Quickly visualize session ranges.
Track session highs/lows for breakouts, fakeouts, and reactions around liquidity zones.

STOCK EXCHANGE + SILVER BULLET FRAMESThis script is an updated version of the " NY/LDN/TOK Stock Exchange Opening Hours " script.
Objective
Displays global stock exchange sessions (New York, London, Tokyo) with session frames, highs/lows, and opening lines. Includes ICT Silver Bullet windows (NY, London, Tokyo) with configurable shading. Past sessions are frozen at close, ongoing sessions update dynamically until closure, and upcoming sessions are pre-drawn. Fully customizable with options for weekends, labels, padding, opacity, and individual session toggles.
It is designed to help traders quickly interpret market context, liquidity zones, and session-based price behavior.
Main Features
Past sessions (historical data)
• Session Frames:
• Each box is frozen at the session’s close.
• The left edge aligns with the opening time, while the right edge is fixed at the closing time.
• The top and bottom reflect the highest and lowest prices during the session.
• Session Labels:
• Names (NY, LDN, TOK) displayed above the frame, aligned left, in the same color as the frame.
• Opening Lines:
• Vertical dotted lines mark the start of each session.
Ongoing and upcoming sessions (live market)
• Dynamic Session Frames:
• The right edge is locked at the future close time.
• The top and bottom update in real time as new highs and lows form.
• Labels and Lines:
• The session label is visible above the active frame.
• Opening lines are drawn as soon as the session begins.
Silver Bullet Time Windows (ICT concept)
• Highlights key liquidity windows within sessions:
• New York: 10:00–11:00 and 14:00–15:00
• London: 08:00–09:00
• Tokyo: 09:00–10:00
• Silver Bullet zones are shaded with configurable opacity (default 5%).
Customization and Options
• Enable or disable individual sessions (NY, London, Tokyo).
• Toggle weekend display (frames and Silver Bullets).
• Adjust label size, padding, and text visibility.
• Control frame opacity (default 0%).
• Optimized memory management with automatic pruning of old graphical objects.

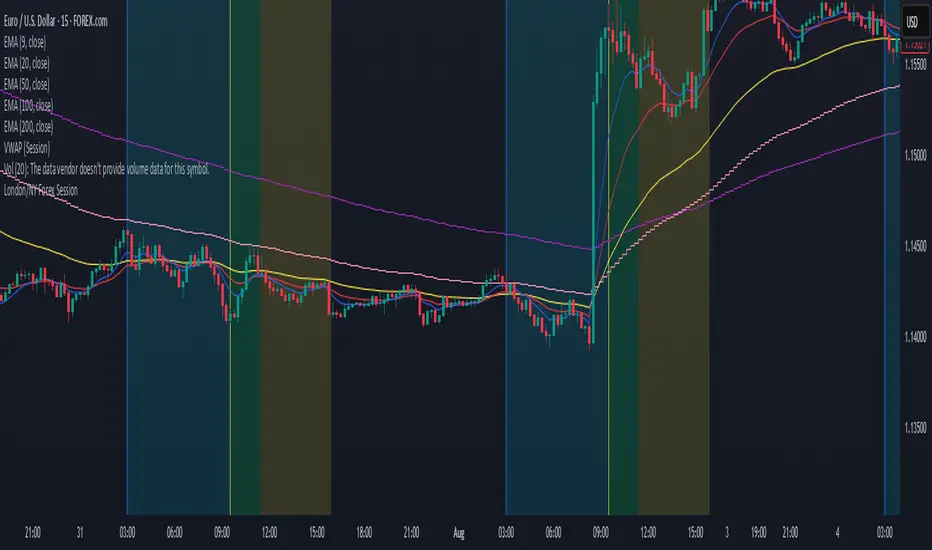
London/NY Forex SessionDesigned for Forex traders who want a clear view of market dynamics.
This tool highlights the most active trading windows of the day, helping you align with institutional moves and avoid low-liquidity periods.
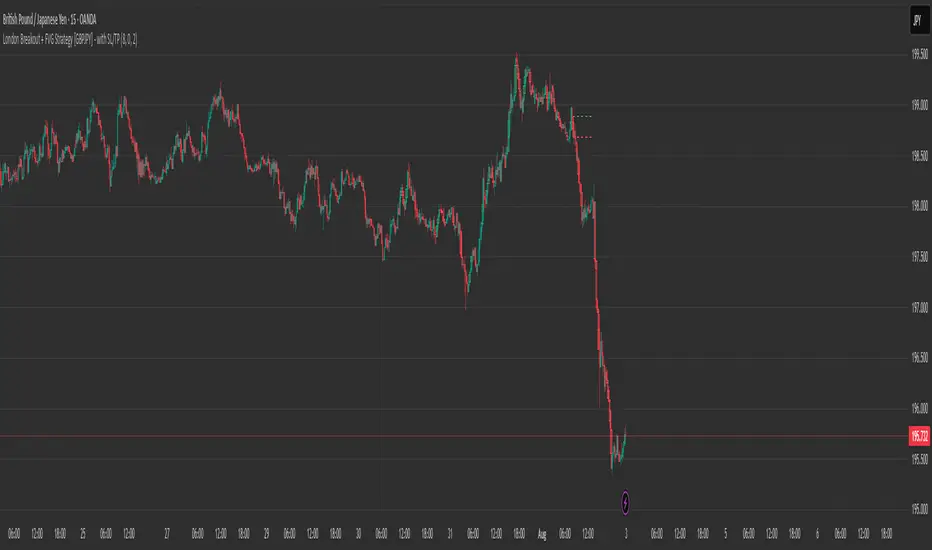
London Breakout + FVG Strategy [GBPJPY] - with SL/TPMarks the London open high and low on 15 min time frame, ads fvg on 5 min for orders
Obsession.FX Sessions IndicatorSession & Fractal Structure Tool — for Market Phases and Microstructure Analysis
This script combines session timeframes with local fractal identification to help traders analyze market context and structural shifts. It is designed for those applying Smart Money Concepts, where precise session boundaries and reactions to key levels are critical.
Session Zones
The script visualizes the three main trading sessions: Asia, London, and New York. It helps to:
– identify active phases of market participation;
– track each session’s Highs and Lows;
– interpret price behavior in relation to intraday liquidity shifts.
Each session is fully customizable — including start/end time, background and border colors, and display style (box, high/low lines, filled zones).
Fractal Structure
Fractals are shown as local highs and lows, supporting:
– detection of BOS/CHOCH on lower timeframes;
– building A→B ranges for structural flow;
– confirming short-term directional changes.
The fractal algorithm is optimized for responsiveness and clarity, with no repainting and minimal delay.
Purpose and Usage
This tool is intended for contextual reading of price action: determining the active session and monitoring price behavior within its boundaries, with a focus on microstructural reactions. It supports building precise entry logic based on the interaction between session ranges and fractal structure.
Closed Source Justification
The script is closed-source due to its use of proprietary logic for fractal detection and session integration, developed as part of a private trading methodology not available in public libraries.

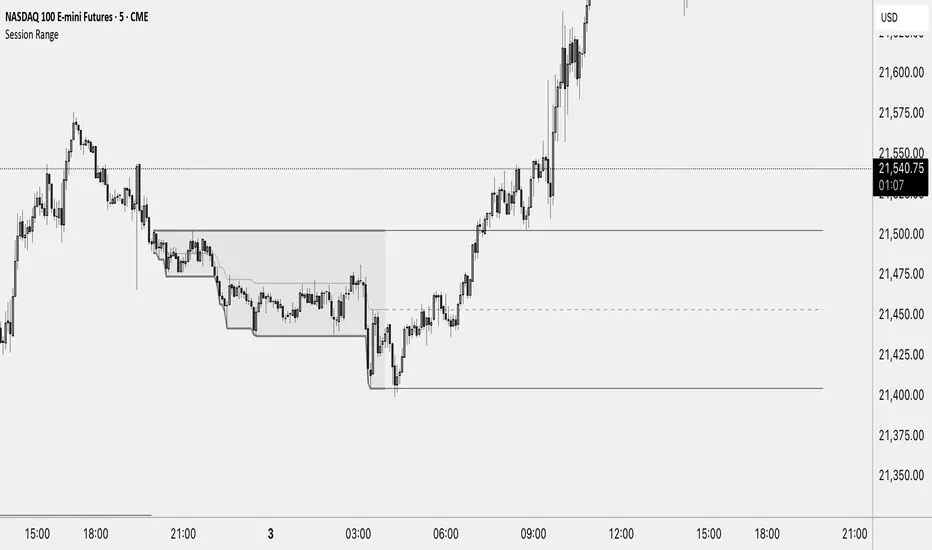
Session RangeThis Indicator Shows you the high, low and the midpoint for a chosen session and displays them on the chart.
You can make the following inputs:
Timezone: Choose your time zone (in UTC) to display the session correctly
Session Time: Choose the start time and end time of the session you want to have displayed.
Show Session Midpoint: Choose between displaying or not displaying the midpoint of the sessions high and low.
Extend Session Values until next Session: Choose this option if you want to display the sessions range until the next session starts. The midpoint will only be displayed if you chose "yes" at "Show Session Midpoint?"
Maximum number of bars between sessions: This is needed to ensure the correct display of the extended lines. Also this will affect the running speed of the script.
Limitations:
A higher number between bars slows down the script. What does that mean practically? If you choose to not have the sessions values displayed until the next session you can set this to 1 and the script will run as fast as it can. If you choose to display all the values until the next session you have to make sure that the number you put in is higher than the number of bars between the sessions. Otherwise the lines will be displayed backwards. As this affects the calculation speed you want to keep the number as low as possible. The default setting is 300 which is fine for 5 minute charts. On a 1 minute chart you will have to use something around 5000 depending on how long your session is.
Also the script will only run correctly if the start time of your session can be divided by the timeframe you are using. Example: you can use a 1min, 3min, 5min, or 15min chart on all sessions as they can only start every 15 minutes and 15 can be divided by all these numbers. A 2 minute timeframe will only work on sessions that start at minute 00 or 30, as 15 and 45 can not be divided by 2.
Customization and Alerts:
You can change the color of the sessions high, low, midpoint and background filling. The line style can also be changed but this might lead to a faulty display of the session.
The style of the extension lines can not be altered.
Alerts can be added for crossing the sessions high or low (after the session is finished). You do not have to display the extension lines in order to set an alert.
credit: The inspiration (especially for the look of this indicator) comes from the Asian Range by Nico948 indicator.
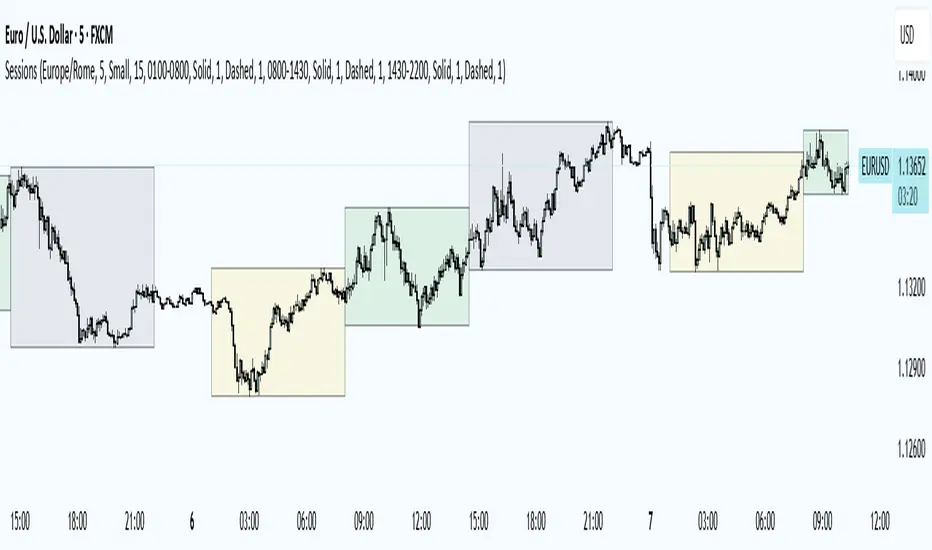
Trading Sessions
Trading Sessions
Highlights the Asia, London, and New York trading sessions with dynamic High-Low boxes.
General
Timezone : select your reference zone (e.g. Exchange, UTC, Europe/Rome, America/New_York).
Extend Session High/Low : extend the High/Low lines to the last candle.
Extend Lines (bars) : number of bars to extend lines beyond the last candle (0–100, default 15).
Show High/Low Labels : display labels for the High/Low levels.
Show Mitigated Levels : also show mitigated (broken) levels.
Show Only Recent Levels : filter levels from the last N days.
Number of Recent Days : sets how many days are considered “recent” (1–30).
Show Debug Info : enable a panel with current time, session status, and active filters.
Sessions
Asia , London , New York : enable or disable each session.
Session Time : set the start/end times with the time picker.
Box Color : choose a semi-transparent highlight color for each session.
Line Style & Width : customize style (Solid, Dotted, Dashed) and width of current and past High/Low lines.
Text Size : select the label text size (Tiny, Small, Normal, Large).
Show Only Recent Levels – filters High/Low lines to show only those from the last Number of Recent Days .
Number of Recent Days – sets how many days are considered “recent” for the filter.
Show Mitigated Levels – enables display of broken levels; otherwise only active levels remain visible.
Show High/Low Labels – toggles text labels at the ends of lines on or off.
Show Debug Info – displays a floating panel showing:
Current time in the selected timezone
On/Off status of Asia, London, NY sessions
Active filters (recent days, mitigated levels)
Line style settings for each session
Key Benefits
Visualize session-specific volatility and potential breakouts.
No historical limit: scroll back through any past sessions.
Filter and extend High/Low levels for precise price context.
Fully customize to fit any chart layout.
Ideal For
Intraday traders who need clear session boundaries and price level context.
London Judas Swing Indicator by PoorTomTradingThis indicator is designed to help people identify and trade the London Judas Swing by Inner Circle Trader (ICT).
UPDATES IN V2:
This is a v2 update with automatic timezone settings, there is no longer any need to adjust the time or offset for DST.
It will now also work on any chart that trades during the Asia and London sessions (20:00 - 05:00 NY Time), including crypto.
It is recommended to use this indicator on the 5 minute timeframe.
INTRODUCTION OF KEY CONCEPTS:
Swing Points are a candle patterns defining highs and lows, these are explained further down in the description in more detail. They are shown on the indicator by arrows above and below candles. They can be removed if you wish by turning their opacity to 0% in settings. Swing points are automatically removed when price trades beyond them (above swing highs, below swing lows).
The Asia Session can be set by the user, but is defined by default as 20:00 - 00:00 NY time. Lines are drawn at the high and low of the Asia Session and the Asian Range is set at midnight.
The London Session is defined as 02:00 - 05:00 NY time.
The user can also include the pre-London session (00:00 - 02:00) for detection of breakouts and Market Structure Breaks (MSBs - explained lower down in the description with examples). This is selected by default.
EXPLANATION OF INDICATOR:
During the London Session, the indicator will wait for a break of either the high or low of the Asian Range.
When this is detected, it will draw a dashed line where the breakout occurred and trigger an alert.
After the break of the Asian Range, the indicator will look for an MSB in the opposite direction, which is when price closes beyond a swing point opposing current price direction. The indicator will draw a line indicating the MSB point and trigger an alert.
Finally, the indicator will also trigger an alert when price returns to this MSB level, which is the most simple Judas Swing entry method.
The Judas swing
Example with chart for Judas Swing short setups -
Price breaks above the Asia High, no candle close is required, the indicator will then wait for price to close a candle below the last swing low.
A swing low is defined as a 3 candle pattern, with two candles on either side of the middle one having higher lows. When a candle closes below the middle candle's low, that is an MSB.
When price returns to the MSB point, the Take Profit and Stop Loss levels will appear.
When price goes to either the Stop Loss or Take Profit level, the MSB, TP and SL, lines will be removed.
After this, if price creates a new setup in the opposite direction, the indicator will also work for this, as shown in this example that occurred right after the first example
SETTINGS:
- The "Swing Point strength" can be adjusted in the settings.
Example:
For a swing low:
The default setting is 1 (one candle on each side of a middle candle has a higher low).
You can change this setting to 2, for a 5 candle pattern (two candles on each side of the middle candle have higher lows).
This can be changed to a maximum of 10. But only 1 or 2 is recommended especially on the 5 minute chart.
- ATR Length and Triangle Distance Multiplier settings are for adjusting how the swing point symbols appear on the chart.
This is to ensure triangles are not drawn over candles when price gets volatile.
The default setting is ideal for almost all market conditions, but you can play around with it to adjust to your liking.
- Alerts.
For alerts to be triggered, they must first be selected in settings.
Then you need to go on to the chart and right-click on an element of the indicator (such as the swing point symbols) and select "add alert on PTT-LJS-v2".
If after this, you change any settings on the indicator such as session times or pre-London session, you must add the alert again, and delete the old one if you wish.

London ORB + Session High/Low + FVGLondon ORB + Session High/Low + FVG
📘 Script Description: London ORB + Session High/Low + Fair Value Gap
This script is designed to assist intraday traders during the London session open by combining:
🕒 1. Opening Range Breakout (ORB)
Captures the high and low of the first 15-minute candle after the London open (08:00–08:15 GMT).
Draws lines and labels for the ORB High and Low levels.
Detects breakouts above or below the ORB and plots a triangle signal at the breakout bar.
🌐 2. Asian & US Session Levels
Automatically marks the highs and lows of the Asian (00:00–06:00 GMT) and US (13:30–20:00 GMT) sessions.
Useful for identifying prior session liquidity zones, key support/resistance levels, and potential reaction areas.
📉 3. Fair Value Gaps (FVG)
Highlights imbalances in price action between non-overlapping candles (also known as FVGs or inefficiencies).
Draws a shaded box between candles where gaps exist:
Green for bullish FVGs
Red for bearish FVGs
🔔 4. Alert Support
Optional alerts are built in for:
Long breakout (price breaks above ORB)
Short breakout (price breaks below ORB)
🎯 Use Case
Perfect for:
Day traders looking to capitalize on early volatility at the London open
Traders using liquidity-based strategies, retests, or gap-fills
Visualizing and aligning with prior session highs/lows for structure and context

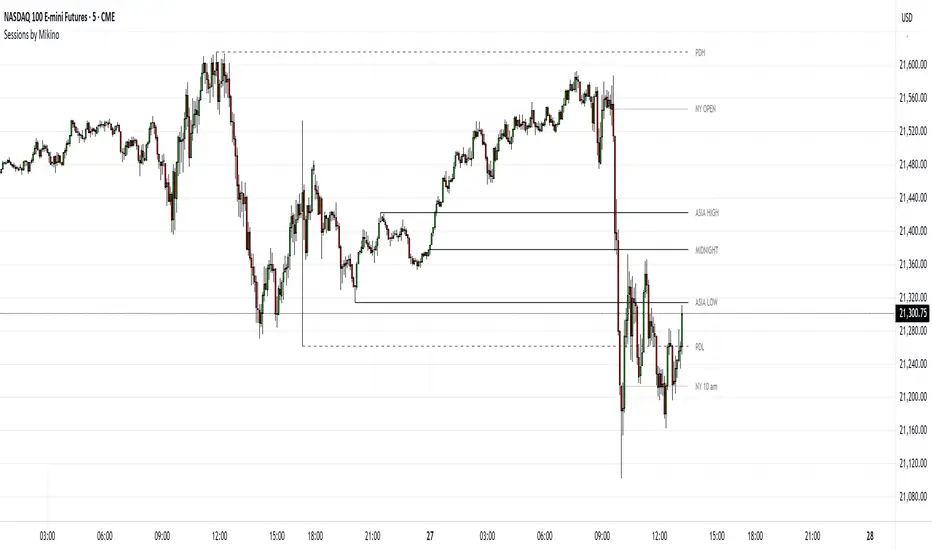
Sessions by MikinoAn indicator that draws lines from major price levels, made especially for NQ, ES and YM futures.
Features
• Show and hide any lines you want and don't need individually
• Customize how far the lines and labels are drawn (in bar length)
• Change label text, color, width and line type of any line drawn
Price levels (in NY time)
• "Show session open" - price at the beginning of the session at 6:00 PM
• "Show Asia open" - price at 8:00 PM
• "Show Asia high" - highest price during Asia session from 8 PM - midnight
• "Show Asia low" - lowest price during Asia session from 8 PM - midnight
• "Show London open" - price at 3:00/4:00 AM (depending on daylight savings time), at the start of London session
• "Show London high" - highest price during London session from 3:00/4:00 AM - 5:00/6:00 AM
• "Show Asia low" - lowest price during London session from 3:00/4:00 AM - 5:00/6:00 AM
• "Show midnight open" - price at midnight
• "Show New York open" - price at 9:30 AM
• "Show New York 10 am" - price at 10:00 AM (10 AM reversal)
• "Show previous day high" - highest price during yesterdays session (from 6:00 PM until 6:00 PM)
• "Show previous day low" - lowest price during yesterdays session (from 6:00 PM until 6:00 PM)
Limitations
All of the lines/labels will be drawn on the chart on up to hourly chart, with the exemption of PDH/PDL that can be drawn on up to 4 hour chart. PDH/PDL tracks each trading day from from 6:00 PM until 6:00 PM, Asia range from 8:00 PM until midnight, London from 3:00 AM until 05:00 AM. The indicator will work on different indices other than NQ, ES and YM, but some of the features might not work correctly due to what is considered a trading day.
Sessions Full Markets [TradingFinder] Forex Stocks Index 7 Time🔵 Introduction
In global financial markets, particularly in FOREX and stocks, precise timing of trading sessions plays a crucial role in the success of traders. Each trading session—Asian, European, and American—has its own unique characteristics in terms of volatility and trading volume.
The Asian session (Tokyo), Sydney session, Shanghai session, European session (London and Frankfurt), and American session (New York AM and New York PM) are examples of these trading sessions, each of which opens and closes at specific times.
This session indicator also includes a Time Convertor, enabling users to view FOREX market hours based on GMT, UTC, EST, and local time. Another valuable feature of this indicator is the automatic detection of Daylight Saving Time (DST), which automatically applies time changes for the New York, London, and Sydney sessions.
🔵 How to Use
The indicator also displays session times based on the exact opening and closing times for each geographic region. Users can utilize this indicator to view trading hours either locally or in UTC time, and if needed, set their own custom trading times.
Additionally, the session information table includes the start and end times of each session and whether they are open or closed. This functionality helps traders make better trading decisions by using accurate and precise time data.
Key Features of the Session Indicator
The session indicator is a versatile and advanced tool that provides several unique features for traders.
Some of these features are :
• Automatic Daylight Saving Time (DST) Detection : This indicator dynamically detects Daylight Saving Time (DST) changes for various trading sessions, including New York, London, and Sydney, without requiring manual adjustments. This feature allows traders to manage their trades without worrying about time changes.
Below are the start and end dates for DST in the New York, London, and Sydney trading sessions :
1. New York :
Start of DST: Second Sunday of March, at 2:00 AM.
End of DST: First Sunday of November, at 2:00 AM
2. London :
Start of DST: Last Sunday of March, at 1:00 AM.
End of DST: Last Sunday of October, at 2:00 AM.
3. Sydney :
Start of DST: First Sunday of October, at 2:00 AM.
End of DST: First Sunday of April, at 3:00 AM.
• Session Display Based on Different Time Zones : The session indicator allows users to view trading times based on different time zones, such as UTC, the local time of each market, or the user’s local time. This feature is especially useful for traders operating in diverse geographic regions.
• Custom Trading Time Setup : Another notable feature of this indicator is the ability to set custom trading times. Traders can adjust their own trading times according to their personal strategies and benefit from this flexibility.
• Session Information Table : The session indicator provides a complete information table that includes the exact start and end times of each trading session and whether they are open or closed. This table helps users simultaneously and accurately monitor the status of all trading sessions and make better trading decisions.
🟣 Session Trading Hours Based on Market Mode and Time Zones
The session indicator provides precise information on the start and end times of trading sessions.
These times are adjusted based on different market modes (FOREX, stocks, and TFlab suggestions) and time zones (UTC and local time) :
🟣 (FOREX Session Time) Forex Market Mode
• Sessions in UTC (DST inactive) :
Sydney: 22:00 - 06:00
Tokyo: 23:00 - 07:00
Shanghai: 01:00 - 09:00
Asia: 22:00 - 07:00
Europe: 07:00 - 16:00
London: 08:00 - 16:00
New York: 13:00 - 21:00
• Sessions in UTC (DST active) :
Sydney: 21:00 - 05:00
Tokyo: 23:00 - 07:00
Shanghai: 01:00 - 09:00
Asia: 21:00 - 07:00
Europe: 06:00 - 15:00
London: 07:00 - 15:00
New York: 12:00 - 20:00
• Sessions in Local Time :
Sydney: 08:00 - 16:00
Tokyo: 08:00 - 16:00
Shanghai: 09:00 - 17:00
Asia: 22:00 - 07:00
Europe: 07:00 - 16:00
London: 08:00 - 16:00
New York: 08:00 - 16:00
🟣 Stock Market Trading Hours (Stock Market Mode)
• Sessions in UTC (DST inactive) :
Sydney: 00:00 - 06:00
Asia: 00:00 - 06:00
Europe: 07:00 - 16:30
London: 08:00 - 16:30
New York: 14:30 - 21:00
Tokyo: 00:00 - 06:00
Shanghai: 01:30 - 07:00
• Sessions in UTC (DST active) :
Sydney: 23:00 - 05:00
Asia: 23:00 - 06:00
Europe: 06:00 - 15:30
London: 07:00 - 15:30
New York: 13:30 - 20:00
Tokyo: 00:00 - 06:00
Shanghai: 01:30 - 07:00
• Sessions in Local Time:
Sydney: 10:00 - 16:00
Tokyo: 09:00 - 15:00
Shanghai: 09:30 - 15:00
Asia: 00:00 - 06:00
Europe: 07:00 - 16:30
London: 08:00 - 16:30
New York: 09:30 - 16:00
🟣 TFlab Suggestion Mode
• Sessions in UTC (DST inactive) :
Sydney: 23:00 - 05:00
Tokyo: 00:00 - 06:00
Shanghai: 01:00 - 09:00
Asia: 23:00 - 06:00
Europe: 07:00 - 16:00
London: 08:00 - 16:00
New York: 13:00 - 21:00
• Sessions in UTC (DST active) :
Sydney: 22:00 - 04:00
Tokyo: 00:00 - 06:00
Shanghai: 01:00 - 09:00
Asia: 22:00 - 06:00
Europe: 06:00 - 15:00
London: 07:00 - 15:00
New York: 12:00 - 20:00
• Sessions in Local Time :
Sydney: 09:00 - 16:00
Tokyo: 09:00 - 15:00
Shanghai: 09:00 - 17:00
Asia: 23:00 - 06:00
Europe: 07:00 - 16:00
London: 08:00 - 16:00
New York: 08:00 - 16:00
🔵 Setting
Using the session indicator is straightforward and practical. Users can add this indicator to their trading chart and take advantage of its features.
The usage steps are as follows :
Selecting Market Mode : The user can choose one of the three main modes.
Forex Market Mode: Displays the forex market trading hours.
oStock Market Mode: Displays the trading hours of stock exchanges.
Custom Mode: Allows the user to set trading hours based on their needs.
TFlab Suggestion Mode: Displays the higher volume hours of the forex market in Asia.
Setting the Time Zone : The indicator allows displaying sessions based on various time zones. The user can select one of the following options:
UTC (Coordinated Universal Time)
Local Time of the Session
User’s Local Time
Displaying Comprehensive Session Information : The session information table includes the opening and closing times of each session and whether they are open or closed. This table helps users monitor all sessions at a glance and precisely set the best time for entering and exiting trades.
🔵Conclusion
The session indicator is a highly efficient and essential tool for active traders in the FOREX and stock markets. With its unique features, such as automatic DST detection and the ability to display sessions based on different time zones, the session indicator helps traders to precisely and efficiently adjust their trading activities.
This indicator not only shows users the exact opening and closing times of sessions, but by providing a session status table, it helps traders identify the best times to enter and exit trades. Moreover, the ability to set custom trading times allows traders to easily personalize their trading schedules according to their strategies.
In conclusion, using the session indicator ensures that traders are continuously and accurately informed of time changes and the opening and closing hours of markets, eliminating the need for manual updates to align with DST changes. These features enable traders to optimize their trading strategies with greater confidence and up-to-date information, allowing them to capitalize on opportunities in the market.
