TrendSphere (Zeiierman)█ Overview
TrendSphere is designed to capture and visualize market trends and volatility effectively. It combines various volatility measures and trend analysis techniques, producing dynamic bands and a central trend line on the price chart. Its essence is to offer a real-time, reliable estimate of the underlying linear trend in the price.
█ How It Works
Real-Time Trend Estimation
At its core, TrendSphere is designed to offer instantaneous and accurate insights into the inherent linear trend of asset prices. By continually updating its estimations, it ensures traders are equipped with the most current data. This allows the construction of support and resistance bands around the estimated trend, providing trading opportunities.
Dynamic Bands and Trend Line
TrendSphere plots a central trend line and dynamic bands around it on the price chart. Influenced by volatility, the distance between these elements offers a clear view of market conditions and the strength or weakness of trends. These bands not only depict potential turning points but also offer traders valuable opportunities to trade within the confines of the overarching trend.
Volatility Measures
Traders can select their preferred volatility measure and adjust settings to best fit their analysis needs. The bands and trend line dynamically respond to these selections, offering a tailored view of market conditions.
ATR (Average True Range): Reflects market volatility by evaluating the range between high and low prices.
Historical Volatility: Computes price variability using the standard deviation of log returns.
Bollinger Band Width: Measures the distance between Bollinger Bands, providing another angle on market volatility.
Eliminating Common Complications
One of the standout features of TrendSphere is its ability to determine linear price trends without falling prey to challenges like backpainting or repainting. In layman's terms, this means traders get a more trustworthy and unaltered view of price movements, leading to enhanced decision-making in line with the genuine trajectory of price trends.
█ How to Use
Trend Analysis
Observe the central trend line; its direction indicates the prevailing trend. When the price is above the trend line, it suggests an upward trend, and when it's below, it indicates a downward trend.
Volatility Analysis
Wider bands imply higher market volatility, suggesting larger price swings, while narrower bands indicate lower volatility. Traders can use the bands to identify potential reversal points and overbought/oversold conditions.
Potential Trading Signals (Using Bollinger bandwidth as volatility measure)
Consider buying when the price is above the trend line with narrowing bands, suggesting a strong upward trend.
Consider selling when the price is below the trend line with narrowing bands, indicating a strong downward trend.
█ Settings
Select Volatility Measure
Choose the desired volatility measure: ATR, Historical Volatility, or Bollinger Band Width.
Volatility Scaling Factor
Adjusts the scale of the volatility measure, influencing the width of the bands.
Volatility Strength
Modifies the influence of volatility on the bands, adjusting their responsiveness to volatility changes.
Length
Defines the number of periods used in calculating the selected volatility measure, impacting the stability and responsiveness of the bands.
Trend Sensitivity
Adjusts the sensitivity of the trend component, affecting how quickly it reacts to price changes.
█ Related scripts with the same calculation philosophy
TrendCylinder
Predictive Trend and Structure
-----------------
Disclaimer
The information contained in my Scripts/Indicators/Ideas/Algos/Systems does not constitute financial advice or a solicitation to buy or sell any securities of any type. I will not accept liability for any loss or damage, including without limitation any loss of profit, which may arise directly or indirectly from the use of or reliance on such information.
All investments involve risk, and the past performance of a security, industry, sector, market, financial product, trading strategy, backtest, or individual's trading does not guarantee future results or returns. Investors are fully responsible for any investment decisions they make. Such decisions should be based solely on an evaluation of their financial circumstances, investment objectives, risk tolerance, and liquidity needs.
My Scripts/Indicators/Ideas/Algos/Systems are only for educational purposes!
Lineartrend

Deming Linear Regression [wbburgin]Deming regression is a type of linear regression used to model the relationship between two variables when there is variability in both variables. Deming regression provides a solution by simultaneously accounting for the variability in both the independent and dependent variables, resulting in a more accurate estimation of the underlying relationship. In the hard-science fields, where measurements are critically important to judging the conclusions drawn from data, Deming regression can be used to account for measurement error.
Tradingview's default linear regression indicator (the ta.linreg() function) uses least squares linear regression, which is similar but different than Deming regression. In least squares regression, the regression function minimizes the sum of the squared vertical distances between the data points and the fitted line. This method assumes that the errors or variability are only present in the y-values (dependent variable), and that the x-values (independent variable) are measured without error.
In time series data used in trading, Deming regression can be more accurate than least squares regression because the ratio of the variances of the x and y variables is large. X is the bar index, which is an incrementally-increasing function that has little variance, while Y is the price data, which has extremely high variance when compared to the bar index. In such situations, least squares regression can be heavily influenced by outliers or extreme points in the data, whereas Deming regression is more resistant to such influence.
Additionally, if your x-axis uses variable widths - such as renko blocks or other types of non-linear widths - Deming regression might be more effective than least-squares linear regression because it accounts for the variability in your x-values as well. Additionally, if you are creating a machine-learning model that uses linear regression to filter or extrapolate data, this regression method may be more accurate than least squares.
In contrast to least squares regression, Deming regression takes into account the variability or errors in both the x- and y-values. It minimizes the sum of the squared perpendicular distances between the data points and the fitted line, accounting for both the x- and y-variability. This makes Deming regression more robust in both variables than least squares regression.

Leavitt Convolution Slope [CC]The Leavitt Convolution Slope indicator was created by Jay Leavitt (Stocks and Commodities Oct 2019, page 11), who is most well known for creating the Volume-Weighted Average Price indicator. This indicator is very similar to the Leavitt Convolution indicator but the big difference is that it is getting the slope instead of predicting the next Convolution value. I changed quite a few things from the original source code so let me know if you like these changes. I added a normalization function using code from a good friend @loxx that I recommend to leave on but feel free to experiment with it. Last but not least, the unsure levels are essentially acting as a buy or sell threshold. I personally recommend to buy or sell for zero crossovers but another option would be to buy or sell for crossovers using the unsure levels. I have color coded the lines to turn light green for a normal buy signal or dark green for a strong buy signal and light red for a normal sell signal, and dark red for a strong sell signal.
This is another indicator in a series that I'm publishing to fulfill a special request from @ashok1961 so let me know if you ever have any special requests for me.

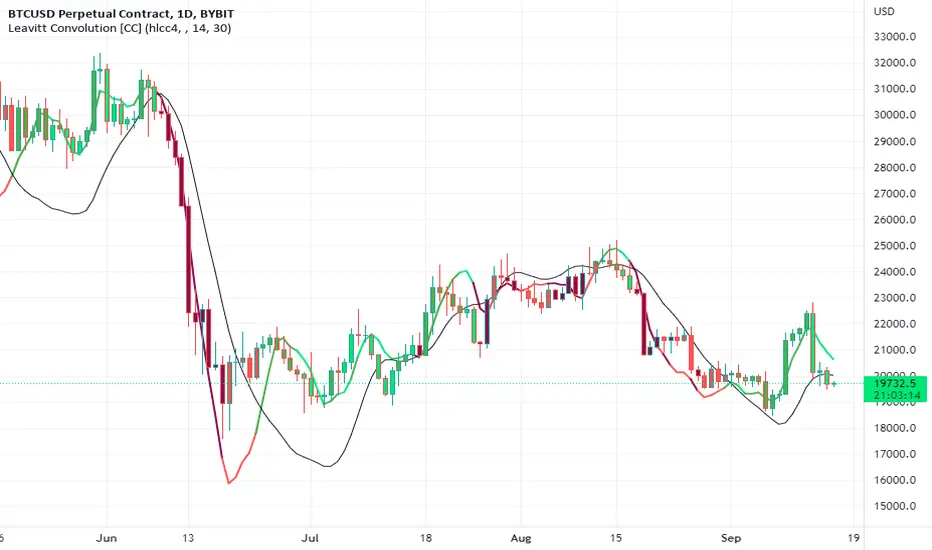
Leavitt Convolution [CC]The Leavitt Convolution indicator was created by Jay Leavitt (Stocks and Commodities Oct 2019, page 11), who is most well known for creating the Volume-Weighted Average Price indicator. This indicator is very similar to my Leavitt Projection script and I forgot to mention that both of these indicators are actually predictive moving averages. The Leavitt Convolution indicator doubles down on this idea by creating a prediction of the Leavitt Projection which is another prediction for the next bar. Obviously this means that it isn't always correct in its predictions but it does a very good job at predicting big trend changes before they happen. The recommended strategy for how to trade with these indicators is to plot a fast version and a slow version and go long when the fast version crosses over the slow version or to go short when the fast version crosses under the slow version. I have color coded the lines to turn light green for a normal buy signal or dark green for a strong buy signal and light red for a normal sell signal, and dark red for a strong sell signal.
This is another indicator in a series that I'm publishing to fulfill a special request from @ashok1961 so let me know if you ever have any special requests for me.
Leavitt Projection [CC]The Leavitt Projection indicator was created by Jay Leavitt (Stocks and Commodities Oct 2019, page 11), who is most well known for creating the Volume-Weighted Average Price indicator. This indicator is very simple but is also the building block of many other indicators, so I'm starting with the publication of this one. Since this is the first in a series I will be publishing, keep in mind that the concepts introduced in this script will be the same across the entire series. The recommended strategy for how to trade with these indicators is to plot a fast version and a slow version and go long when the fast version crosses over the slow version or to go short when the fast version crosses under the slow version. I have color coded the lines to turn light green for a normal buy signal or dark green for a strong buy signal and light red for a normal sell signal, and dark red for a strong sell signal.
I know many of you have wondered where I have been, and my personal life has become super hectic. I was recently hired full-time by TradingView, and my wife is pregnant with twins, and she is due in a few months. I will do my absolute best to get back to posting scripts regularly, but I will post a bunch today in the meantime to fulfill a special request from one of my loyal followers (@ashok1961).

Linear Regression Relative Strength[image/x/iZvwDWEY/
Relative Strength indicator comparing the current symbol to SPY (or any other benchmark). It may help to pick the right assets to complement the portfolio build around core ETFs such as SPY.
The general idea is to show if the current symbol outperforms or underperforms the benchmark (SPY by default) when bought some certain time ago. Relative performance is displayed as percent and is calculated for three different time ranges - short (1 mo by default), mid (1 quarter), and long (half a year). To smooth the volatility, the script uses linear regression to estimate the trend and takes the start and the end points of the linear regression line to compute the relative strength.
It is important to remember that the script shows the gain relative to SPY (or other selected benchmark), not the asset's gain. Therefore, it may indicate that the asset is profitable, but it still may lose value if SPY is in downtrend.
Therefore, it is crucial to check other indicators before making a decision. In the example above, standard linear regression for one quarter is used to indicate the direction of the trend.

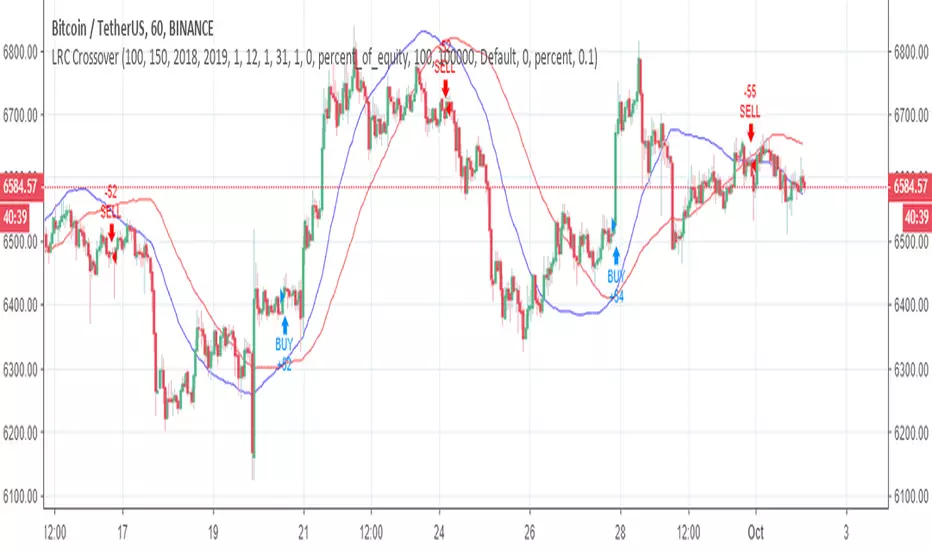
Linear trendSimple way how to use Linear Regression for trading.
What we use:
• Linear Regression
• EMA 200 as a trend filter
Logic:
Firstly we make two different linear regression movings as oscillator. For this we need to subtract slow moving from fast moving, so we get the single moving around zero. This is the green/red line which appears on the chart.
The trade open when LR cross over the threshold. The trade close when LR cross under the threshold below. Crossing over the threshold is the same as faster moving cross over slower moving.
Also we use EMA as a filter. The trades would be only when the price is over than EMA 200.

Linear Regression Channel Breakout StrategyThis strategy is based on LonesomeTheBlue's Linear Regression Channel Indicator. First of all, I would like to thank LonesomeTheBlue. Breaking the Linear Regression Channel to close the candle triggers a Long or Short signal. If the slope of the Linear Regression Channel is positive, it is Short when it breaks out the lower line, and when the slope is negative, it is Long when it breaks out the upper line. The default is optimized for 8-hour candles, and for other hour candles, find the optimal value yourself. Below is a description of LonesomeTheBlue's Linear Regression Channel.
이 전략은 LonesomeTheBlue의 Linear Regression Channel Indicator를 기반으로 만들어졌습니다. 우선 LonesomeTheBlue님께 감사의 말씀을 드립니다. Linear Regression Channel을 돌파하여 봉 마감하면 Long 또는 Short 신호를 트리거합니다. Linear Regression Channel의 기울기가 양인 경우 하단 라인을 돌파하면 Short이고 그 기울기가 음인 경우 상단 라인을 돌파하면 Long입니다. 기본값은 8시간봉에 최적화 되어 있으며, 다른 시간봉은 직접 최적값을 찾아보십시오. 아래는 LonesomeTheBlue의 Linear Regression Channel에 대한 설명을 퍼왔습니다.
________________________________________________
There are several nice Linear Regression Channel scripts in the Public Library. and I tried to make one with some extra features too. This one can check if the Price breaks the channel and it shows where is was broken. Also it checks the momentum of the channel and shows it's increasing/decreasing/equal in a label, shape of the label also changes. The line colors change according to direction.
using the options, you can;
- Set the Source (Close, HL2 etc)
- Set the Channel length
- Set Deviation
- Change Up/Down Line colors
- Show/hide broken channels
- Change line width
meaning of arrows:
⇑ : Uptrend and moment incresing
⇗ : Uptrend and moment decreasing
⇓ : Downtrend and moment incresing
⇘ : Downtrend and moment decreasing
⇒ : No trend

Linear SSL ShortThis script consist of two parts: linear SSL and DEMA. The difference between original SSL and current is that it calculated by linear regression. The logic is simple: when SSL "crossunder" and DEMA is above the price - we get short signal. When price became above DEMA and SSL "crossover" - close short.

Linear Regression (All Data)The tool plots a linear regression line using the entire history of an instrument on chart. There are may be issues on intraday timeframes less then 1h. On daily, weekly and monthly charts it works without problem.
If an instrument has a lot of data points, you may not see the line (this is TV feature):
To fix that you need to scroll your chart to the left and find the starting point of the line:
And then do an auto-scroll to the last bar:

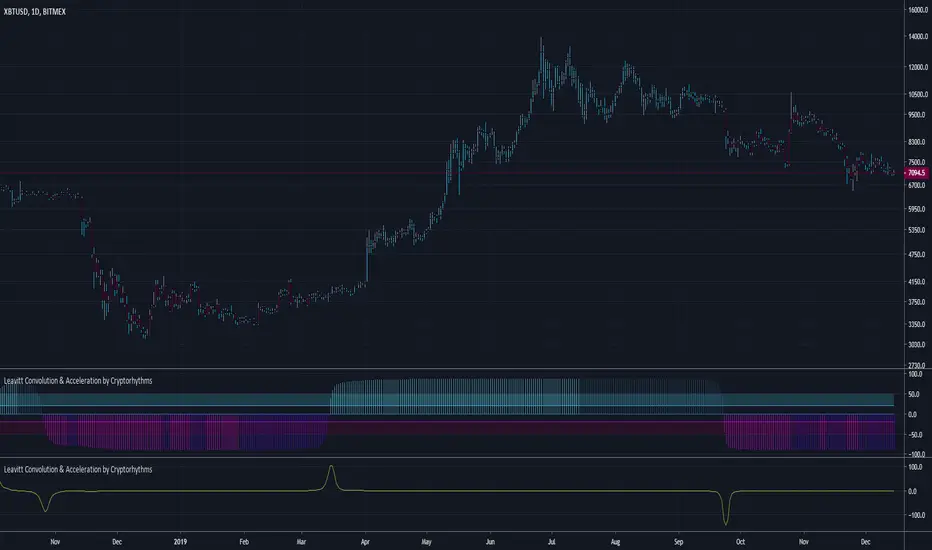
Leavitt Convolution & Acceleration by CryptorhythmsLeavitt Projection, Convolution, & Acceleration by Cryptorhythms
Intro
Bringing you another open source Gem this time from the January 2020 Issue of TASC.
Description
In the article in the Oct 2019 TASC issue titled "An interplanetary marriage" author Jay Leavitt describes the evolution process required in strategy design by introducing his Mars strategy. This grew out of concepts presented in his earlier TASC articles such as the stratosphere, moon rocket, and tech emini strategies. This dual indicator uses a linear regression of price data to help derive slope and acceleration information, in turn helping him to identify trends and trend turning points.
Additions
As usual a few useful extras are included such as a rudimentary signaling system, bar coloration by trade state, overbought/oversold areas to assist in algorithmic setups, and more!
👍 We hope you enjoyed this indicator and find it useful! We post free crypto analysis, strategies and indicators regularly. This is our 71st script on Tradingview!
💬Check my Signature for other information
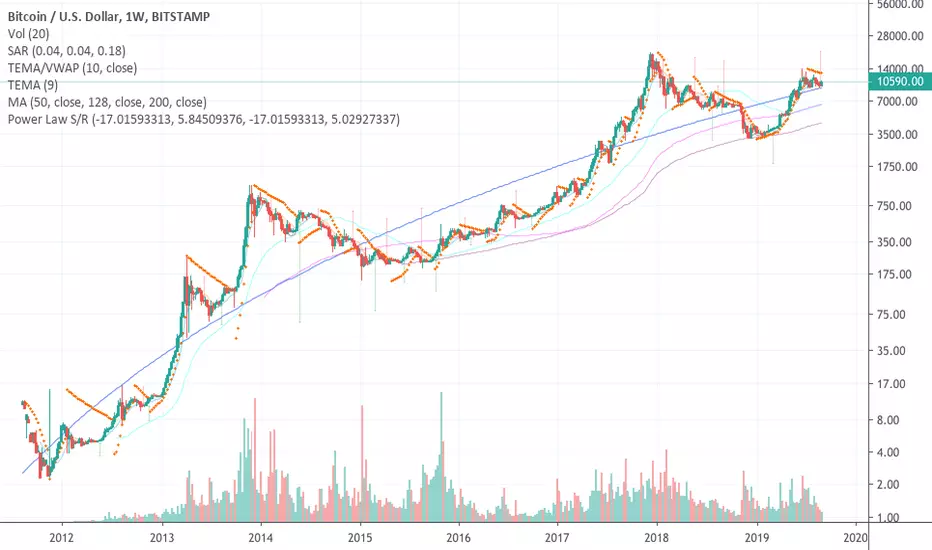
Power Law S/RBerger's article on the Power Law Model for Bitcoin is a compelling read and gives the best evidence so far of the diminishing case for retracing below $3000, of a slowing market on a log-log plot, and reducing but continued volatility.
After seeing it acts as support routinely in the last 10 years, I put together a quick little script that plots his midline curve for Bitcoin. You can change the intercept and slope but will need to do your own calculations for other curves.
I hope you all like it.

Function for Least Squares Moving AverageThank you to alexgrover for putting me wide to this, after putting up with long conversations and stupid questions. Follow him and behold: www.tradingview.com
What is this?
This is simply the function for a Least Squares Moving Average. You can render this on the chart by using the linreg() function in Pine.
Personally I like to use the slope of the LSMA to help determine what direction to take a trade in, but I'm sure there are other, more exotic ways of using it and, if you know how to get your fingers dirty with Pine, you can create more exotic versions of it by modifying the function provided.
Want to learn?
If you'd like the opportunity to learn Pine but you have difficulty finding resources to guide you, take a look at this rudimentary list: docs.google.com
The list will be updated in the future as more people share the resources that have helped, or continue to help, them. Follow me on Twitter to keep up-to-date with the growing list of resources.
Suggestions or Questions?
Don't even kinda hesitate to forward them to me. My (metaphorical) door is always open.