Trading System(Dark)Combo of many useful indicators, contains
1)Regular and Hidden Divergence Buy and Sell signals by scarf
2)Time and Money channels by Lazybear
3)Fibonacci Bollinger Bands by Rashad
4)Linear Regression Curve by ucsgears
Thanks for all the creators for the source codes!
Linear
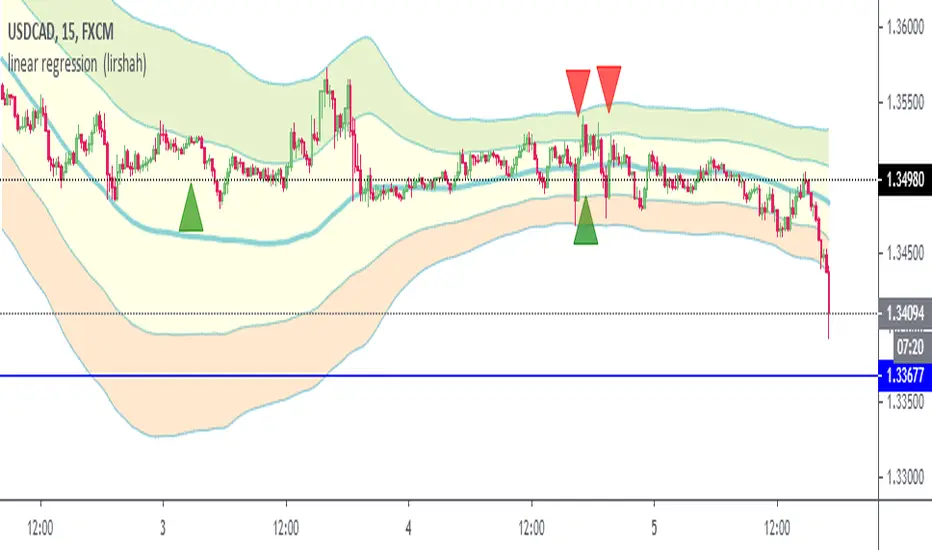
linear regression channel (lirshah)linear regression channel is an indicator which has been written according to linear regression and exponential moving average (ema).
the indicator nicely shows major trend and key levels and has a good performance on almost all pairs and time frames.
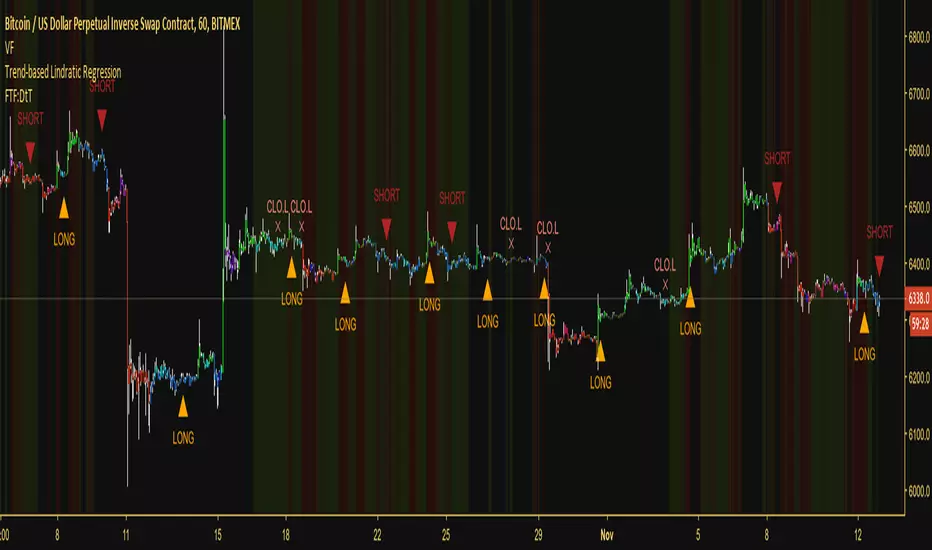
Trend-based Lindratic RegressionThis is an effective trend-following script that uses a finite volume element, linear regression, quadratic regression and multiple EMAs to define appropriate times to enter and exit the market. It can be applied to any asset that has volume data available for it.
As it follows the trend it's a very low-risk strategy, but it's not made to catch and ride reversals. It would rather close a long at the top and close a short at the bottom, although this means you can expect not to be stopped out on any trade you take.
Works on any timeframe, although I did create this with the intention of scalping, so shorter timeframes are recommended.
Combined with a volatility filter, this would be a very effective script, allowing you to stand away from the market during flat periods and trading with the trend during exciting periods.
Access to the script will be grated for 10$ of most low-fee cryptocurrencies, as well as BTC. If you're interested reach out to me through TradingView or, alternatively, contact @overttheraibow through Telegram.
If there's enough demand for it, I will also create a strategy version of this study which will be given for free to those who purchased the script. As always, maximum 250 places available.
Good luck!
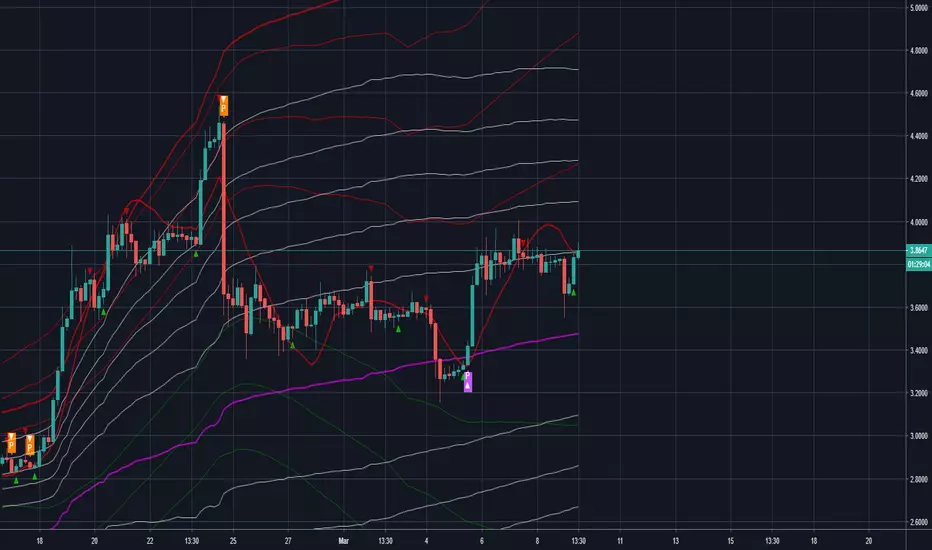
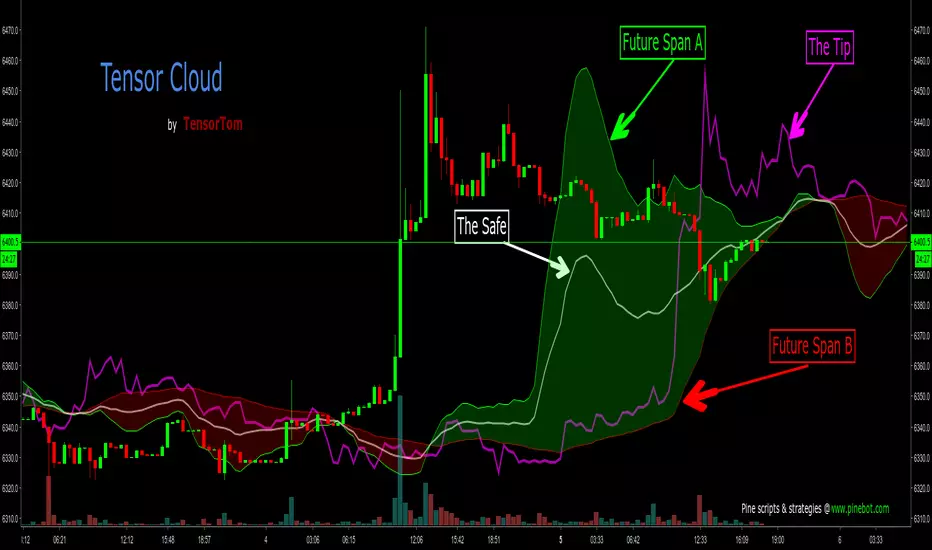
Tensor CloudIntroducing the Tensor Cloud. This is probably the best indicator I've come up with so far. I'm really proud of it. Ichimoku is a brilliant system. It's been around for over half a century and I praise Goichi Hosoda for his brilliant work. However, it's time for something new. I love math and this indicator really showcases that. The Tensor Cloud is an indicator of its own. It is not related to Ichimoku at all. The only thing they have in common is that they both form clouds. The maths in Tensor Cloud are 100% apart.
The Tensor Cloud is mostly comprised of some special forms of linear regression. Let's do a rundown.
Future Span A (Green)
This is one predictor using a linear regression technique. Future Span A is one of the two lines that makes up a Tensor Cloud. From here on out it will traditionally be colored green. It can be used as both a predictor on its own and comprising the Tensor Cloud. This can also be viewed as sort of a long signal when crossing up Future Span B. This line can also be used to help identify levels of support and resistance.
Future Span B (Red)
This is another form of linear regression meant specifically to work alongside Future Span A. This is the second line that comprises a Tensor Cloud. From here on out it will traditionally be colored red. It can be used both as a predictor on its own and comprising the Tensor Cloud. This can also be viewed as sort of a short signal when crossing down through Future Span A. This line can also be used to help identify levels of support and resistance.
Safe (White)
The Safe is a moving average taken of Future Span A and Future Span B. It is highly predictive. From here on out it will traditionally be colored white.
Tip (Fuchsia)
This is yet another form of regression and is highly predictive. The Tip can also be used to help judge trend strength and probability of reversal. More study is of course needed. More on that later in this description. From here on out it will traditionally be colored fuchsia. This line can also be used to help identify levels of support and resistance.
The Tensor Cloud
The space between Future Span A and Future Span B is shaded in green or red, depending on which Future Span is on top. If Future Span A is on top, the Tensor Cloud will be green. This is considered a long signal. If Future Span B is on top, the Tensor Cloud will be colored red. This is a short signal. Attention should also be given to other factors such as:
The position of price in relation to the Tensor Cloud (Under, inside or above).
The position of Tip in relation to the Tensor Cloud.
Crosses of Future Span A and Future Span B.
Tensor Twist
Whenever Future Span A and Future Span B cross (In either direction), this is called a Tensor Twist. If Future Span A is crossing up, this is a long Tensor Twist. If Future Span B is crossing up, this is a short Tensor Twist.
Closing Summary
Much study needs to be done. This is a brand new technique. It's up to all of you to help figure out the best ways to use it. I may still add other components to this indicator but it's pretty solid as is. You will notice that the two integer inputs are set to 27. Twenty-seven is a very important number in mathematics. The details of that are beyond the scope of this description but from here on out, the traditional setting for those will be 27. You will notice that I am not yet releasing the source code to this indicator. For now, it will remain protected. Once I have enough feedback and we're all happy with the final result, I will release the code for the world to have. I have no wish of keeping this closed-source (As profitable as that might be). I just want it to help as many people as possible.
Please share this on social media so we can attract as many testers to give feedback as possible. For publishing this for free, that's all I ask in return. That way it will be as solid as possible when I release the source code.
Enjoy!
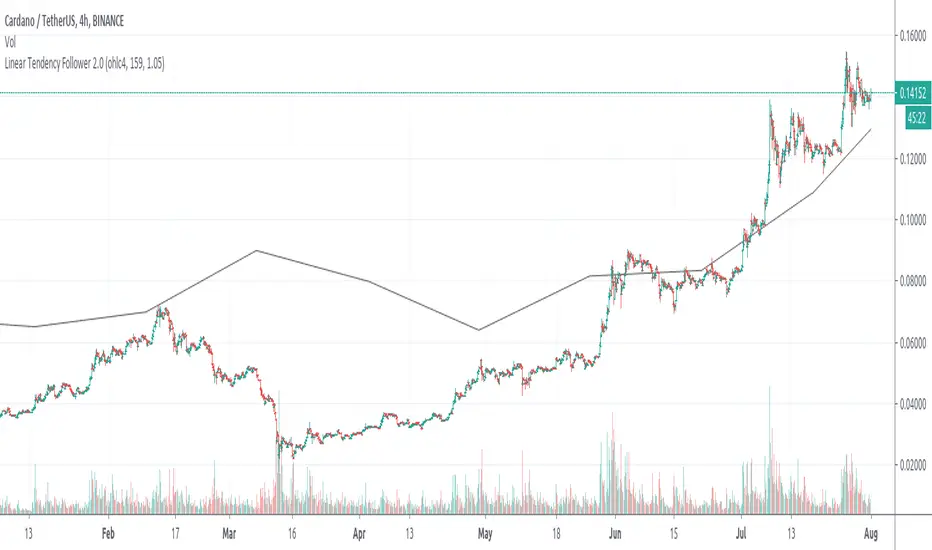
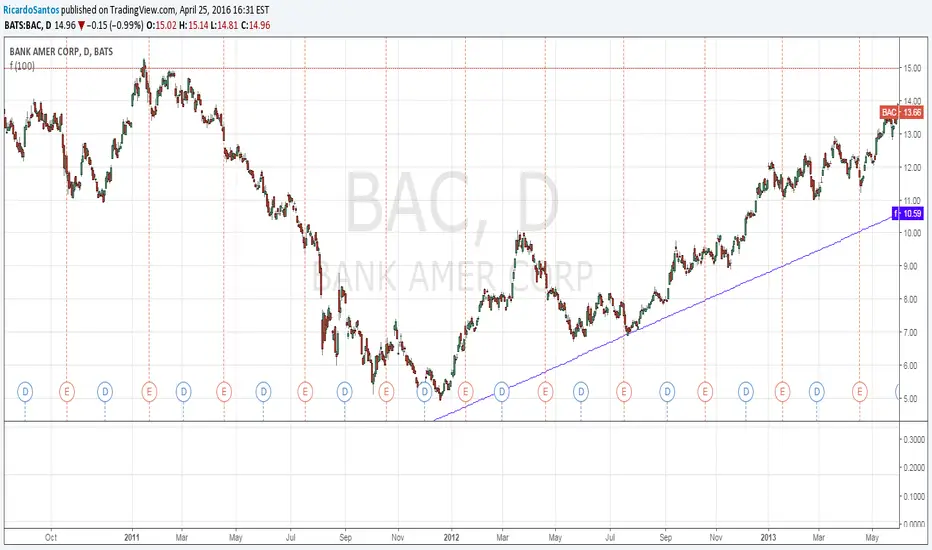
Linear Tendency FollowerLinear Trend Follower follows 'source' trend using lines within a number of periods ('length') using the last n periods source variation divided by 'length' as line slope. It is delayed by 'length' periods.
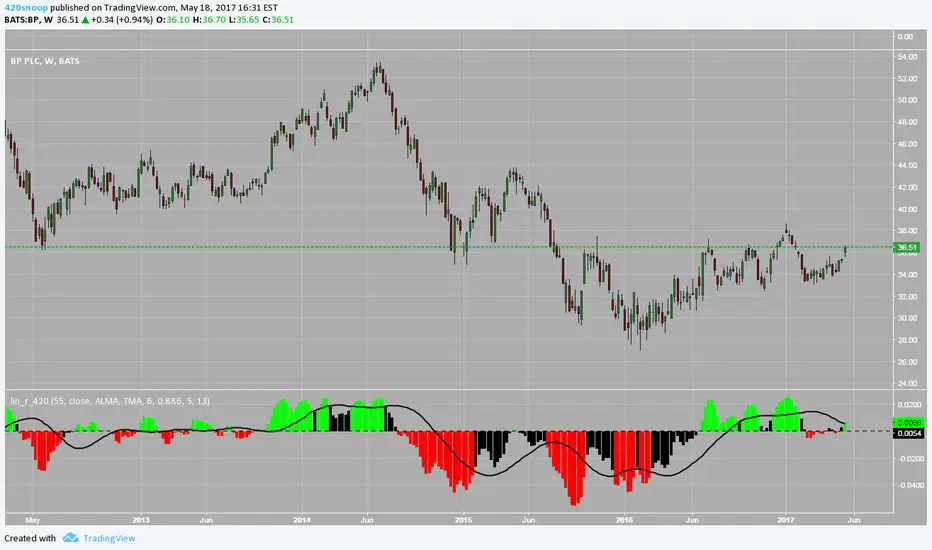
lin.reg.s_420Hey all,
Snoop here with another script this one is linear regression slope analysis;
I used a base skeleton script of /u/ucsgears before adding some other cumulative log filtering and average customization functions I like :)
If you have success with this script feel free to buy me a coffee through my bitcoin address :)
Appreciate the love I get from the community! Thanks all and happy trading!
-Snoop
Momentum Linear RegressionThe original script was posted on ProRealCode by user Nicolas.
This is an indicator made of the linear regression applied to the rate of change of price (or momentum). I made a simple signal line just by duplicating the first one within a period decay in the past, to make those 2 lines cross. You can add more periods decay to made signal smoother with less false entry.

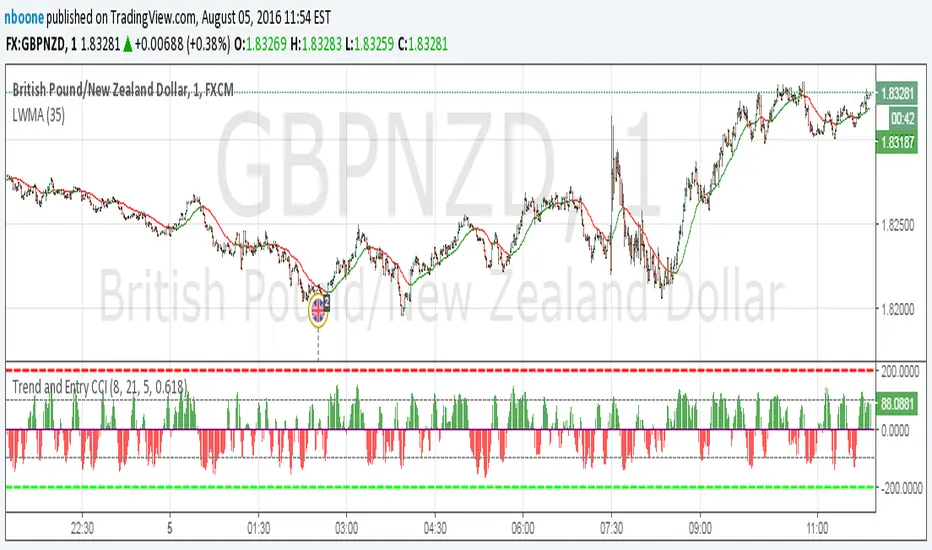
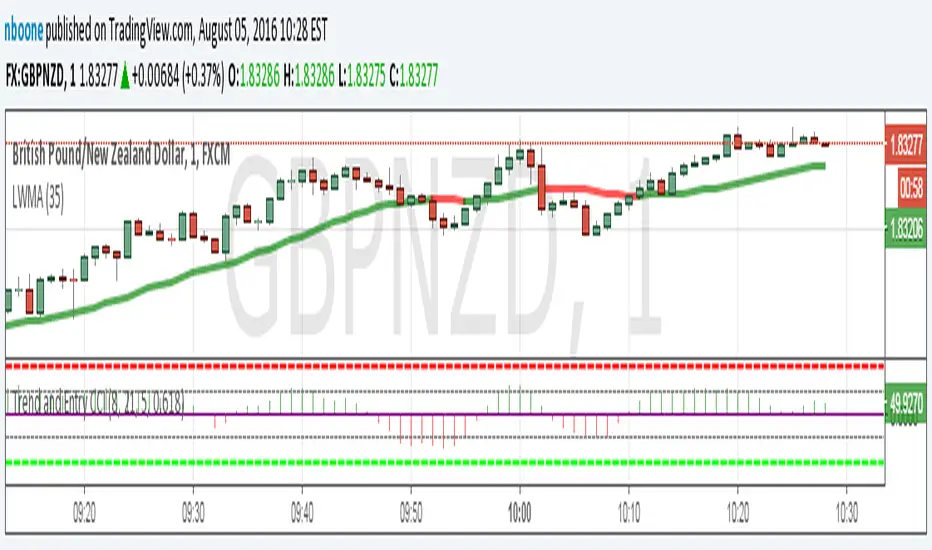
LWMA w/ Color ChangeLinear Weighted MA that changes colors based on slope.
Green = slope up from last bar
Yellow = slope is 0 from last bar
Red = slope down from last bar
This time with the ability to change the period.
LWMA w/ Color ChangeLinear Weighted MA that changes colors based on slope.
Green = slope up from last bar
Yellow = slope is 0 from last bar
Red = slope down from last bar
Function 2 Point Line using UNIX TIMESTAMP V1experimental:
draws a line from 2 vectors(price, time)
update:
reformatted the function,
added automatic detection of the period multiplier by approximation(gets a bit goofy with stocks/week time),
example using timestamp() function.
offsetting is still bugged, i cant find a way around it atm.
Function Linear Decay V2EXPERIMENTAL:
improved range detection (it now locks range when its last formed on the appropriate side improving readability as it doesnt auto adjust when opposite extreme moves)

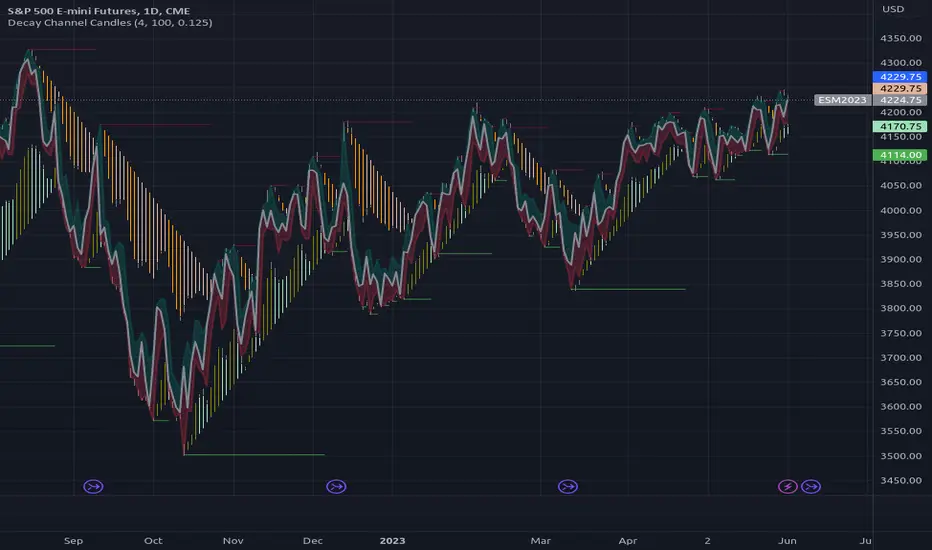
[RS]Decay Channel Candles V0EXPERIMENTAL: Experiment using Linear Regression based on %atr for decay(decay option is a mutiplier for the atr).
[RS]Linear Regression Bands V1experiment with linear regression, the purpose was to catch break outs early, but it creates to much visual noise
same as version 0 but with added margin filter and signal to mark entrys

[RS]Average Advance and Decline Lines V0Method to draw linear regression lines from average price advance&decline range

Linear Regression Slope - Version 2Version 2 - Linear Regression Slope. This version will have more freedom on picking your own length for all the Inputs.
One of the main reason I changed it is because, Slope calculation on transition period was not being computed properly. Because the Version 1, looks back the length assigned, and compute the slope based on two candle readings, could be 10 days apart or 50. That was misleading.
Therefore, I changed it to plot daily slope and Smooth it with an EMA.
Linear Regression Curve -
List of All my Indicators - www.tradingview.com
Linear Regression SlopeCorrected Version, for
VERSION - 2 () updated for Custom Length, and fixed some formula glitches.

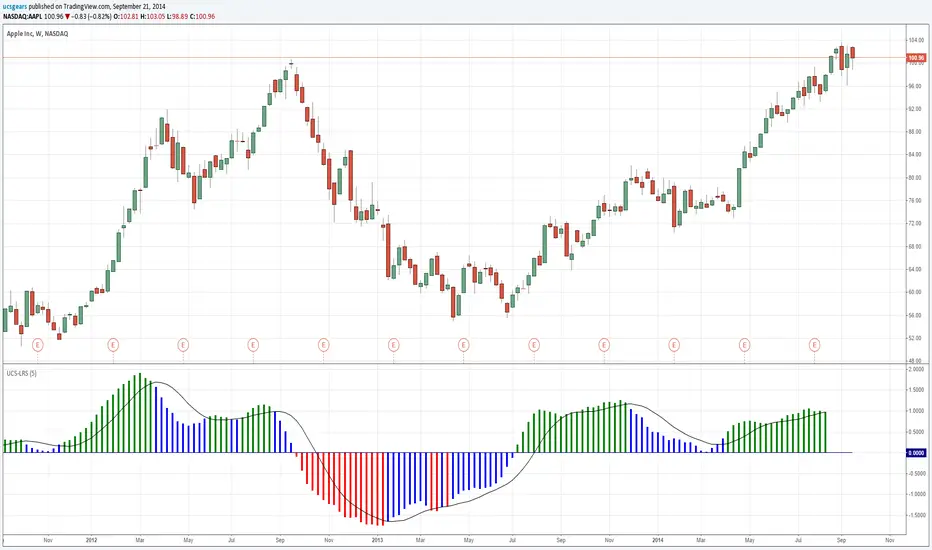
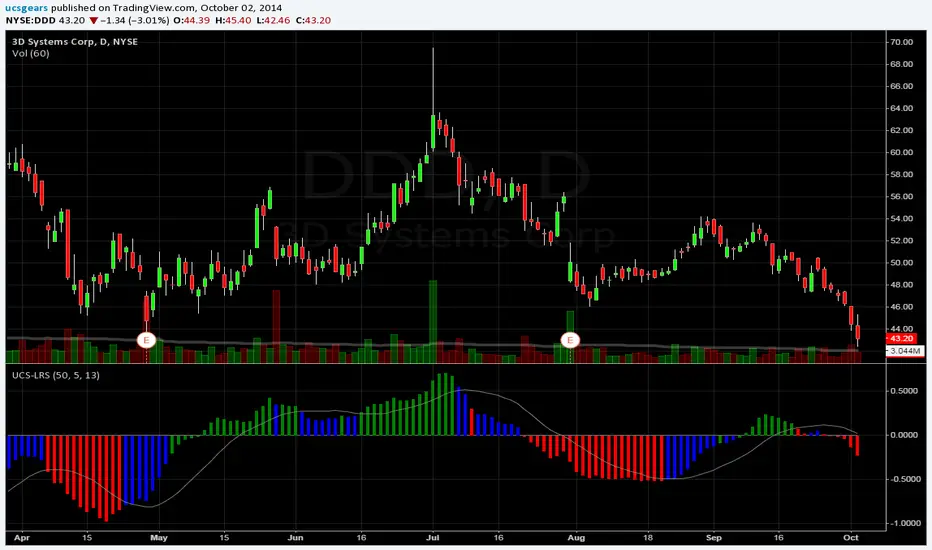
UCSgears_Linear Regression SlopeThis is version 1 of the Linear Regression Slope. In ideal world the Linear regression slope values will remain same for any time period length. because the equation is y = mx+b, where m is the slope. All I did here is m = y/x
The Main Purpose of this indicator is to see, if the Trend is accelerating or decelerating.
The first Blue bar will caution when a strong trend is losing strength. I will leave the rest for you to explore.
I picked AAPL again, because it does have both up and down trend, in the recent time.
Mistake in the code
Corrected Version -